

META — Advertising, agents and the cash-flow test
Update — October 31, 2026. Research and valuation prices below are the October 28–29 snapshot. Meta’s October 21 results already reported $64.60B revenue, $32.79B operating cash flow and −$2.12B free cash flow; 2026 capex guidance is $135–145B. Amazon reported October 29: AWS revenue grew 39% to $46.0B, but trailing-twelve-month free cash flow was −$42.4B and 2026 cash capex guidance about $220B. Its result replaces the old pending event and supports continued infrastructure intensity, not an industry-wide peak. Oracle’s peak-capex schedule is its own forecast. Meta’s next exact results date was not company-confirmed in this review; January 27 remains an estimate.
For twenty years, typed search intent supported a valuable advertising auction. Language models and agents can move some discovery and shopping into conversational interfaces. Meta has a different starting point: a large feed-ad business that does not require a typed query, plus the early Muse agent. The investment case is that better recommendations and new commerce tools can raise revenue while infrastructure spending eventually becomes less intensive. That cash outcome depends on operating costs, commitments and continued product demand.
What Changed
Start here. An advertisement is a message a business pays to put before a potential customer. Purchase intent means a signal that someone wants a product now. A search engine captures that signal from a typed query and auctions advertising space around the results. A language model produces a conversational answer; an agent can also compare products and, with authorization, complete tasks. Some agent-led journeys may bypass a conventional search-results ad auction. Others still involve sponsored results, marketplaces or referral fees. The shift changes where intent is observed and monetized; it does not remove all advertising.
George Gilder saw the threat early. His 2018 book Life After Google argued that a business built on collecting attention for free and selling it to advertisers would be displaced, and he pointed at the Brave browser, which blocks trackers and pays users in tokens, as the shape of the challenger. The challenger turned out to be different. Brave did not move much intent. ChatGPT did, then Gemini inside Google itself, and in September 2026 a personal agent from Meta. The mechanism Gilder described is arriving through the answer box rather than the browser.
Google's own third quarter shows the mechanism in its numbers. Search & other revenue grew 12% to $63.35B, down from 17% growth in the second quarter, while Alphabet said query growth was the fastest in five years. More questions, slower revenue. Philipp Schindler, Alphabet's chief business officer, named one cause on the 28 October call:
It's worth noting that the strong growth in AI Mode queries had an impact because of the lower monetization we were seeing in AI Mode.
Schindler also cited currency and an EU customs change, while Alphabet says advertising inside AI answers is scaling. Lower AI Mode monetization is evidence of a transition cost, but the 12% Search growth figure does not isolate AI as its cause. Fewer visible ad slots can reduce revenue per query; pricing, usage and future ad formats can offset part of that effect.
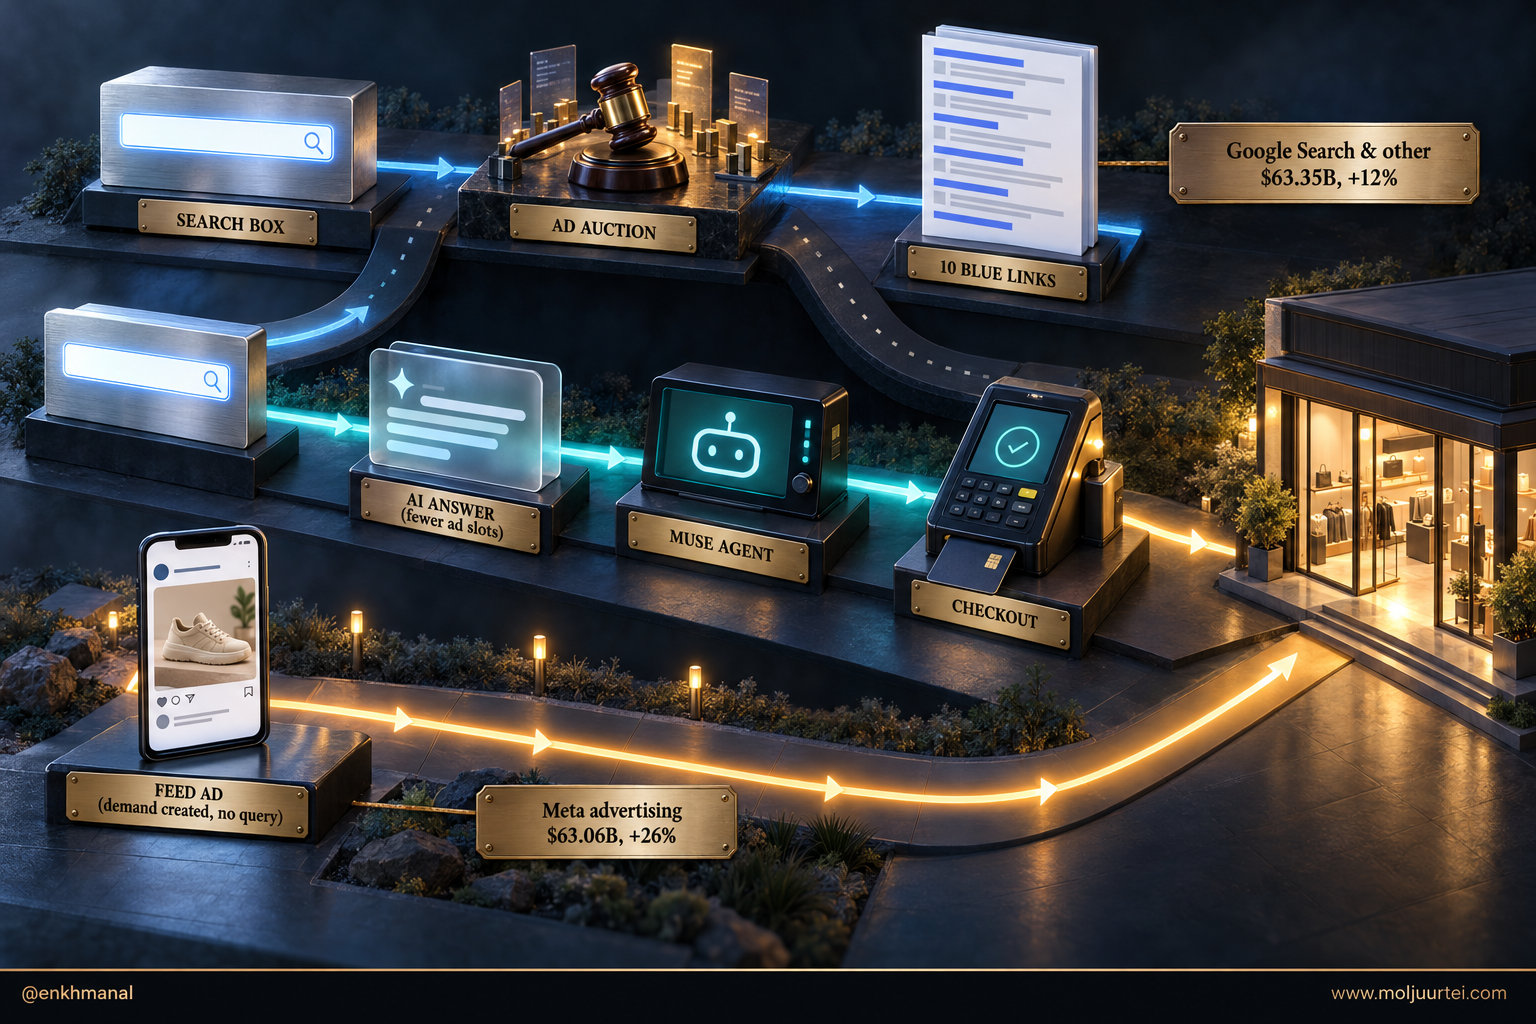
Four routes can coexist. Google can monetize AI answers; chatbots can add ads; marketplaces can keep customers within their own shopping interfaces; and agents can seek transaction fees from merchants. Meta combines feed distribution with an early agent product, but it is not the only possible winner. Competing agents, marketplace access and advertisers’ budgets can affect its core business too.
Meta’s specific advantage is a recommendation-and-advertising system that already earns revenue without a typed query. Muse could add a more direct commerce relationship. Owning compute may improve control over unit costs, but buying infrastructure alone does not guarantee better shareholder returns than selling it.
Thesis
Meta can use recommendations to create demand across 3.64B daily people, while Muse may capture some shopping tasks moving into agents. The core ad business provides the evidence today; agent fees are an emerging monetization plan. If operating cash flow grows faster than infrastructure and serving costs, free cash flow can recover. Neither a near-term capex peak nor profitable agent scale is established yet.
We covered the funding side of this story in July, in Meta is the only hyperscaler that can afford its ambition; since then the bill has arrived and so has the product.
Business & Backdrop
Meta is, to a first approximation, one business. In Q3 2026 advertising was 97.6% of revenue, and Family of Apps (Facebook, Instagram, WhatsApp, Messenger, Threads) earned $17.12B of operating income while Reality Labs lost $4.13B. Revenue is ad impressions times price per ad: impressions grew 10% and price per ad 14%, so demand absorbed the extra inventory at higher prices. Average revenue per daily person reached $17.72 a quarter.
The table retains the stated dates and units.
Advertising supplied about 97% of the revenue increase. Paid messaging and subscriptions grew faster from a much smaller base, at 59%. They indicate additional monetization routes, but Meta has not said that all future agent-commerce revenue will appear in that line.
The trend is a growth company that has been re-accelerating, with margins now absorbing the AI build. Annual revenue went from $70.70B in FY19 to $200.97B in FY25. Revenue growth ran 26.6% in FY19, 21.6% in FY20, 37.2% in FY21, −1.1% in FY22, 15.7% in FY23, 21.9% in FY24 and 22.2% in FY25, and operating margin was 33.9%, 38.0%, 39.6%, 24.8%, 34.7%, 42.2% and 41.4% over the same years, with net margin at 26.1% in FY19 and 37.9% in FY24. Net margin fell to 30.1% in FY25 with a material effect from a $15.93B one-time tax charge. FY26 revenue implied by nine reported months plus the Q4 guide is about $256B, +27.5%.
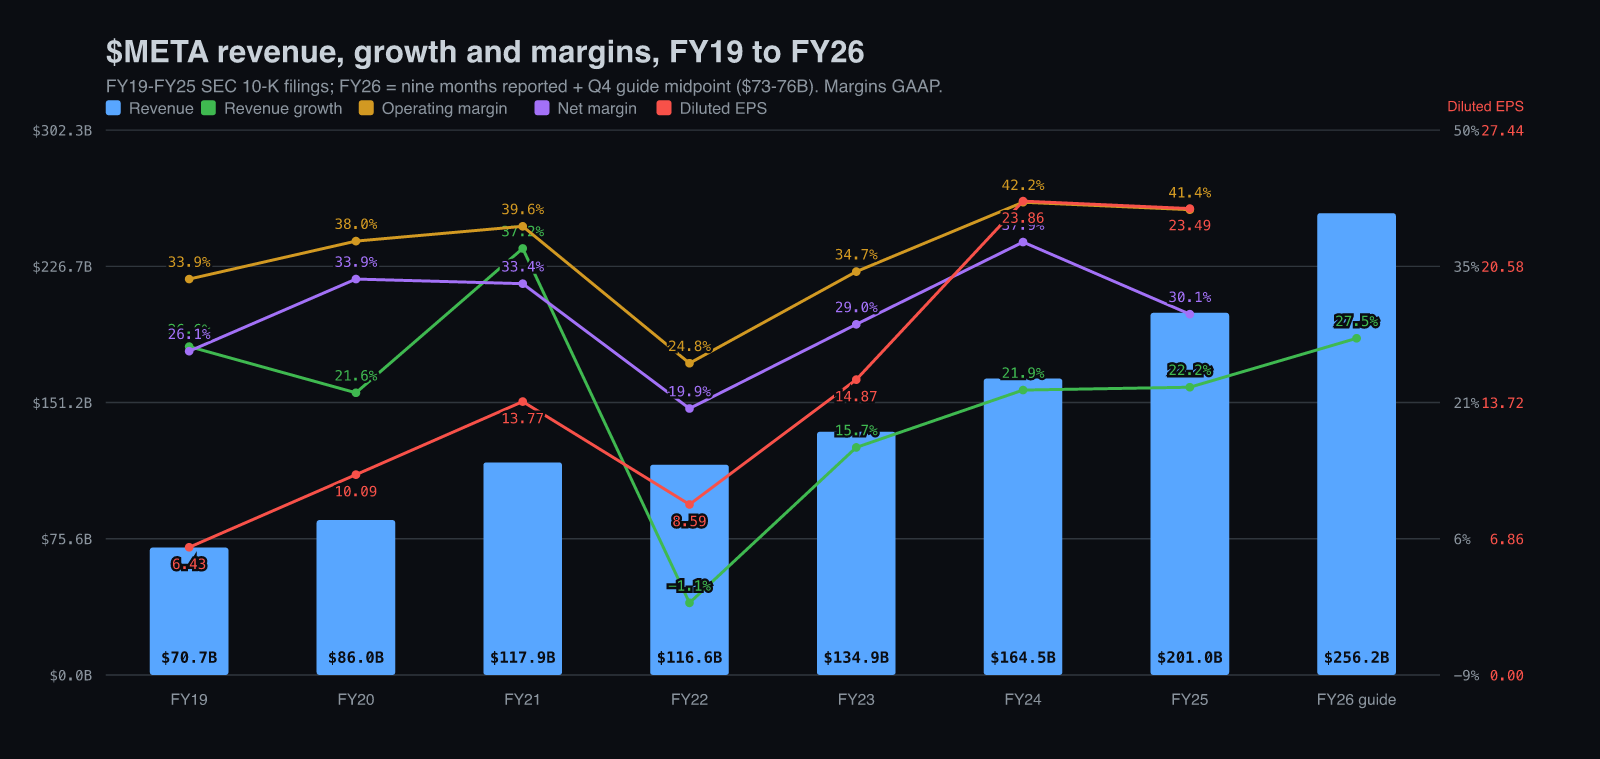
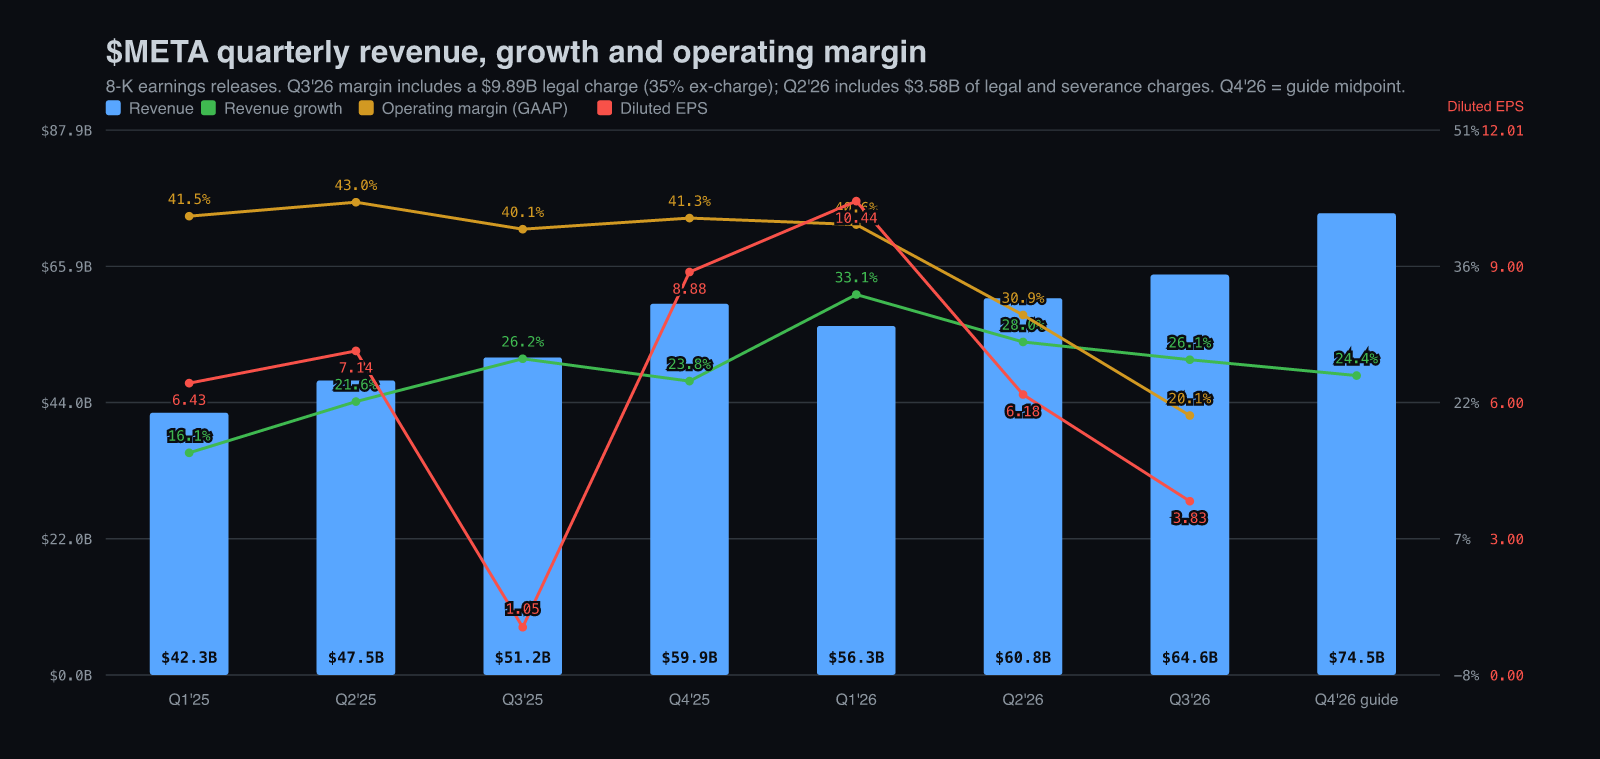
By quarter the picture is sharper. Revenue growth was 16.1% in Q1 2025, 21.6% in Q2, 26.2% in Q3 and 23.8% in Q4, then 33.1% in Q1 2026, 28.0% in Q2 and 26.1% in Q3, and the Q4 2026 revenue guide of $73B to $76B implies about 24%. GAAP operating margin was 41.5% in Q1 2025, 43.0% in Q2, 40.1% in Q3, 41.3% in Q4 and 40.6% in Q1 2026, then fell to 30.9% in Q2 2026 and 20.1% in Q3 2026. Most of that fall is legal: excluding the $9.89B attorneys-general charge, Q3 margin was 35.4%. The rest is depreciation and third-party cloud bills, which is the capex story arriving on the income statement.
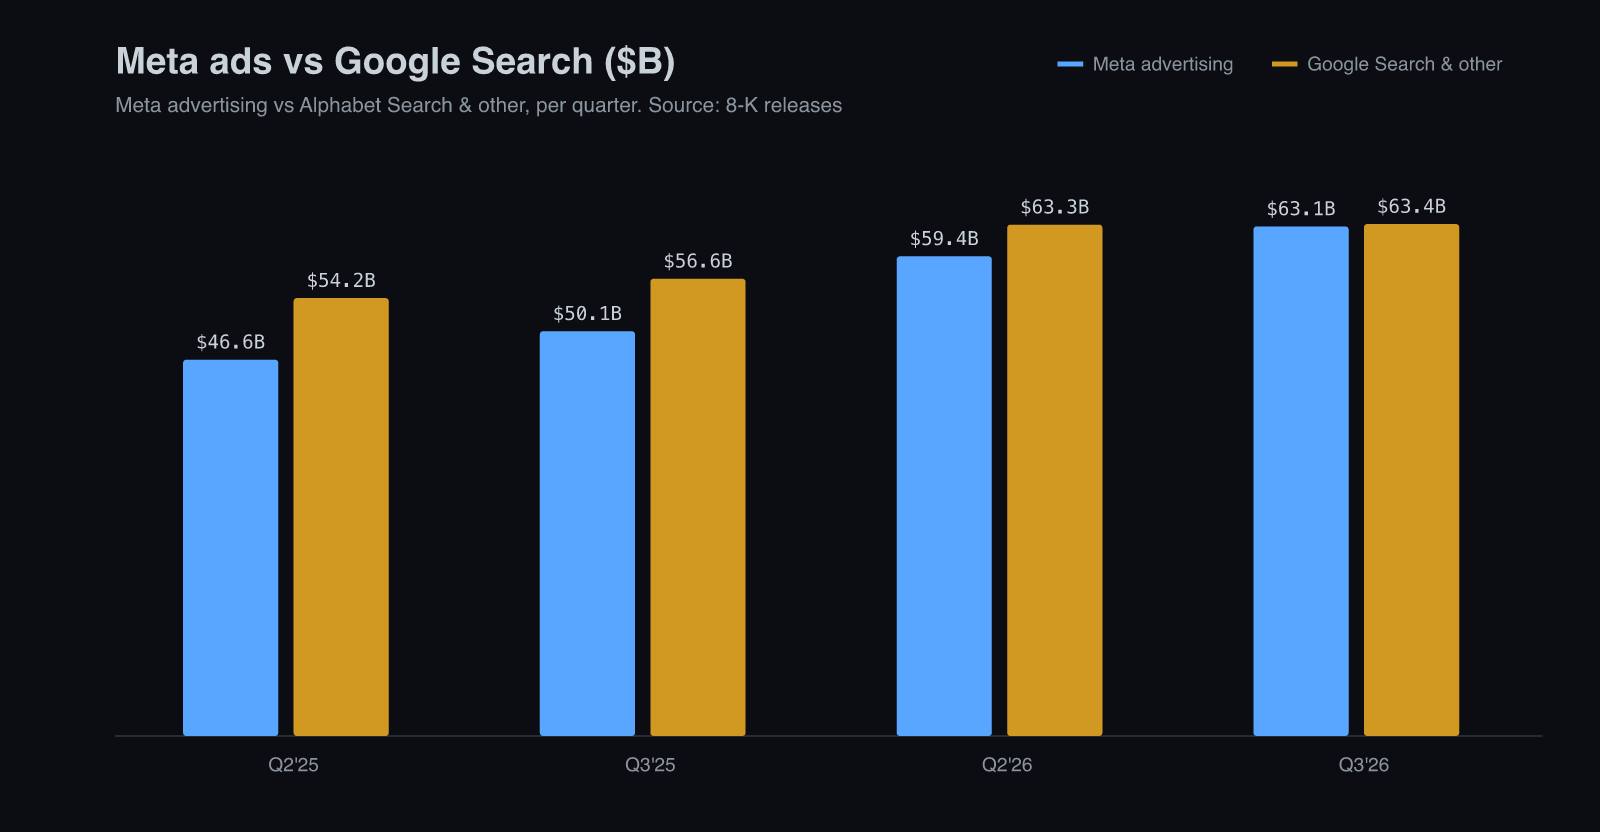
Set against Google, the comparison that matters is the one in the chart below. Two years ago Google Search out-earned all of Meta's advertising by about $8B a quarter. In Q3 2026 the gap was $0.29B, because Meta's ads grew 26% while Search grew 12%.
What just printed reinforces the gap between the business and the cash. Q3 revenue of $64.6B beat the top of the $61B to $64B guide, the Q4 guide of $73B to $76B implies another 22% to 27%, and the 2026 capex range moved up only at the bottom, to $135B to $145B from $130B to $145B. The guide has walked up all year, from $115B to $135B in January, and that walk is the risk, not the revenue. The stock fell from $697.52 to $648.85 the next day and to $612.49 by 28 October.
The market Meta is chasing is the share of commerce that starts with a want rather than a search. Meta's own count is that at least 500 million self-identified small businesses use its apps to reach customers, and Zuckerberg says the annual revenue Meta already earns from a typical American user is several hundred dollars. The question is not whether that base exists but whether the agent layer adds to it.
Technology & Moat
A search ad captures demand that already exists: someone typed 'running shoes', so the shoe brand bids. A feed ad creates demand: nobody asked, but the system predicted that this person, shown this video of these shoes now, is likely to buy. The second job is harder, because the system has to guess intent from behaviour instead of reading it from a query. Meta's moat is that it has spent fifteen years getting good at the guess, on more daily people than any other company.
The machinery is a chain of models. Andromeda retrieves a short list of candidate ads from millions; GEM, Meta's ads-ranking foundation model, scores them; and the Meta Generative Recommender, introduced in Q2, uses language-model reasoning across ad content and user preference to pick the best one. Each step was measured on the Q3 call: GEM's expansion lifted app-ad conversions 9.6%, generative retrieval on Facebook Feed lifted conversions nearly 2% in targeted segments, and Andromeda improvements added 1.4% on Facebook. Small percentages on $63B a quarter are large dollars, and none of them needs a query. These are separate company-reported measurements, not percentages to add together.
Muse is the new layer, and it is the piece of the thesis Gilder could not have drawn. It is a personal agent that runs in its own secure virtual machine, connects to email, calendar and payment rails, and carries a task to completion after the user closes the app. It runs on Meta's Muse model family: Muse Spark, released 8 April 2026, and Muse Wonder, which Meta calls its first frontier model. The Q3 call put numbers on the first six weeks:
The most common use case for Muse is shopping, with more than a quarter of people who are using Muse engaging in this with an average purchase size of over $200.
Management reported over 10M Muse setups in the US and Canada in about six weeks and said about 25% used it on a given day. That is early adoption evidence, not a retention cohort or proven revenue model. The business opportunity is to earn fees when an agent facilitates commerce. Access is a constraint: the research describes Amazon checkout restrictions and commerce through other merchants, including Walmart and Shopify sellers.

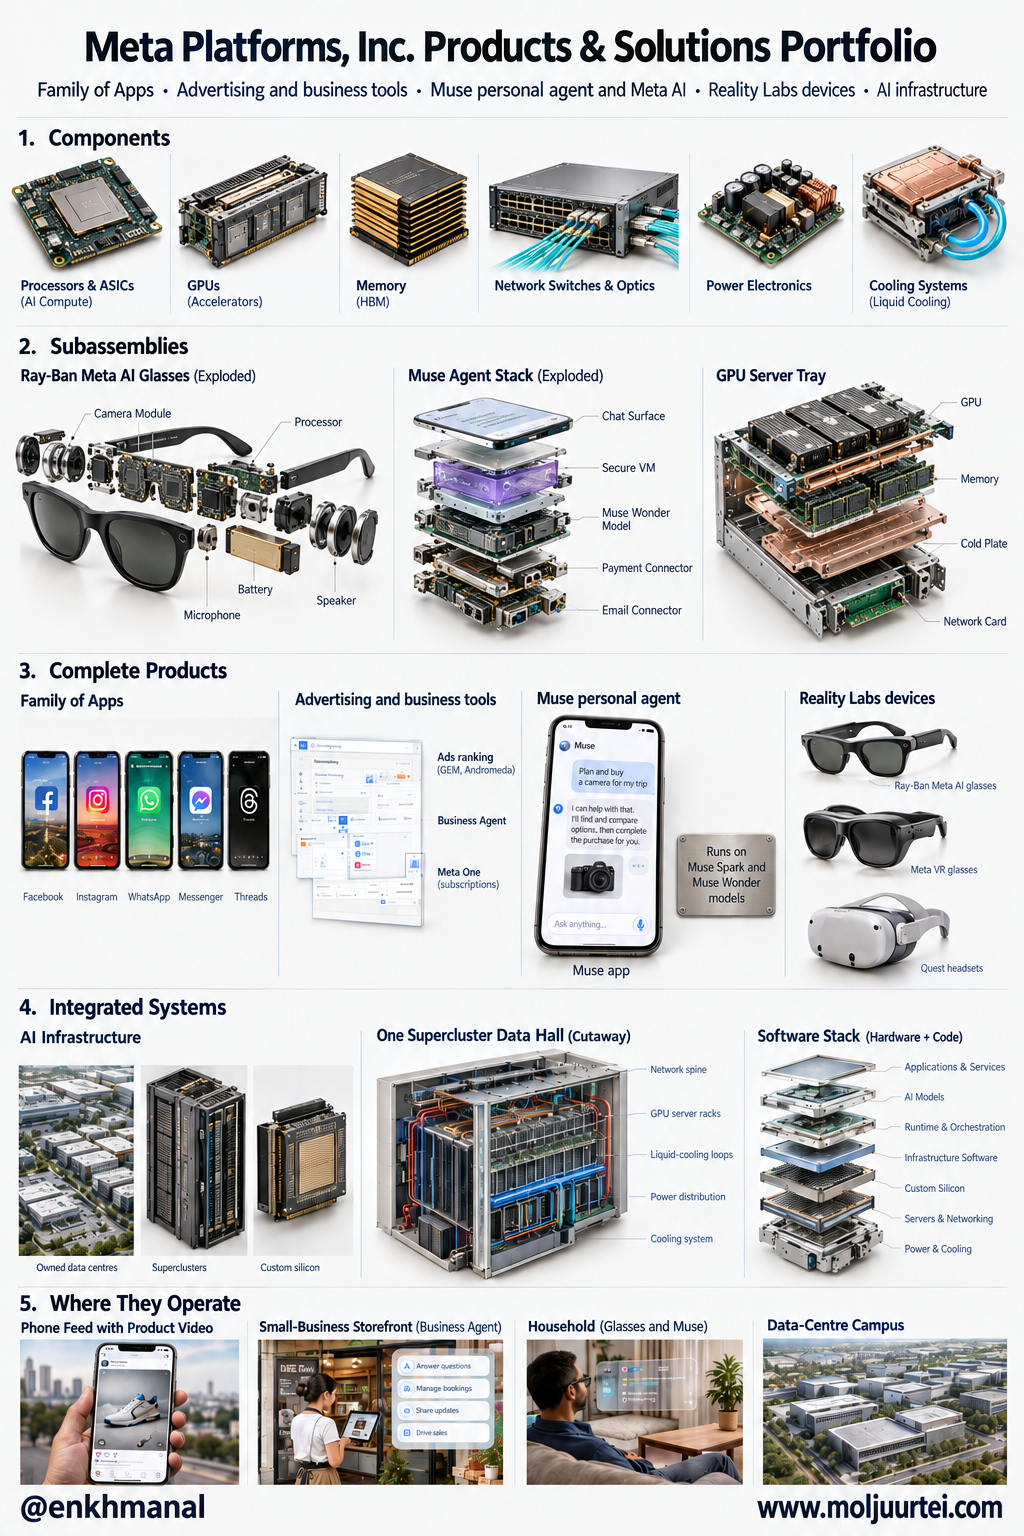
Meta says moving content-understanding work to its own Muse models cut per-unit processing costs by over 80% in offline evaluations. Custom silicon may further lower inference cost, the cost of running a trained model. These are promising unit-cost mechanisms, but owning models and hardware does not eliminate electricity, depreciation, staffing or third-party cloud expense. Offline savings are not the same as a company-wide realized margin gain.
Roadmap & R&D
The roadmap is about scaling one product and cutting the cost of serving it. Muse comes to Meta glasses starting in November 2026; a confidential version of that virtual machine, under which even Meta cannot see a user's content, is next; and Muse Charm, a pocket device, went from concept to hardware in under a year. Muse is still limited to the US and Canada because, in Zuckerberg's words, it is a compute-intensive service to run, and the company targets a more than tenfold gain in compute cost efficiency over the next year from off-peak capacity, smaller distilled models and inference optimisation.
Meta describes a layered monetization plan: free access for most users, prospective merchant-paid transaction fees, subscriptions for heavier usage and business features, plus Muse Wonder APIs and Muse Code through the Meta Enterprise Platform led by Chandrakant Desai. The Q3 call did not disclose separate Muse revenue. Meta One passed 15M subscriptions and trials, while partnership ads passed a $15B annualized revenue run rate, up 97%. Trials are not all paying subscribers, and an annualized run rate is not full-year recognized revenue.
Behind all of it sits the build: four superclusters of more than a gigawatt each, owned data centres in 23 US states, and infrastructure capacity on track to nearly double in 2026. Reality Labs is being pared back to fund it, with losses guided down from $18B to $19B this year to about $15B in 2027 as investment moves to AI.
The Setup — Why It's Mispriced
The valuation debate is whether infrastructure intensity can eventually fall without undermining revenue. Meta builds mainly for its own products, while cloud providers also build against customer contracts. That distinction gives different economics, not unlimited discretion. Meta has major contractual commitments and an expanding enterprise API business of its own. Its CFO described spending flexibility in April:
if we end up not needing as much as we anticipate, we can choose to bring it online more slowly or reduce our spending in future years as we grow into the capacity that we're building now.
Nine-month operating cash flow was $96.9B, up about 22%. Against $85.8B of capex including finance-lease principal, reported free cash flow was $11.0B; rounding the printed inputs gives $11.1B. Q3 alone had $9.86B net income, $32.79B operating cash flow and −$2.12B free cash flow after $34.91B of capex. The legal charge affected earnings, while cash-payment timing and noncash items explain why earnings and operating cash differ. This is a spending-intensive business even though operations generate substantial cash.
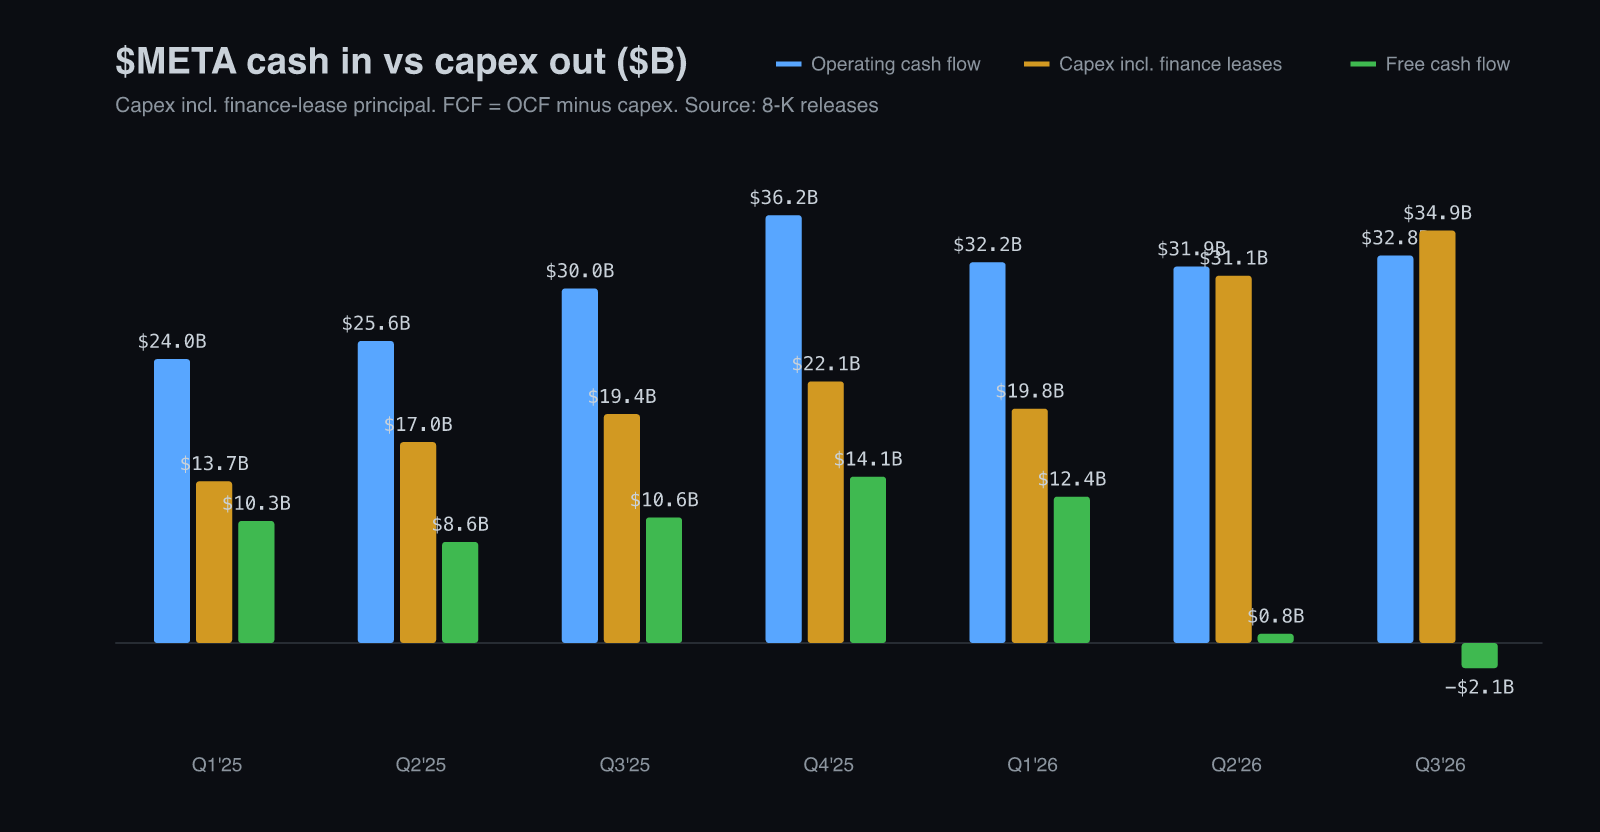
Meta has run this experiment before. In 2022 it spent $31.4B on property and equipment while revenue fell; in 2023, the 'year of efficiency', it cut that to $27.3B. Free cash flow went from $19.0B to $43.8B and operating margin from 24.8% to 34.7%. The point is not that a cut is coming next quarter. It is that capex is one important line management can influence, subject to commitments, and all else equal, $10B less cash spending is about $3.90 a share of free cash flow on 2.57B diluted shares.
An illustrative sensitivity assumes $140B of full-year 2026 operating cash flow—not a simple annualization of the nine-month figure—and about 18% yearly growth thereafter: roughly $165B in 2027 and $195B in 2028. If capex is $185B in both years, free cash flow is approximately −$20B then +$10B. If 2028 capex falls 10% to $166.5B, free cash flow is about $28.5B. This is an analyst assumption, not Meta guidance. Continued operating-cash growth, serving costs and delivery commitments determine whether it is achievable.
Now the remark that started our work on this name. At its investor day on 28 October, Oracle became the first large AI builder to put a date on its own peak:
This acceleration in capacity delivery to support contracted RPO leads us to a period of peak CapEx in fiscal 2027 and 2028, with our CapEx stepping down in fiscal 2029.
Oracle’s FY28 ends in May 2028. It targets positive free cash flow in the second half of FY28 and at least $30B in FY29, with additional capital raises capped at $20B through FY30 excluding debt refinancing. Those are Oracle’s targets, not evidence that every AI builder is peaking. Alphabet and Microsoft continued to signal heavy investment. Amazon’s October 29 results are now included in the dated update rather than treated as a future event.
Table terms: capex; TTM.
The investment cycle has not ended. A buyer of compute may benefit if revenue keeps growing while incremental capital needs slow; a supplier may keep growing through contracted demand, service revenue or utilization gains. Meta’s trained models still require serving, updates and replacement hardware. The research’s November 2025–October 28, 2026 return comparison was META −5.5%, MSFT +7.9%, AMZN +9.2% and GOOGL +1.5% before its after-hours move. That dated comparison does not by itself establish mispricing.
Management & Track Record
This is a founder-run company where the founder holds about 60.6% of the vote with about 13.4% of the economics, according to Meta's 21 October information statement. That is the single most important governance fact, because the capex decision is his.
Table terms: capex; COO; CTO; AI.
The record cuts both ways, and both halves matter here. Zuckerberg has shown he will cut hard when the market forces the issue, which is the behaviour the thesis needs in 2028. He has also shown, with Reality Labs, that he will fund a long bet for years before it pays. The difference this time is that Muse already has users and a transaction attached.
Risks & What Breaks It
The assumption that almost broke the thesis is that Meta's capex peaks soon. Meta's own filings argue against an early peak. The 21 October information statement says management's three long-term forecast cases each showed 'the Company's need to raise hundreds of billions of dollars over a period of several years beginning as early as fall 2026', and the 10-Q lists $454.52B of non-cancelable contractual commitments, $121.41B of them due in 2027. A dial you have contracted to keep turning is not fully a dial. If the next company outlook puts 2027 capex well above the 2026 range with no path to positive free cash flow, we have the timing wrong even if the destination is right.
Evidence that would weaken the case includes another 30% or greater capex increase with a negative full-year cash-flow outlook, or ad growth below roughly 15% while spending keeps rising. These are analytical sensitivities.
Price Setup — Levels, Technicals & Options
The price has given back the whole Muse rally. $META closed at $612.49 on 28 October, almost exactly where it was on the 8 September launch day ($613.48) and 21% below the 24 September closing high of $777.59. It sits under its 20-day ($701.83), 50-day ($667.03) and 200-day ($632.14) moving averages, inside a 52-week range of $520.26 to $779.82. The trend is down; the $625 forward-offering price is a financing reference, not guaranteed price support.
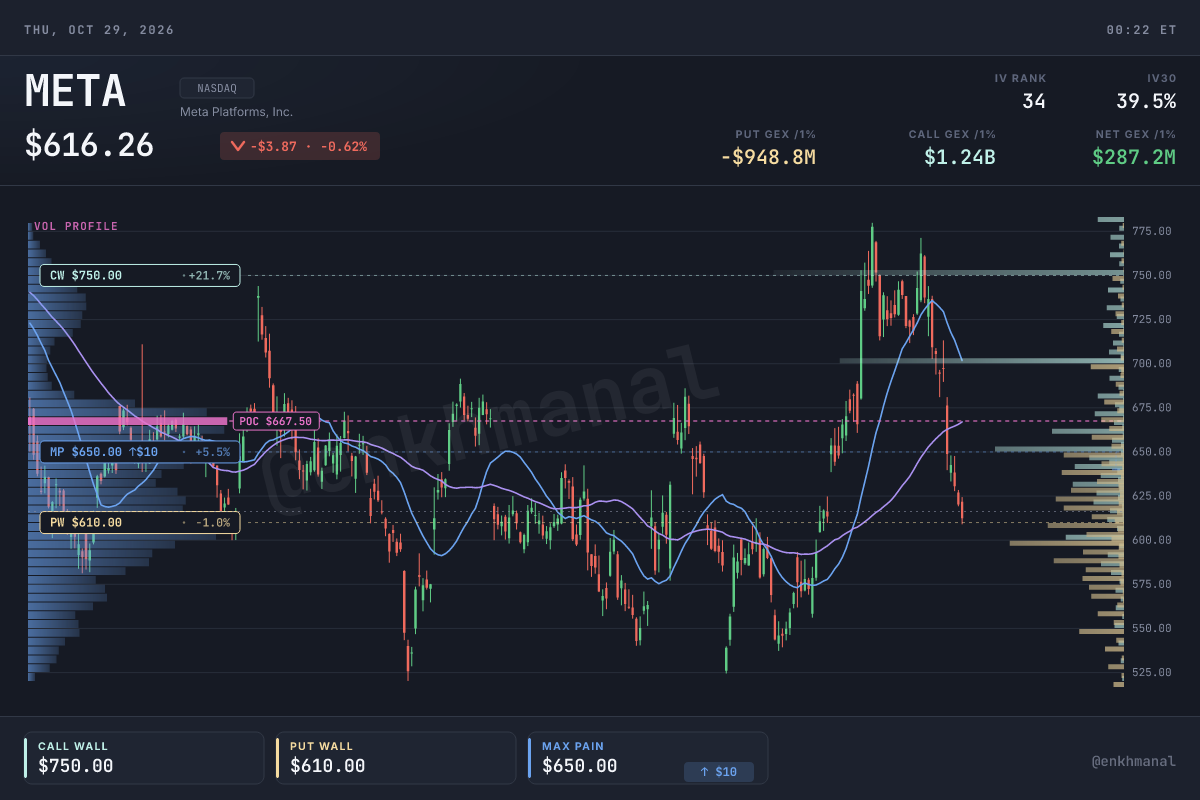
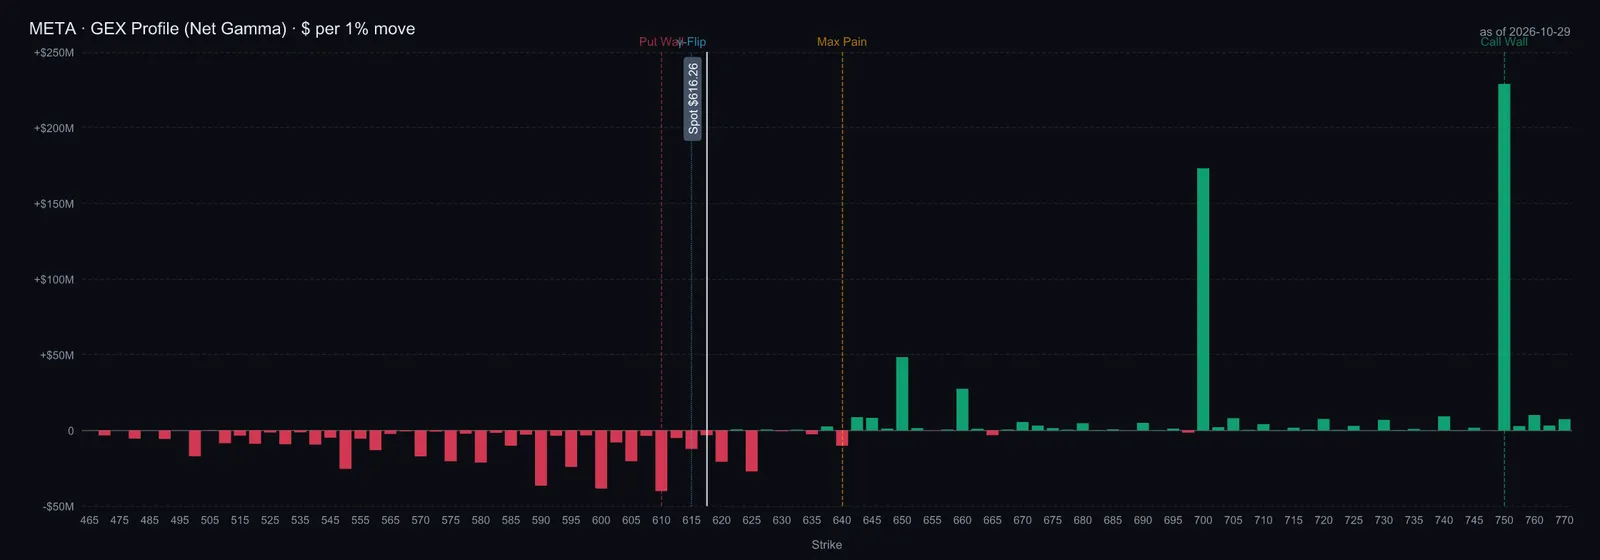
The October 28 model placed put wall and gamma flip at $610, max pain at $640, call wall at $750, and net gamma at +$0.36B per 1% move with a 0.49 put/call open-interest ratio. These estimate option-position concentrations and hedging sensitivity. They are not a floor or a forecast; actual dealer positions and price behavior may differ.
The original calendar used January 27, 2027 as an estimated Q4 reporting date; it was not verified as a company-confirmed date in this publication review. Standard monthly option dates were January 15 and February 19. The October 28 implied-volatility snapshot was about 45% near-term, 39.5% for November 20, 37.5% for January 15 and 40.3% for February 19. A higher later volatility can reflect event risk and other factors; the original roughly ±8% earnings estimate was a model-dependent inference, not a directly observed forecast. Meta announced January 19 effectiveness for its Class C charter and an expected one-for-one Class C stock dividend, with record and payment dates to follow. Price, share count and option contracts must be adjusted consistently when corporate-action terms become final.
The calendar has advanced: Amazon reported October 29, and its outcome is in the update. Meta described November glasses integration for Muse. November monthly options expire November 20; the old $610 concentrations are a dated snapshot. Late-January results remain the expected next budget discussion, with the exact reporting date awaiting company confirmation.
Valuation & House View
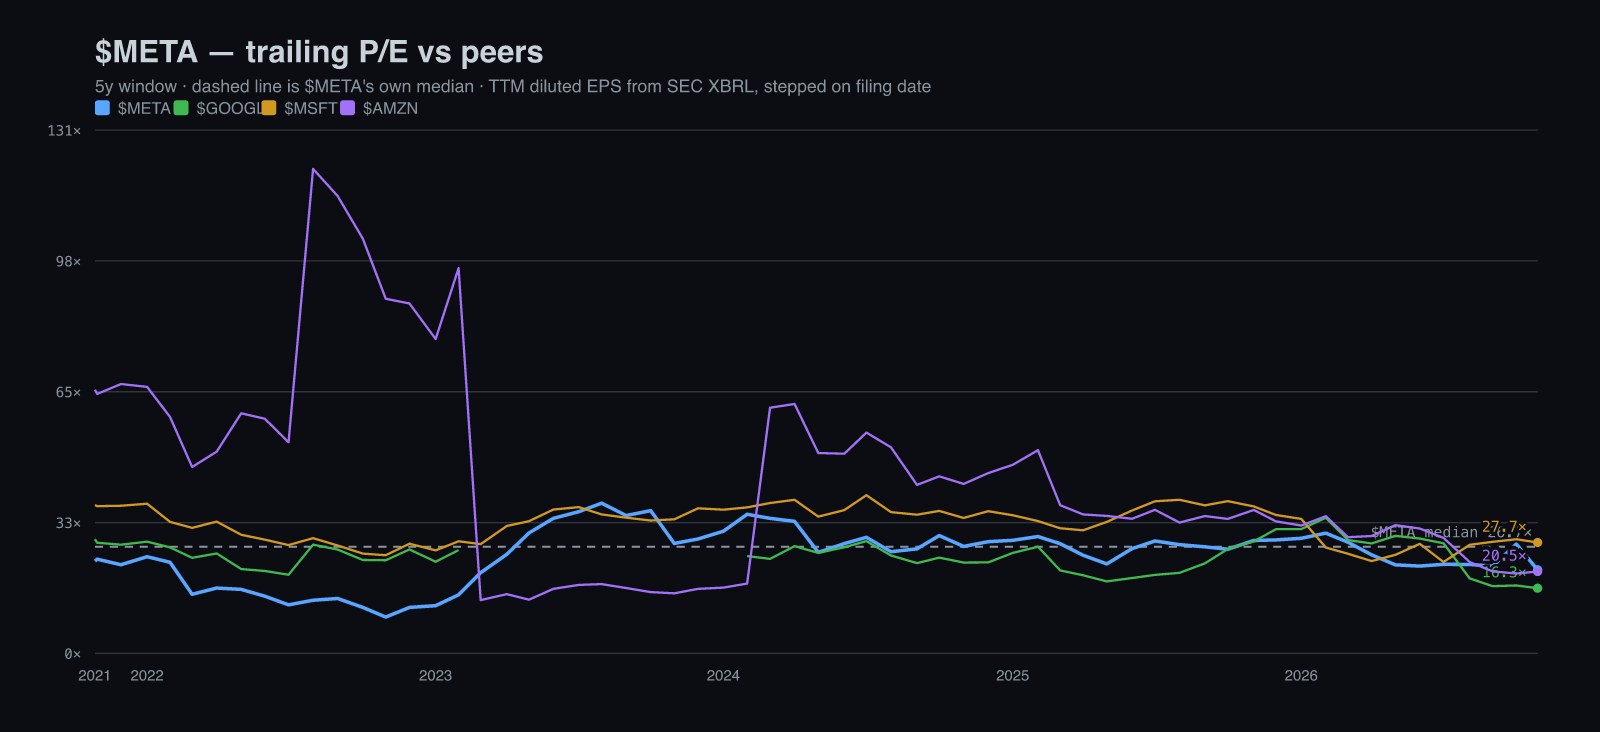
On earnings the stock is cheap against its own history and fair against its peers. Trailing P/E is 20.9× on $29.32 of TTM diluted EPS, against a five-year median of 26.7×, the 22nd percentile of its own range. $GOOGL trades at 16.3× before its after-hours drop, $MSFT at 27.7× and $AMZN at 20.5×. The trailing PEG is 1.31, and it is trailing, current P/E over realized EPS growth, not a forecast.
The dated cash-flow sensitivity gives a wide range: $532 per share under perpetuity and $1,487 using a 20.7× exit EBITDA multiple. Assumptions were a ten-year horizon, 22% revenue growth in 2027 fading to 4%, capex eventually at 20% of revenue, a 10% discount rate and 2% terminal growth. The 20% capex assumption already requires a major decline in intensity from the guided 2026 level; the perpetuity result does not keep today’s spending intensity forever. The two methods differ by about 2.8×, and the exit multiple is about 1.7× the dated guided-year 12.4×. That makes terminal assumptions decisive. A reverse sensitivity estimated 17.1% annual growth for ten years at the assumed capital intensity, versus an 18.5% historical five-year revenue CAGR. These are model sensitivities, not established fair values.
Scenario terms: EPS; P/E; ATM; capex. Prices are pre-distribution equivalents.
Meta offers a credible growth case through better ad recommendations and potential agent commerce. Its distribution is an advantage, but Muse monetization, competitive access and capital intensity remain open tests. The illustrative end-2028 base price is $880 under the stated EPS and multiple assumptions. The next budget update matters to both timing and economic value: slower spending growth helps only if operating cash generation and product demand hold up.