
US natural gas — Export capacity, winter risk and the fund trap
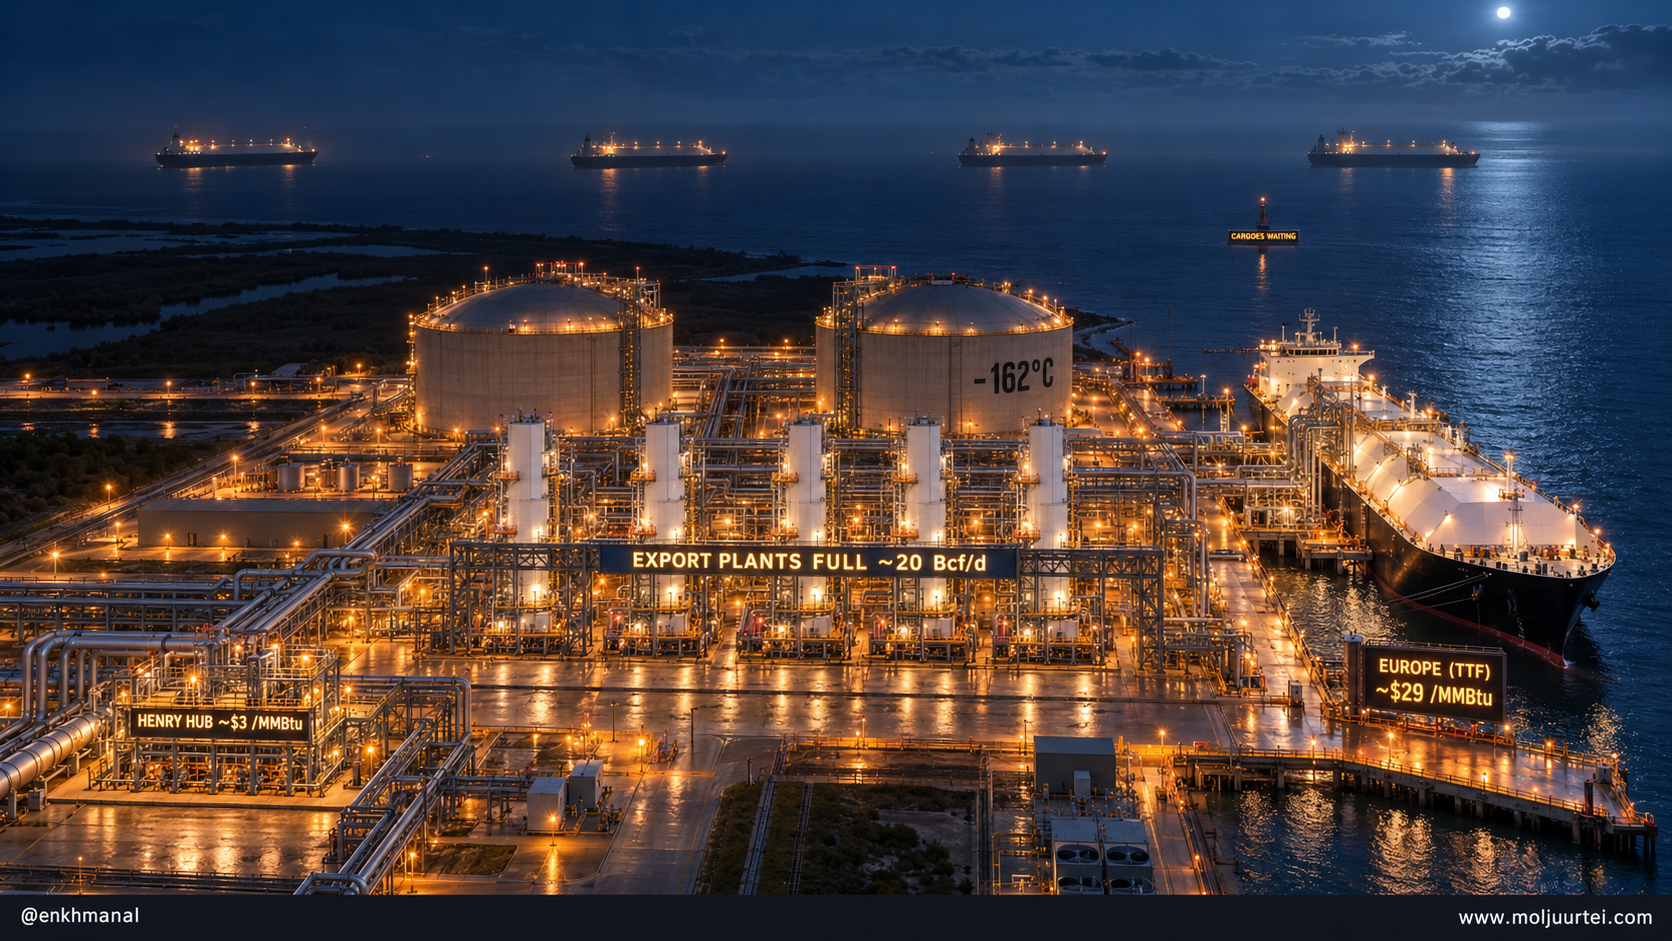
At the October 26 snapshot, Henry Hub gas was about $3/MMBtu and Europe’s TTF market roughly $29/MMBtu amid disruption to Qatari LNG shipments through Hormuz. Export capacity connects these markets, but contracts decide who earns the spread: liquefaction owners receive contracted fees, while uncontracted cargo sellers and some offtakers retain market exposure. A Henry Hub futures fund does not directly own that international margin. This study prioritizes $LNG, $EQT and $KMI for their different operating advantages, while treating $UNG as a difficult vehicle for a multi-month seasonal thesis. Warm-weather risk, valuation and this week’s earnings leave the investment case conditional.
Thesis
American gas now has two prices, a domestic one held near $3 by record output and expectations of a mild winter, and a world one near $30 set by a Middle East supply shock; limited export capacity and contract structure determine how the gap translates into earnings.
Backdrop — How the Theme Got Here
Start here.
Everything below is about who earns money when those pieces are stretched.
The demand side is bigger and more varied than the heating story suggests. The Energy Information Administration's October Short-Term Energy Outlook puts 2026 US demand, exports included, at about 120 Bcf/d, split like this:
Table terms: Bcf/d; LNG.
Power plants are the largest single buyer and EIA forecasts gas to supply about 40% of US electricity in 2026, so a hot summer or a data-center campus moves the balance as surely as a cold snap. The growth, though, is almost all at the border. From 2025 to 2027 the agency expects total demand to rise by about 6.5 Bcf/d, and LNG exports supply 3.5 of that, pipeline exports 1.1 and every domestic use combined only 1.9. Wood Mackenzie measured pipeline flows to Mexico at a record of almost 7.9 Bcf/d in August.
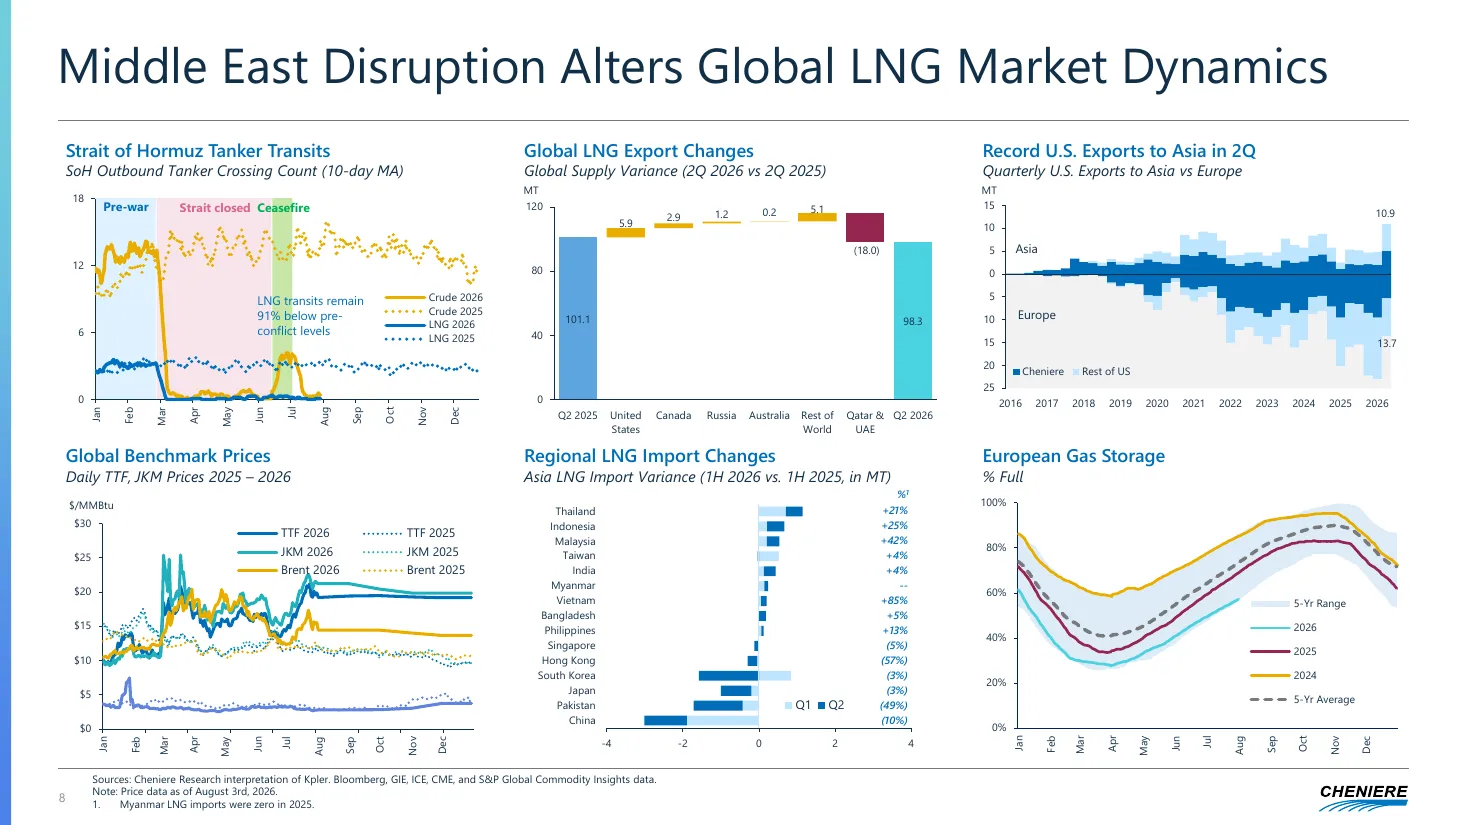
The arc is short. Shale drilling after 2008 turned a scarce fuel into a surplus, and Henry Hub spent most of the 2010s between $2 and $4. Cheniere loaded the first export cargo from the Lower 48 at Sabine Pass in 2016, and its chief executive now credits US LNG with a $1 trillion contribution to the economy. Russia's 2022 invasion of Ukraine made American LNG Europe's replacement supply. Then in March 2026 the Strait of Hormuz closed to most tanker traffic. Crude flows recovered after a summer ceasefire, but Cheniere counted LNG transits still 91% below pre-war levels in early August, Qatar remains under force majeure, and European prices cleared €90/MWh on 20 October for the first time since December 2022.
Winter is when this matters, because storage is finite and weather is not. On 23 January 2026, during a cross-country freeze, Henry Hub spot printed $30.72, ten times its autumn level, and December-to-February spot averaged $5.17. A cold week does not need to last long to empty a cavern that took a summer to fill.
The price itself is set in two places at once. The physical, or cash, market trades gas for delivery tomorrow at hundreds of points across the grid, and the futures market trades it for delivery in named months at one point, Henry Hub. Every other location trades at a "basis", a premium or discount to Henry Hub that reflects how much pipe connects it to buyers. Appalachian gas usually sells at a discount because its pipes run full, and West Texas gas has at times sold below zero when Permian pipes were full and producers had to pay someone to take the gas their oil wells brought up. That is why a producer's realised price can differ sharply from the headline, and why $EQT's management keeps talking about tightening local basis rather than about Henry Hub.
Mechanism — Why Now & How It Works
The US gas market balances through price: supply is nearly fixed in the short run, demand swings with the weather, and storage carries the difference until the price changes somebody's behaviour. Each piece is moving at once this autumn.
Supply is at a record and still rising. The agency reported July 2026 dry production at 113.7 Bcf/d, the highest month on record and 5.3% above a year earlier, and its outlook has dry output growing from 107.6 Bcf/d in 2025 to 112.2 in 2026 and 116.1 in 2027. Most of the growth is a by-product: Permian marketed gas rises from 27.6 to 32.0 Bcf/d because oil companies drill for crude and the gas comes along regardless of its price. New pipes let that gas reach the Gulf Coast, Matterhorn Express since late 2024 and Blackcomb, a 2.5 Bcf/d line that Wood Mackenzie's May survey judged 63% built and likely to start in phases in the fourth quarter. The Haynesville, next door to the export plants, grows from 15.0 to 17.8 Bcf/d. Appalachia, the cheapest basin, barely grows (36.7 to 37.6) because it is short of pipe. Drillers had 132 gas rigs running on 23 October against 122 in mid-January.
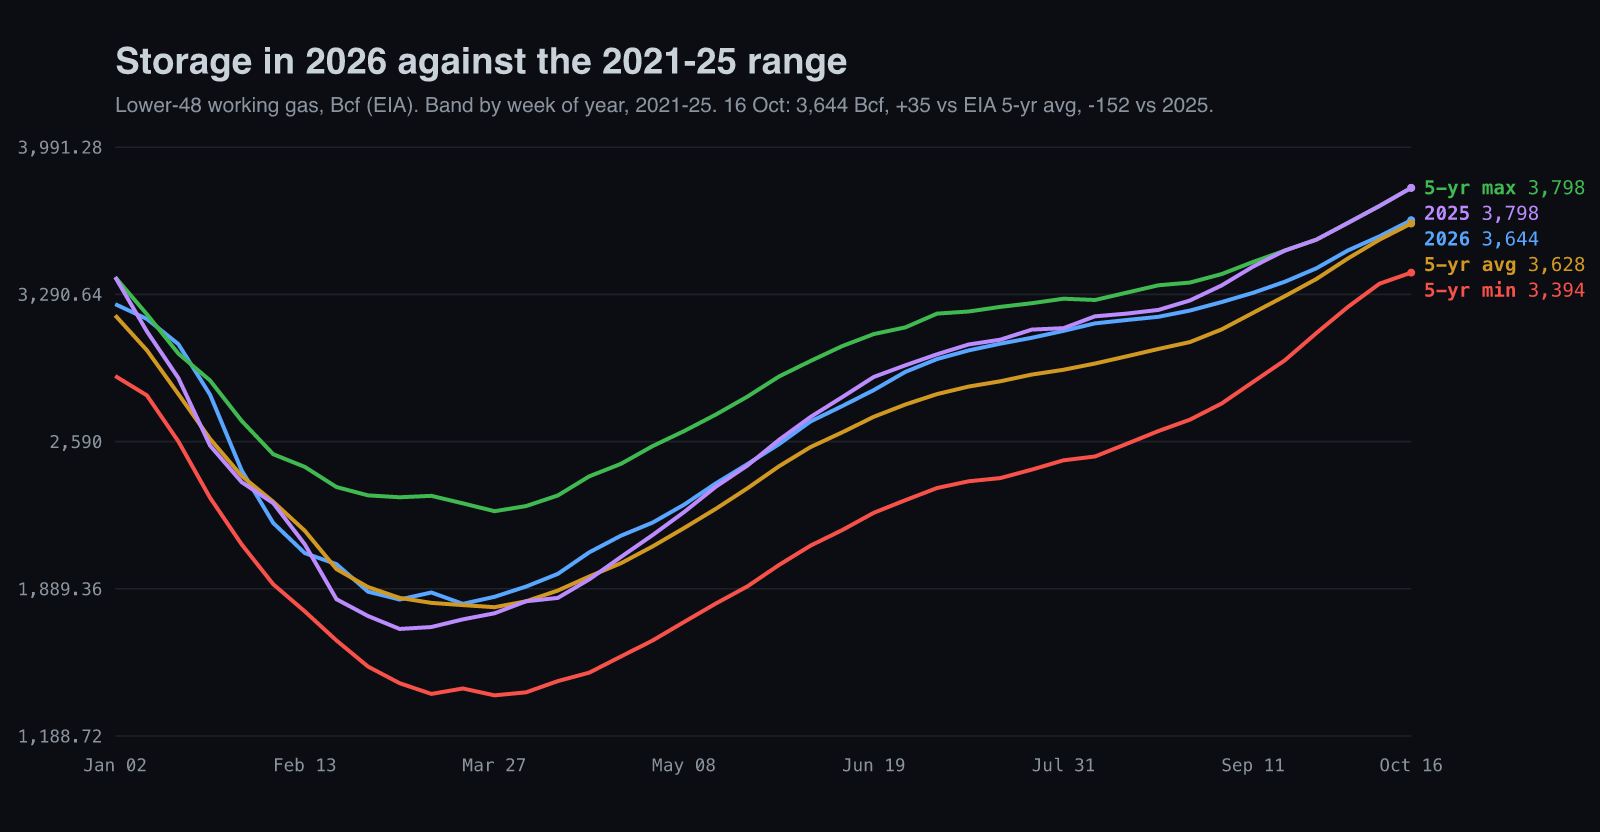
Storage is normal, and the cushion is thinning. Working gas stood at 3,644 Bcf on 16 October, 35 Bcf (1.0%) above the five-year average and 152 Bcf below last year. Ten straight injections below the seasonal norm shrank the surplus from 198 Bcf, and salt caverns in the South Central region, the fast-cycling storage that matters on a cold morning, were 14.9% below normal.
The weather is the swing, and this year it leans warm. Heating demand is measured in heating degree days, the number of degrees each day's average temperature falls below 65°F. El Niño, a warming of the eastern Pacific, shifts the winter jet stream so the northern US tends to run mild. The Climate Prediction Center's 8 October update gives better than 83% odds of a strong-to-very-strong El Niño through January–March 2027, and the Oceanic Niño Index for July–September was already +2.16°C. We checked what that has meant for price: in four strong El Niño winters since 1997, December-to-February Henry Hub averaged below October in three (1997 −26%, 2015 −12%, 2023 −16%). The exception, 2009, was a cold eastern winter that rose 37%, so this is a lean, not a law. A "strong" event means the three-month average sea-surface temperature in the central Pacific runs at least 1.5°C above normal; this one is already above 2°C, territory last seen in 2015 and 1997.
The export door is full. October feedgas averaged about 18.2 Bcf/d, and Celsius Energy flagged a day on track for 20.0 Bcf/d on 17 October, 3.3 Bcf/d above a year earlier. Golden Pass shipped its first cargo on 22 April and its intake is rising as it commissions more capacity; Corpus Christi Stage 3's seventh train was starting up in August; Rio Grande's first train is due in the first half of 2027. Near-term capacity limits how much additional gas can be exported, although ramps and operating rates still change flows. Higher overseas prices raise cargo values; the retained benefit depends on liquefaction fees, offtake terms, shipping and fuel costs, hedges and uncontracted volumes. The outlook has LNG exports at 19.0 Bcf/d in December 2026 and 21.1 Bcf/d in December 2027, which is why the curve gets dearer further out.
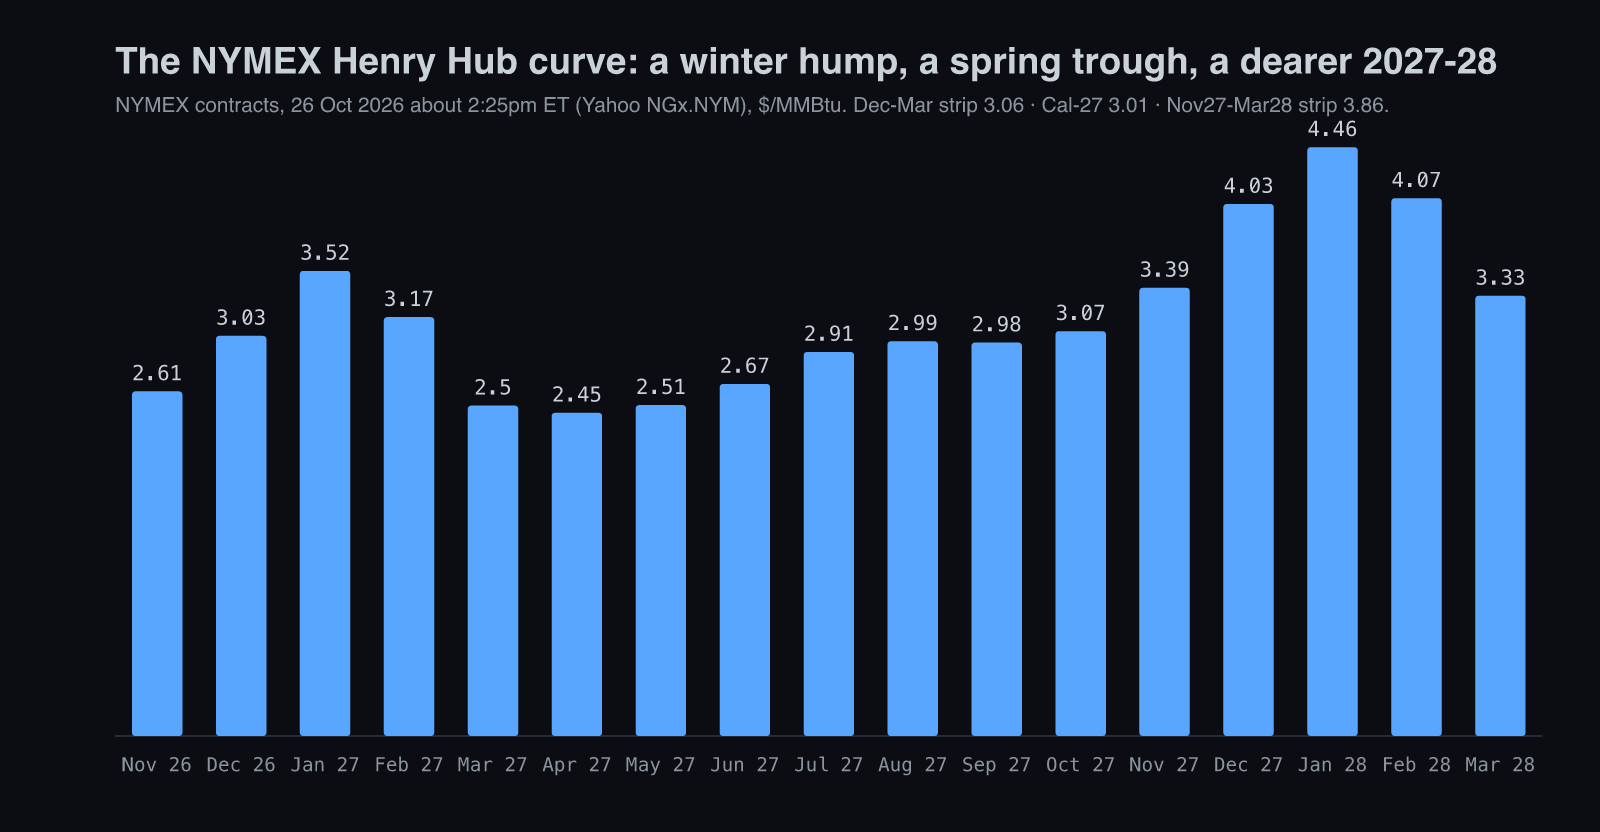
The futures curve prices exactly that story. November settles near $2.61, December $3.03, January $3.52, then the strip falls to $2.45 by April before climbing to $4.03 for December 2027 and $4.46 for January 2028. The December-to-March winter strip averages $3.06, calendar 2027 $3.01, and the winter of 2027-28 $3.86. The agency's own forecast is higher this winter, $4.01 for January, but it assumes heating demand close to last year's. Speculators have taken the other side: money managers were net short 157,409 Henry Hub contracts on 20 October in the regulator's weekly report, their largest bet against gas since February 2024.
Data centers are real demand with real friction. Kinder Morgan says large-load interconnection requests in the Southeast exceed 200 GW, roughly 8 Bcf/d if all of it were built and gas-fired, and it has sanctioned a 2.6 Bcf/d pipe to serve it. Criterion Research reported that Oracle was weighing trucked compressed gas for a 2.5 GW New Mexico campus after a land office denied part of a pipeline route. Demand that needs a new pipe to arrive is demand on a two-to-four-year delay.
Exports — The Next Doors Open in 2027
Mexico is the quiet second export market. Mexico burns American gas in new combined-cycle power plants and has little storage of its own, so its imports run highest in the summer cooling season. Wood Mackenzie counted record pipeline flows of almost 7.9 Bcf/d in August, with Mexican power burn above 5.8 Bcf/d, and expects the seasonal decline to follow. The agency puts all US pipeline exports at 10.0 Bcf/d in 2026 and 10.5 in 2027. Kinder Morgan says it carries more than half of the gas that crosses that border, which is part of why its pipes stay full.
The next doors open in 2027, not this winter. The export build-out arrives in steps. Golden Pass, owned by QatarEnergy and ExxonMobil, began production in March 2026 and aims for its second train in the second half of 2026 and its third in the first half of 2027. Cheniere's midscale trains 8 and 9 at Corpus Christi were 48% complete in August, and it has signed a $4.7 billion construction contract with Bechtel for the first phase of its Sabine Pass expansion ahead of a final decision. Venture Global took its final decision on CP2 in July 2025 and plans a 10 million tonne a year expansion decision in early 2027. NextDecade's Rio Grande expects first LNG from Train 1 in the first half of 2027, and Sempra's Port Arthur is under construction. Each train that starts is new demand for American gas and, for its owner, new capacity to sell into the spread; together they are why the curve prices the winter of 2027-28 almost $0.80 above this one.
What the queue means for price is already in the curve. The agency expects LNG exports to climb from 17.6 Bcf/d this year to 21.1 Bcf/d by December 2027 and puts Henry Hub at $3.90 that month, close to the $4.03 futures price; both readings say the tightening arrives a year from now, not this winter. For an investor the distinction matters because the instruments get paid at different times. A producer earns the 2027-28 price only when it arrives and only on unhedged volume, a front-month fund earns it only if it holds through every roll in between, and an exporter's new trains earn their fees from the day they start. That is the timing argument for owning the bridge before owning the molecule.
The Wrapper Problem — $UNG, $UNL, $BOIL and $KOLD
A front-month gas fund follows a changing futures contract, not a fixed quantity of physical gas. In contango, later contracts are pricier. If they converge toward an unchanged lower spot price as expiry approaches, that can erode returns over time. The roll trade itself is not an automatic NAV loss.
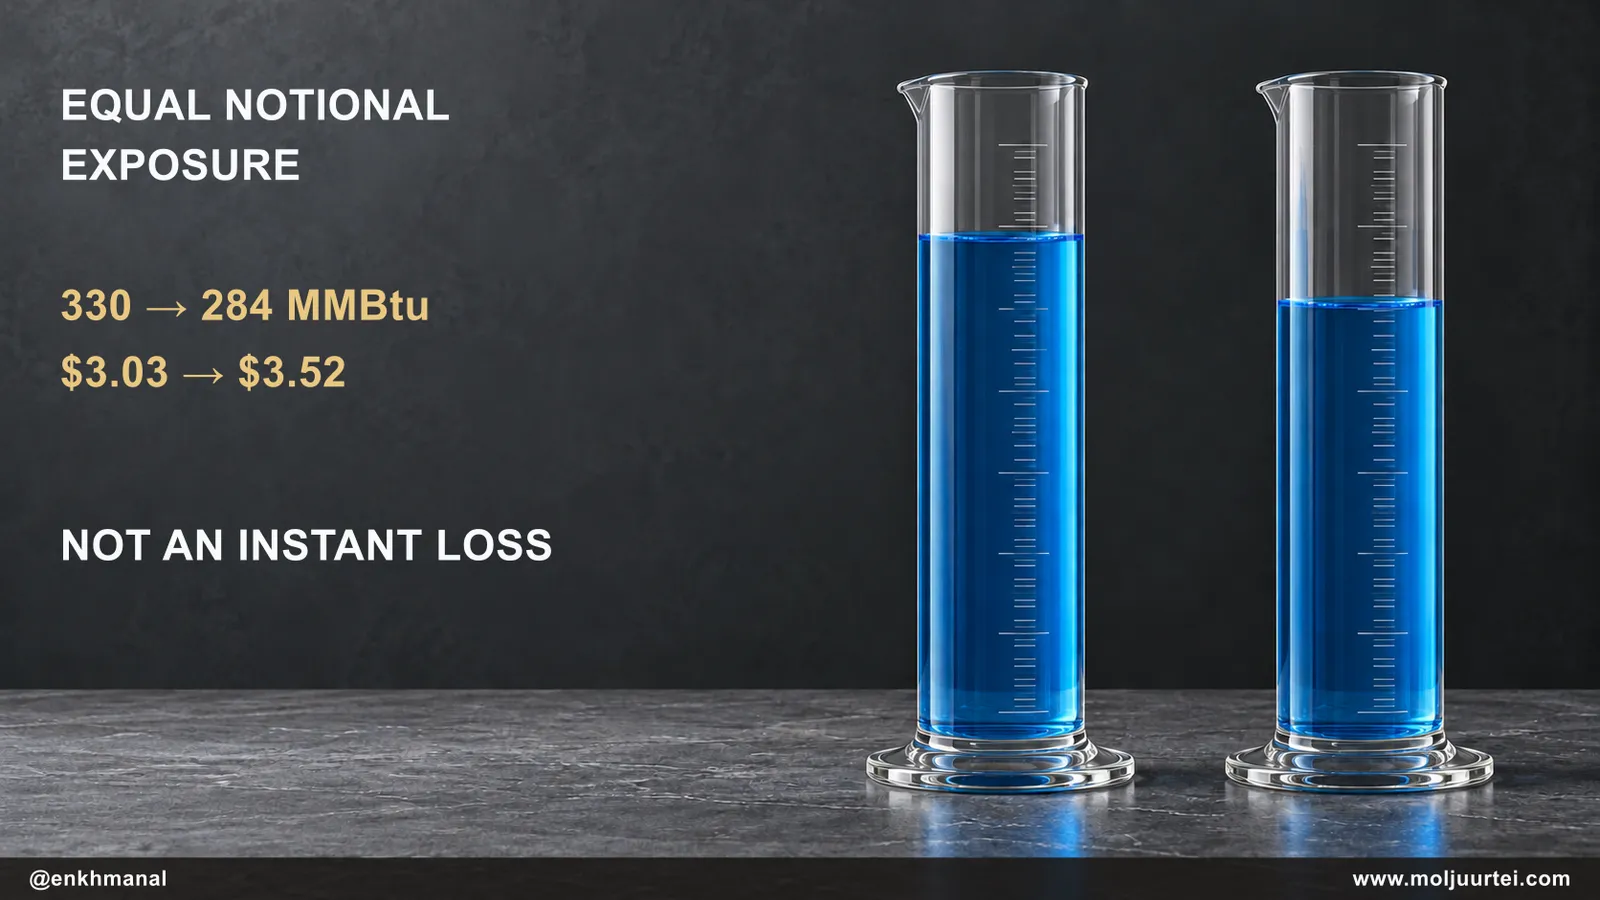
$UNG changes its benchmark over four trading days when the near contract is within about two weeks of expiry. Using the October 26 curve, December is $3.03 and January $3.52: January is 16.2% dearer. At equal $1,000 futures notional, that corresponds to about 330 versus 284 MMBtu of illustrative exposure, 13.9% fewer units. Futures use margin and daily settlement; these are not cash purchases of physical gas. Selling one fairly marked contract and establishing another at market does not instantly lose 13.9% of NAV, nor create an automatic break-even price hurdle. Subsequent contract returns, convergence, collateral interest and expenses determine results. February ($3.17) and March ($2.50) are cheaper than the preceding months, so the curve’s carry also changes through winter.
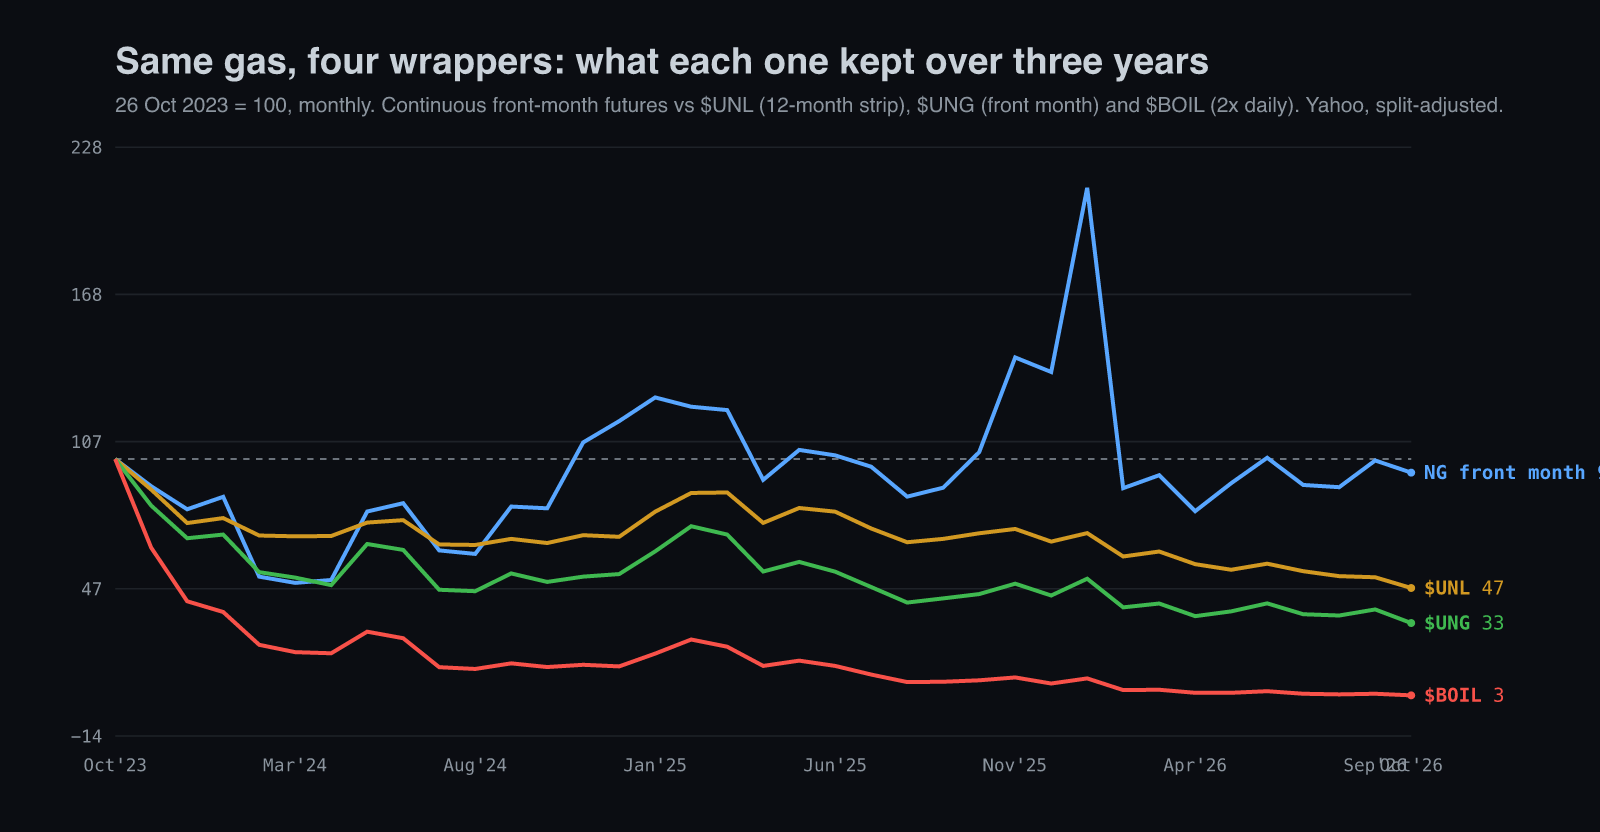
Measured against a holder's wallet, the results are stark. From 26 October 2023 to 26 October 2026 Henry Hub spot rose 8.0% and the continuous front-month chart fell 5.3%, while $UNL lost 53.1%, $UNG 67.3% and $BOIL 97.3%. Over ten years spot gas is up 15.2% and $UNG is down 92.7%. Even the last twelve months cost $UNG 25.8% against 11.6% for the front month.
The November pattern is real in the gas price and absent in the fund. We tested the window from 26 October to 30 November in every year since $UNG listed:
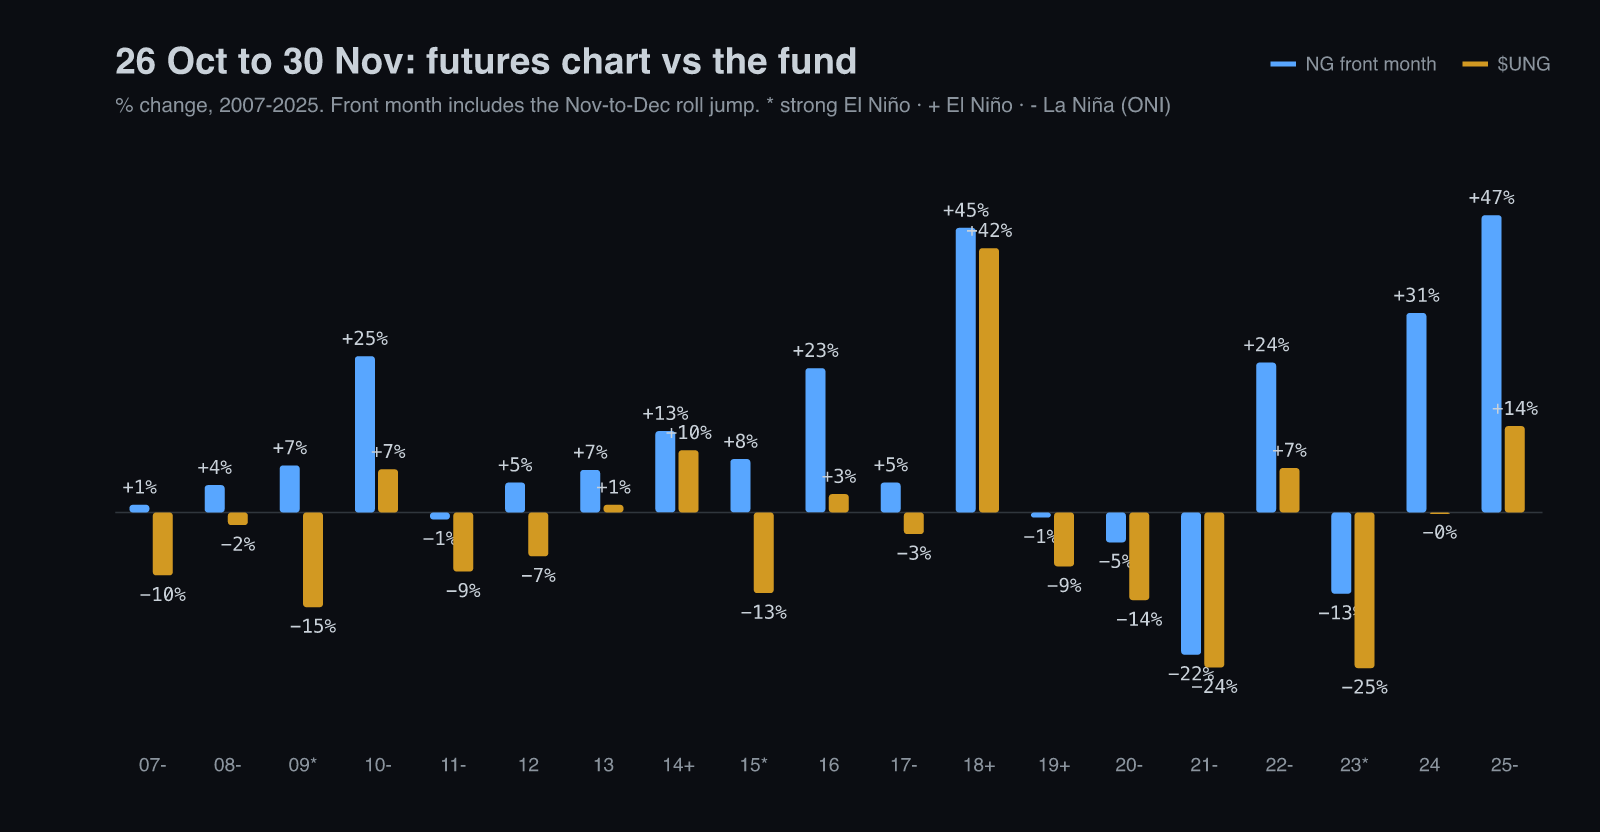
Table terms: Henry Hub.
An unadjusted continuous futures chart can splice contracts at different prices, creating a discontinuity that is not itself an investable return; adjusted series can behave differently. The fund that people actually buy rose in 7 of 19 years with a median loss of 3.4%, and from 26 October to 31 December it rose in only 4 of 19 with a median loss of 13.2%. All three strong-El-Niño autumns in this small fund sample were negative; three observations cannot establish a reliable trading rule.
A support line on a futures fund compares different contracts through time. A line through $UNG's 15 January low ($9.95) and 6 August low ($9.55) projects to about $9.39 today, and the fund traded $9.35 intraday on 26 October, so the line is being tested as drawn. But each touch was a different contract: February gas in January, September gas in August, December gas now. Over the past year one $UNG share went from representing about 3.7 MMBtu of front-month gas to about 3.1, so a fund chart is not the same object as a chart of a fixed physical gas holding.
$UNL spreads its money across the next twelve months, and its ten-year price decline was roughly half as large (down 47.5% against 92.7% for $UNG) but did worse in the past year (−32.2%) as later-dated contracts fell further than near contracts; the return difference does not isolate roll cost. It traded about 30,000 shares on 26 October, against more than 20 million for $UNG.
$BOIL targets twice the daily benchmark return and $KOLD twice its inverse, with daily resets. Multi-day results depend on the price path: oscillating markets can hurt both, while a persistent trend can make compounding help. At 59% annualized benchmark volatility, the stylized continuous-return approximation for a +2x fund has a log-growth drag of about 0.59² = 34.8 percentage points per year relative to twice the benchmark log return. This is not a guaranteed 35% NAV loss; the inverse fund has a different coefficient and both have costs and tracking effects. Historically in the study’s one-year window, $BOIL lost 69.2%, $KOLD lost 10.6%, and the front-month chart fell 11.6%.
Basket & Positioning
The theme runs through four kinds of business, and they get paid in different ways: the molecule owner on the gas price, the pipe owner on a fee per unit of capacity, the exporter on a fixed liquefaction fee plus whatever spread it keeps, and the fund holder on held-futures returns plus collateral income less expenses.
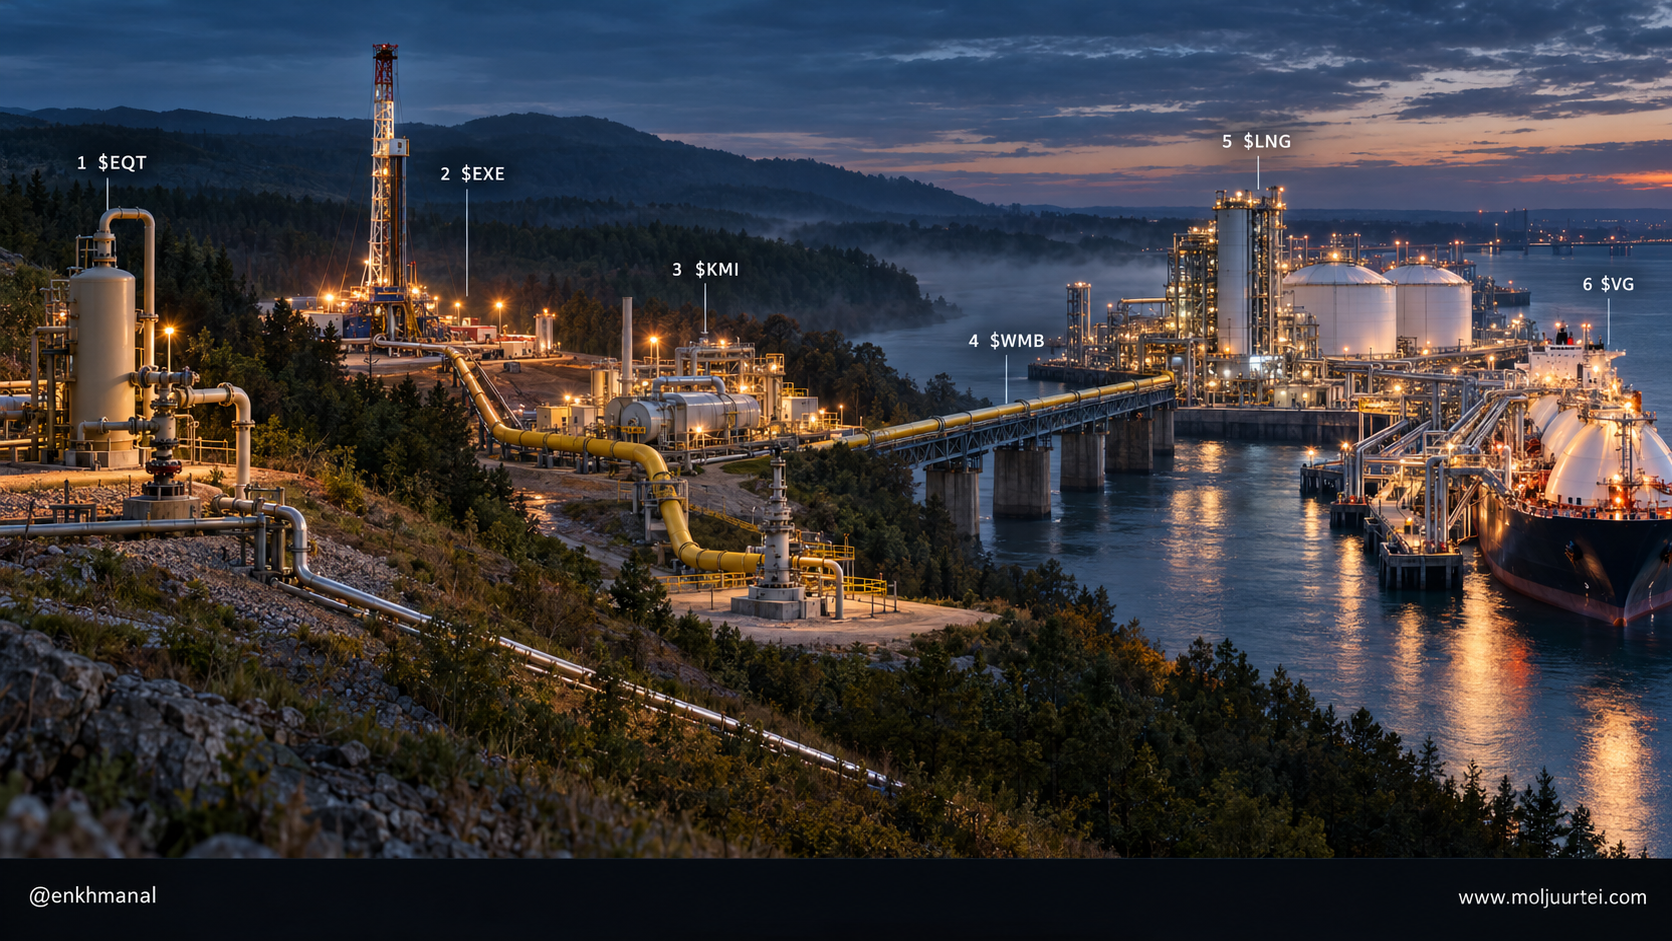
Table terms: TTM; capex; P/E.
Trailing twelve months to 30 June 2026 ($KMI to 30 September), from SEC XBRL filings; prices are the 26 October 2026 close. Trailing P/E from our valuation-history run; $VG and $CRK computed from the same filings.
Liquefaction: $LNG is the one we would study first, $VG the higher-beta challenger. Cheniere has raised its 2026 guidance twice, to $7.9–8.4 billion of adjusted EBITDA and $5.3–5.8 billion of distributable cash flow, with the new low end above the old high end. Most of its capacity is sold for 15–20 years at a fixed fee, so the Henry Hub price is a pass-through; the upside comes from the cargoes it markets itself, which earned more as Asian and European prices ran. On October 22 it signed agreements for 4 million tonnes a year to QatarEnergy through 2054, split equally between Sabine Pass and Corpus Christi. Deliveries begin in the early 2030s, and 1 million tonnes from Sabine Pass is conditional on a positive expansion investment decision; this is long-term demand evidence, not immediate extra 2026 sales. Venture Global sells more of its output on short terms; it guided 2026 EBITDA to $8.7–9.1 billion assuming a liquefaction fee of $12.50–13.50/MMBtu on unsold cargoes, about four times a long-term contract fee. That makes $VG the bigger winner if the spread holds and the bigger loser if Hormuz reopens, and it carries debt for CP2 and an arbitration loss to $BP over Calcasieu Pass. NextDecade ($NEXT) has no revenue until Rio Grande's first train starts in the first half of 2027.
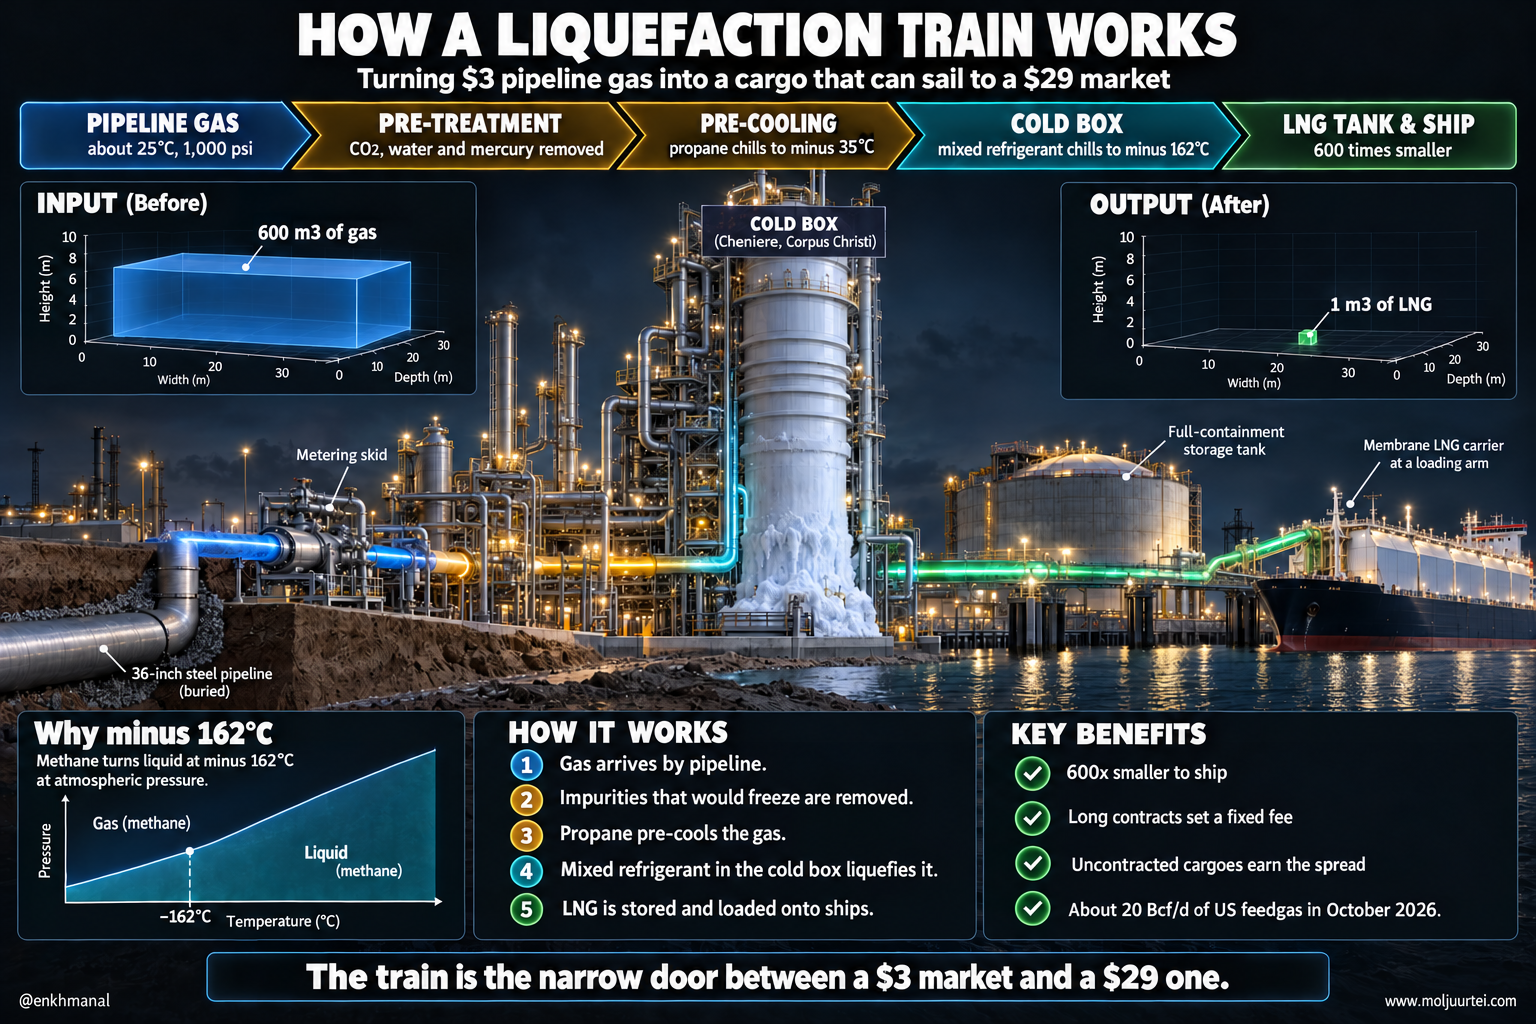
The two business models are easiest to see in the price of a cargo. A typical long-term Cheniere contract charges the buyer 115% of Henry Hub plus a fixed liquefaction fee, so Cheniere earns the fee whether gas is $2 or $6, and the buyer carries the price. On the volume it sells itself, Cheniere's run-rate guidance assumes a marketing margin of $2.50–3.00/MMBtu. Venture Global's 2026 guidance assumes $12.50–13.50 on its unsold cargoes. The difference is a choice about risk: one company sells the spread forward for decades, the other keeps more of it and lives with the swings.
Pipes: $KMI over $WMB on cash. Kinder Morgan raised its project backlog from $9.6 billion to $14.4 billion in the third quarter, at a build multiple of 5.7× EBITDA, adding a Southeast pipe for investment-grade utilities and a Permian line contracted to an A-rated hyperscaler, with debt at about 3.5× EBITDA. Williams owns Transco, the country's largest gas pipeline, and its growth is as real, but its trailing capital spending ($6.10 billion) exceeded its operating cash flow ($5.99 billion) and it trades at 28.5× trailing earnings. Energy Transfer ($ET) sits in the same node with more exposure to oil and liquids.
The names we left out of the ranking are left out for reasons, not oversight. $RRC now trades on the exchange ratio, so owning it is owning $EQT with deal risk until the first quarter of 2027. $CNX, a hedged Appalachian producer, turned $1.09 billion of operating cash flow into $0.95 billion of net income against $0.56 billion of capital spending over the last year, but its hedge book mutes exactly the price exposure a gas theme is supposed to deliver. Coterra, once the most balanced gas-and-oil producer, disappeared into Devon ($DVN) in May, whose cash flow is mostly oil. $ET runs Gulf Coast gas pipes and an LNG project of its own at Lake Charles, but most of its income comes from crude, liquids and fuel. $NEXT reported Trains 1 and 2 at Rio Grande 74% complete in June, Train 3 past 50%, and Trains 4 and 5 at 15.5% and 9.4%; it is a construction project with a listed equity, valued on cargoes it has not yet made.
The Producers — Who Owns the Cheapest Molecule
Producers have more direct gas-price exposure, but hedges, local basis, liquids revenue and transport costs prevent a one-for-one relationship with Henry Hub. Low costs and owned pipes matter in a prolonged $3-gas environment. That is why consolidation is the story of 2026: Devon closed its purchase of Coterra in May, and on 26 October $EQT agreed to buy Range Resources in an all-stock deal.
The EQT-Range terms: 0.987 $EQT shares for each Range share, a pro forma enterprise value above $50 billion, $EQT holders owning about 73%, more than 9 Bcfe/d of production, $325 million of synergies within two years and a close expected in the first quarter of 2027. Management projects about $14 billion of cumulative free cash flow over five years at $2.75 gas, and about $20 billion at the strip.
We forecast a pro forma unlevered free cash flow breakeven below $2 per MMBtu, making $EQT the lowest cost and highest quality natural gas producer in the country by a wide margin.
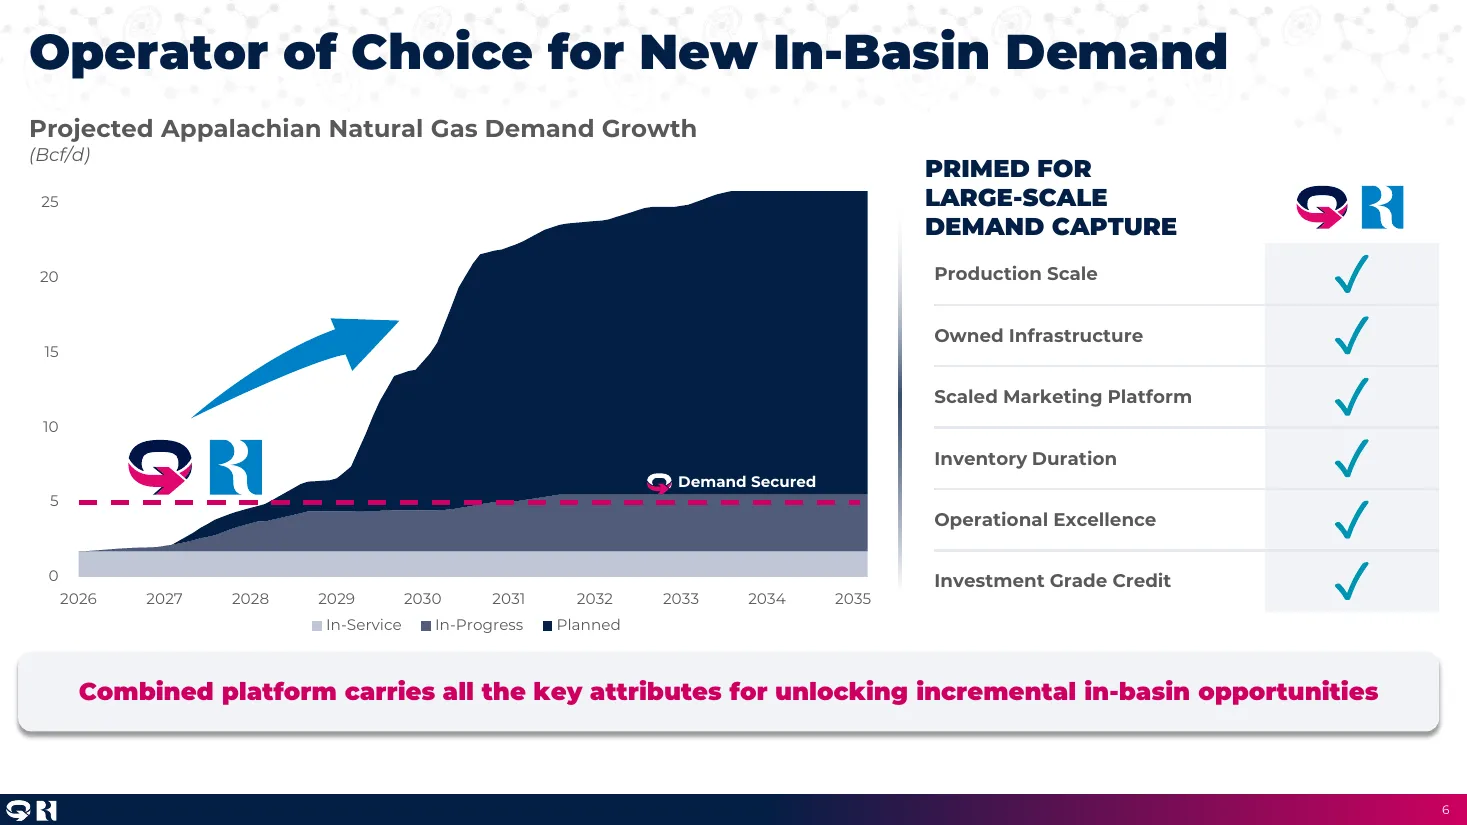
The slide's headline is 25 Bcf/d of potential Appalachian demand by the mid-2030s, raised from about 20 a quarter earlier. The part to underline is the dashed line: only about 5 Bcf/d is secured or in progress. The rest is planned. $EQT's own revenue history shows what the gas price does to a producer even with hedges and pipes:
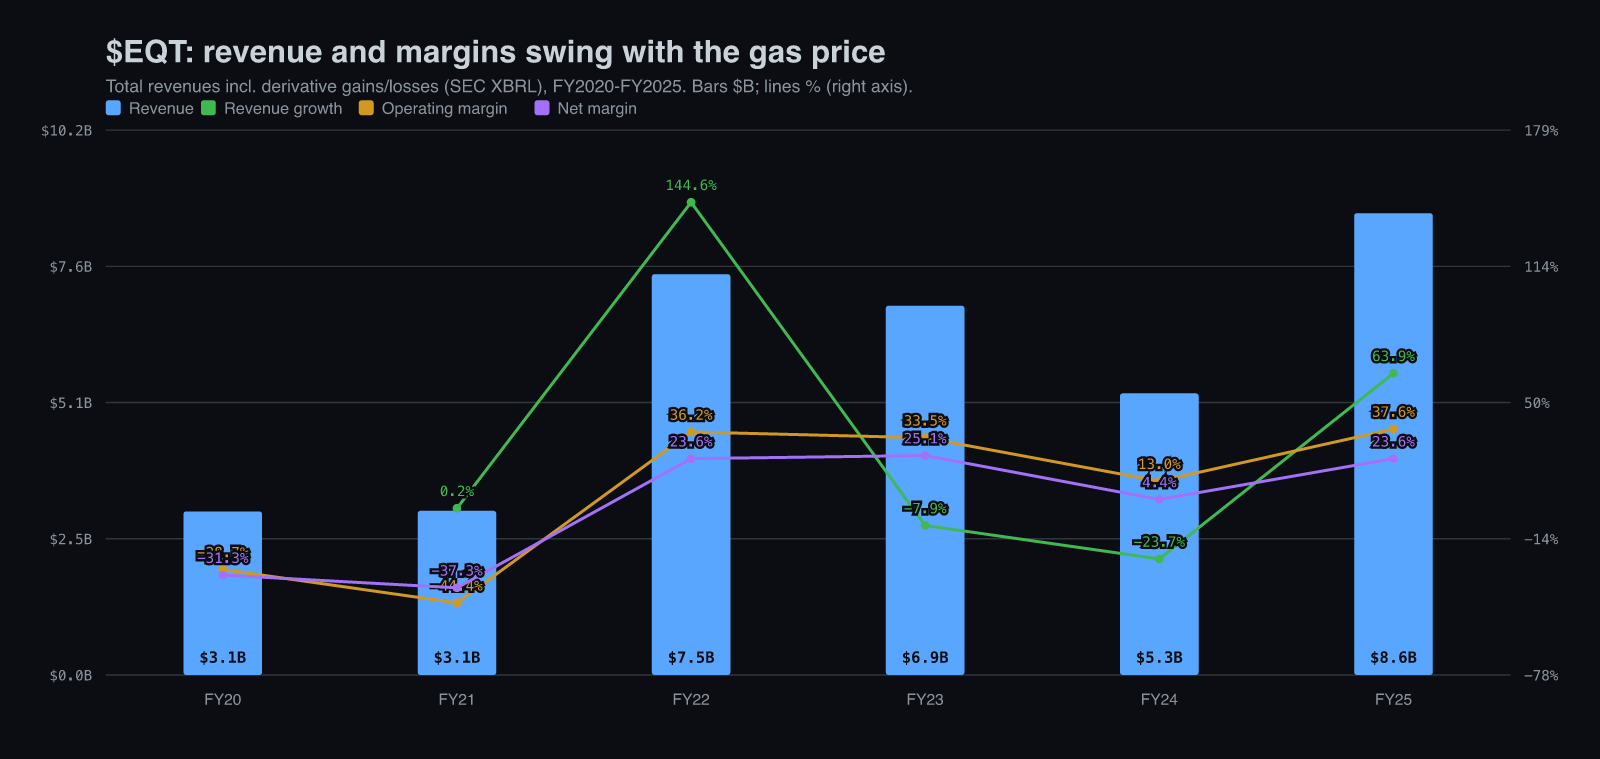
Across fiscal years, total revenue including derivative gains and losses went from $3.06 billion in FY20 and $3.07 billion in FY21 to $7.50 billion in FY22, then fell to $6.91 billion in FY23 (−7.9%) and $5.27 billion in FY24 (−23.7%) before rebounding 63.9% to $8.64 billion in FY25; operating margin moved from −28.7% and −44.4% in the hedge-loss years to 36.2% in FY22, 33.5% in FY23, 13.0% in FY24 and 37.6% in FY25, with net margin at 23.6% in FY25.
The quarters show the same thing faster. Total revenue was $1.96 billion in Q3'25 (+52.6% year on year, 30.8% operating margin), $2.39 billion in Q4'25 (+47.0%, 42.5% margin), $3.38 billion in Q1'26 (+94.2%, 60.3% margin, the January freeze) and $1.81 billion in Q2'26 (−29.2%, 21.8% margin). Operating margin fell from 60.3% to 21.8% in three months. That is what a gas producer is.
The cash is steadier than the income statement: operating cash flow of $5.13 billion in 2025 against net income of $2.04 billion and capital spending of $2.29 billion. The pipes are why. In FY2025 the upstream segment was 81.1% of segment revenue at a 28.9% operating margin, gathering 13.1% at 64.3% and transmission 5.8% at 65.6%. The pipes earn margins twice the wells', and they keep earning in a $2 winter, which is the reason $EQT bought Equitrans in 2024.
$AR is the challenger with the better chart. Antero produced a record 4.1 Bcfe/d in the second quarter, up 21%, sells liquids priced off Mont Belvieu as well as gas, and holds firm transport to the Gulf Coast and Midwest; its stock is 28% higher than a year ago and above both moving averages, against 1.5% for $EQT. Its own demand tally is the most aggressive we found: data-center and power demand rising from 15 to 34 Bcf/d between 2025 and 2030, and LNG plus Mexico exports from 24 to 47 Bcf/d, which it calls 37% growth on a 112 Bcf/d base. Those are third-party and company estimates, and they run far ahead of the Energy Information Administration's 2027 forecast; we use them as the bull case, not the base.
$EXE is the largest Haynesville position next to the export plants, under new management. Expand Energy's chief executive left in February, an interim led the company through the summer, and Danny Brown, previously chief executive of Chord Energy, took over today. It bought the marketer Twin Eagle and signed an LNG supply deal with Delfin. The stock is 10% lower than a year ago and below its 200-day average. $CRK is excluded: Comstock spent $1.56 billion over the last year against $0.82 billion of operating cash flow to prove up its Western Haynesville acreage, which is a bet on $4 gas paid for at $3.
Management & Track Record
The operators who matter most here have records measured in delivered capacity, not in forecasts.
Table terms: CEO; CFO; Bcfe/d.
Two of these teams are new: Expand's chief executive starts this week, and Williams's has been in the seat about fifteen months. Fusco has led Cheniere since 2016, Rice has led EQT since 2019, and Kinder co-founded Kinder Morgan in 1997, and it is the record of delivering capacity on time. The one blemish of consequence in the group is Venture Global's commissioning dispute: an arbitration panel found in October 2025 that it had not acted as a reasonable operator in declaring Calcasieu Pass commercial, and damages were left for a later hearing.
Capital allocation is where these records show up in cash. Cheniere bought back about 2.2 million shares for $550 million in the second quarter, paid a $0.555 quarterly dividend and funded about $1.1 billion of growth spending, roughly a fifth of it from equity. Kinder Morgan funds its backlog from about $3 billion a year of cash flow available for expansion while holding leverage at the low end of its range. $EQT says the Range deal keeps it at triple-B credit quality at closing. Venture Global refinanced $5.3 billion in a quarter and says that saves more than $100 million a year of interest and preferred dividends, which matters more for a company still building CP2 than for one that has finished building.
Catalysts
The next seven weeks decide most of this, because the prints and the first cold arrive together.
Risks & What Breaks It
What forces a thesis change: a storage deficit of 50 Bcf or more against the five-year average by mid-December would make Henry Hub, and the producers, the better trade than the exporters. A ceasefire that reopens Hormuz to LNG traffic would do the opposite.
Price Setup
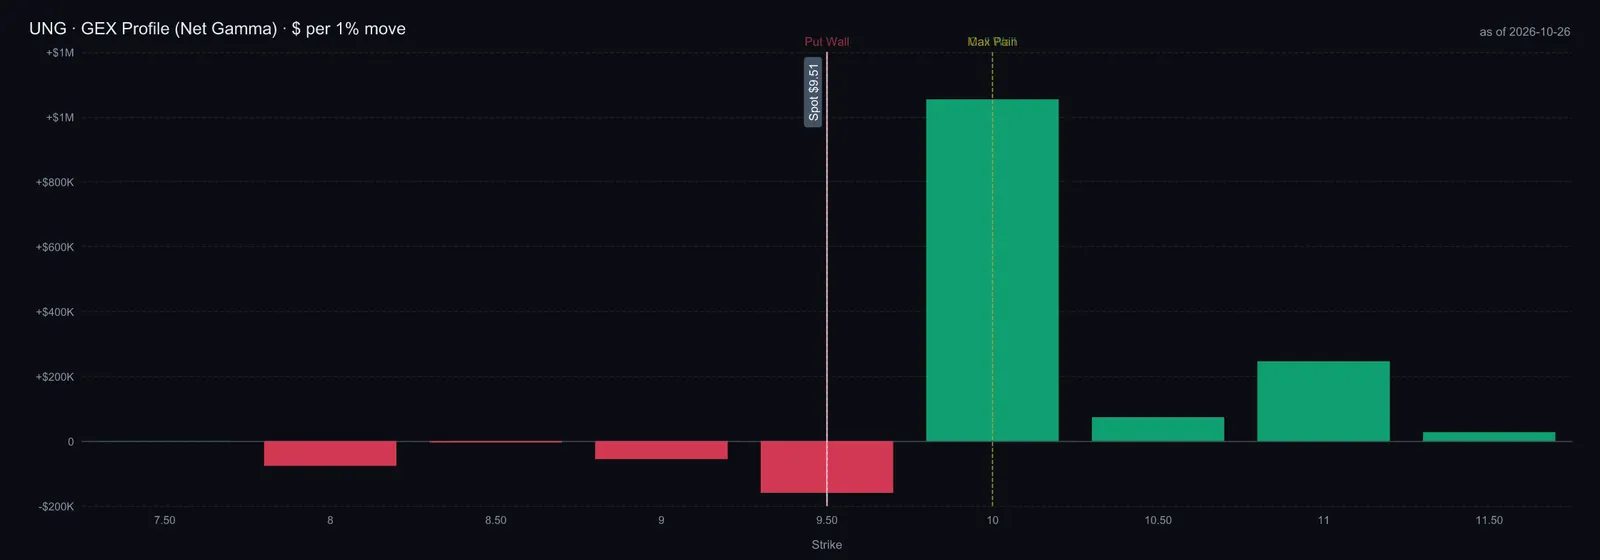
$UNG is sitting on the lower line of its wedge with dealers long gamma between $9.50 and $10, which tends to pin the price rather than launch it.
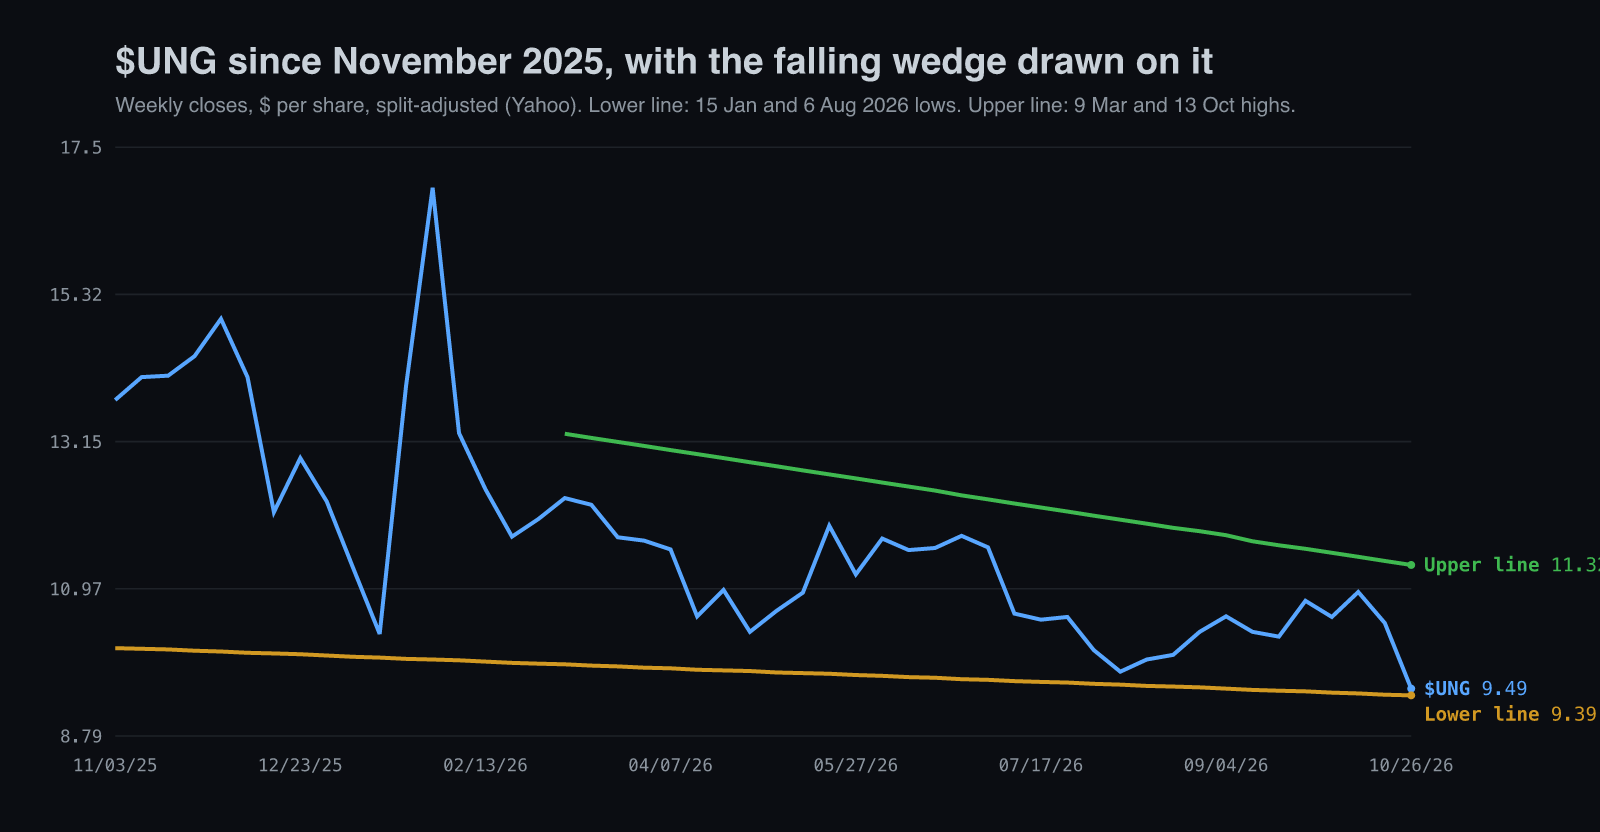
$UNG closed at $9.57 on 26 October, below its 50-day (~$10.47) and 200-day (~$11.23) averages and at a 52-week low. Options data from 23 October put the put wall at $9.50, the call wall and maximum pain at $10, and call open interest at three times put open interest. Implied volatility for 20 November is about 60%.
$LNG is the opposite picture: a 52-week high at $301.06, up 55% this year, above a rising 50-day (~$279) and 200-day (~$254), with its largest call open interest at $300 and puts concentrated at $230. A stock at its high into an earnings print on 29 October carries the risk that good news is already in the price.
$EQT closed at $54.55 on the day it announced the Range deal, between its 50-day (~$53) and 200-day (~$55), with option walls at $57.50 and $50. An acquirer's shares often trade sideways until the deal closes; $RRC, at $53.32, now trades on the exchange ratio.
Valuation & House View
On trailing cash flow Cheniere and the pipes cost about twice what the producers do, and the market is paying that for contracted income in a war; nothing here is cheap enough to buy before this week's prints.
On trailing earnings $LNG sits at 22.7×, the 88th percentile of its own five-year range, but derivative marks swing its GAAP income by billions a quarter, so we read cash flow instead. The producers sit near the middle of their ranges: $EQT 12.7× (49th percentile), $AR 11.9× (42nd), $EXE 8.1× (48th). $KMI is at 20.9× (48th) and $WMB 28.5× (59th).
We ran a three-year price-appreciation-hurdle screen on trailing operating cash flow per share, the one measure every name reports on the same basis. It asks how fast cash flow per share must grow for a buyer at today's price to earn 10% annual price appreciation, if the stock ends at a given multiple of cash flow. The multiples are our assumptions: 5× and 7× for producers, who must reinvest much of their cash, and 9× and 12× for exporters and pipes. There is no comparable history of these price-to-cash-flow ratios in our data, so treat the multiples as a sensitivity, not a calibration. Dividends are excluded; this is not a complete total-return or free-cash-flow valuation.
Table terms: TTM.
Under these assumed exit multiples, the screen requires the most growth from the pipes, $WMB above all, a moderate amount from Cheniere, and very little from the producers and from $VG. $EQT needs about +1.5% a year of growth in cash flow per share to justify its price at 7×, while $WMB needs +17.6% even at 12×. The low hurdle at $VG is the market pricing its spot cargoes and its debt, not a bargain. These hurdles depend on the chosen multiples and do not establish the market’s actual growth forecast.
For the winter itself, the curve already holds a view, and the useful question is which way the weather breaks it. In our base case, a strong El Niño keeps the northern states mild, heating demand runs below normal, the export plants stay full and end-March storage finishes above the agency's 1,883 Bcf; the exporters' contracted fees and the pipes hold up, while funds and producers lag. In the agency's own case, a normal winter takes January toward $4, the producers recover, and $UNG still pays the January roll on the way. In the tail case, a cold January despite El Niño, as in 2009, spot spikes as it did in January 2026, salt storage empties, the producers and funds rally briefly, and the largest speculative short in two and a half years has to cover.
The operating theme is credible, but its instruments carry different risks. $LNG offers contracted liquefaction fees and marketing exposure; $KMI offers pipeline capacity fees; $EQT offers low-cost production with merger execution risk. At the October 26 snapshot, $LNG was at a 52-week high and the proposed EQT transaction would give Range holders about 27% of the combined equity upon closing. A mild winter could still pressure domestic gas. Near-term evidence includes Cheniere’s October 29 guidance update and the status of Corpus Christi Train 7. For the domestic balance, watch whether storage falls at least 50 Bcf below the five-year average by the December 10 report; the thesis review date is December 15, 2026. A short-dated fund remains exposed to the entire futures path, not simply to a forecast of winter spot prices. Persistent contango can hurt returns, but loss is not automatic when spot prices are unchanged.