
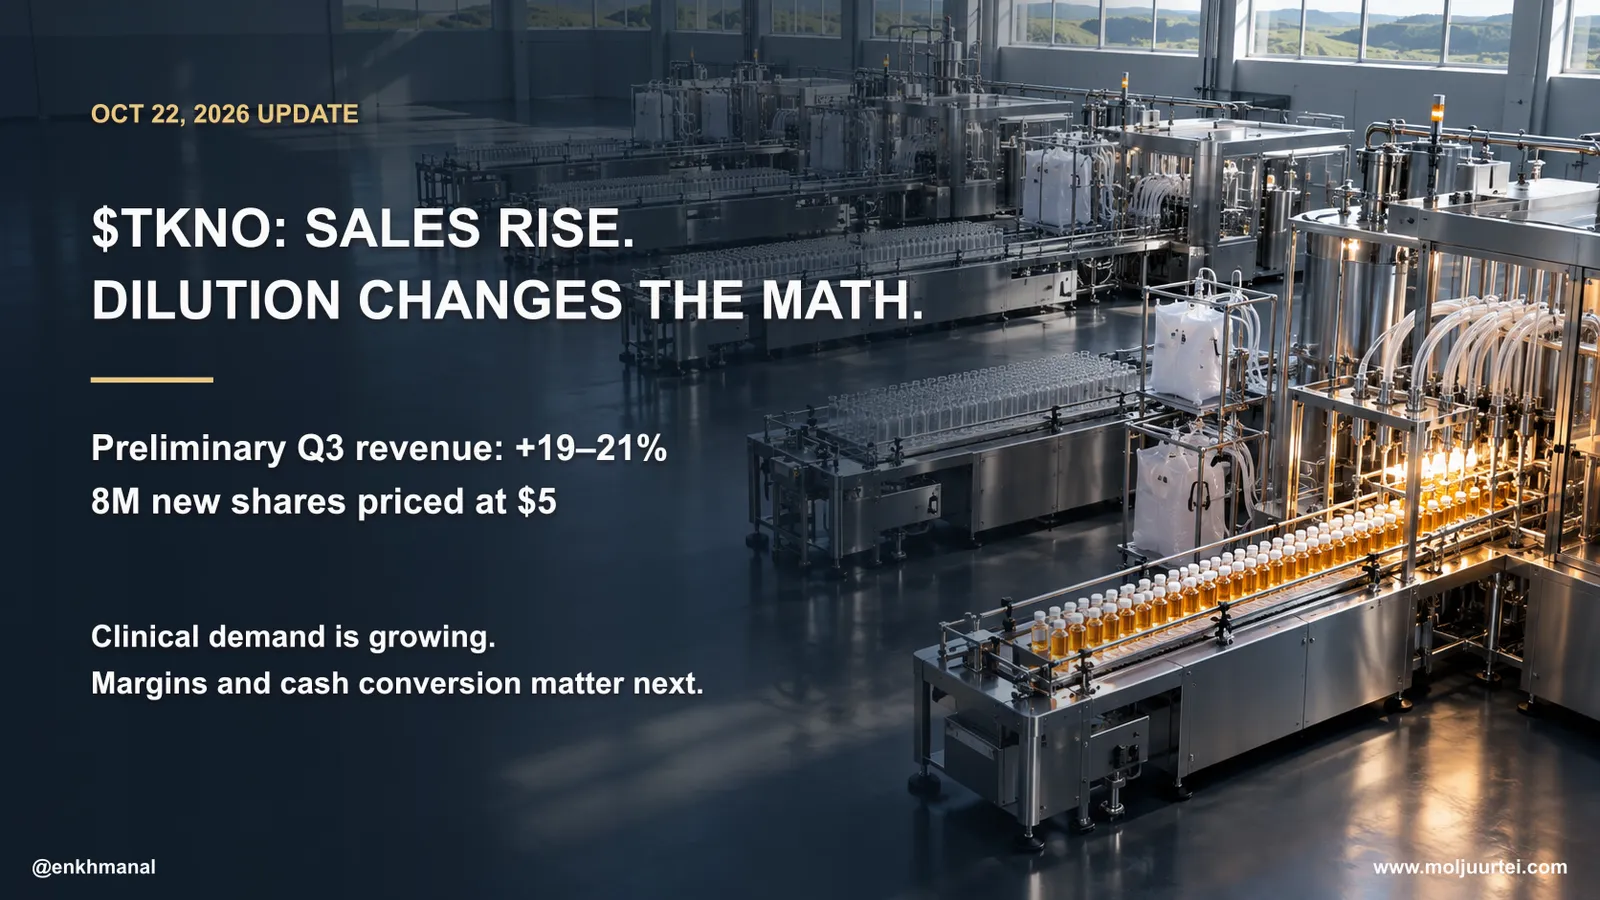
$TKNO — Clinical demand grows; the $5 offering changes the valuation
Update · October 22, 2026
On October 20, Teknova released preliminary, unaudited Q3 2026 results: revenue of $12.5–12.7M, up 19–21% year over year; gross margin of 36–38%; adjusted EBITDA loss of $1.0–1.2M; and cash plus short-term investments of about $16.6M. Versus the prior year, management estimates gross margin improved by 5–7 percentage points and adjusted EBITDA improved by at least 25%. The sequential comparison is less strong: Q2 gross margin was 40.1% and adjusted EBITDA loss was $0.7M. Final Q3 results are scheduled for November 4 after the market closes.
That same day Teknova priced a primary offering of 8.0M new shares at $5.00, for $40M gross proceeds before fees, with a 1.2M-share underwriter option; closing is expected on or about October 22. Against the last reported 53.7M shares outstanding (June 30), the base deal adds shares equal to 14.9% of that prior count and reduces existing holders’ ownership percentage by about 13.0%; full exercise would add 17.1% to the prior count and dilute their ownership by about 14.6%. The announced expected closing date is not a confirmation that the offering has closed. Management said proceeds are for general corporate purposes, potentially including debt repayment; it disclosed no current acquisition commitment.
Preliminary Q3 demand supports the clinical-customer ladder thesis, while lower margin and a larger adjusted EBITDA loss leave cash conversion unproven. The historical price and options charts below were captured on October 20 before the offering and are not current trading levels. The valuation section now uses the $5 issue price as an offering reference, with explicit share-count and cash assumptions; it is not a live market quote.
$TKNO makes the broths, agar plates and buffers that biology runs on, from catalog bottles to drug-grade custom batches, in a California plant management says can support about $200M of annual output. Preliminary Q3 2026 revenue came in at $12.5–12.7M, up 19–21% year over year, but gross margin was estimated at 36–38% and adjusted EBITDA remained negative at $1.0–1.2M. On the same day, the company priced 8M new shares at $5, plus a 1.2M-share option, changing the per-share equation. The plant has room to grow; whether clinical demand can fill it while margins recover is still the test.
What Changed
Every biologic drug, mRNA vaccine, gene therapy and DNA test starts with living cells doing chemistry in a liquid that someone had to make. The liquid matters more than it sounds. A wrong salt concentration or a contaminated batch can kill a culture, shear a DNA molecule or ruin a diagnostic kit, and inside a regulated drug process it can void months of work.
Start here. A cell is a microscopic chemical factory that copies itself when it is fed and kept at the right temperature, salt level and acidity. A plasmid is a small ring of DNA that a bacterium such as E. coli copies over and over, which is why biotech uses it as a photocopier for genes. A culture medium is the food those cells grow in: a broth of amino acids, sugars and salts, or the same broth set with agar, a seaweed gel, into the plate a scientist streaks bacteria onto to grow single colonies. A buffer is salted water held at one precise acidity (pH), so that DNA and proteins stay intact while they are broken out of the cell, washed and purified. A GMP-grade reagent is the same liquid made under Good Manufacturing Practice, with every raw material, step and test documented, because it will end up in something injected into a patient.
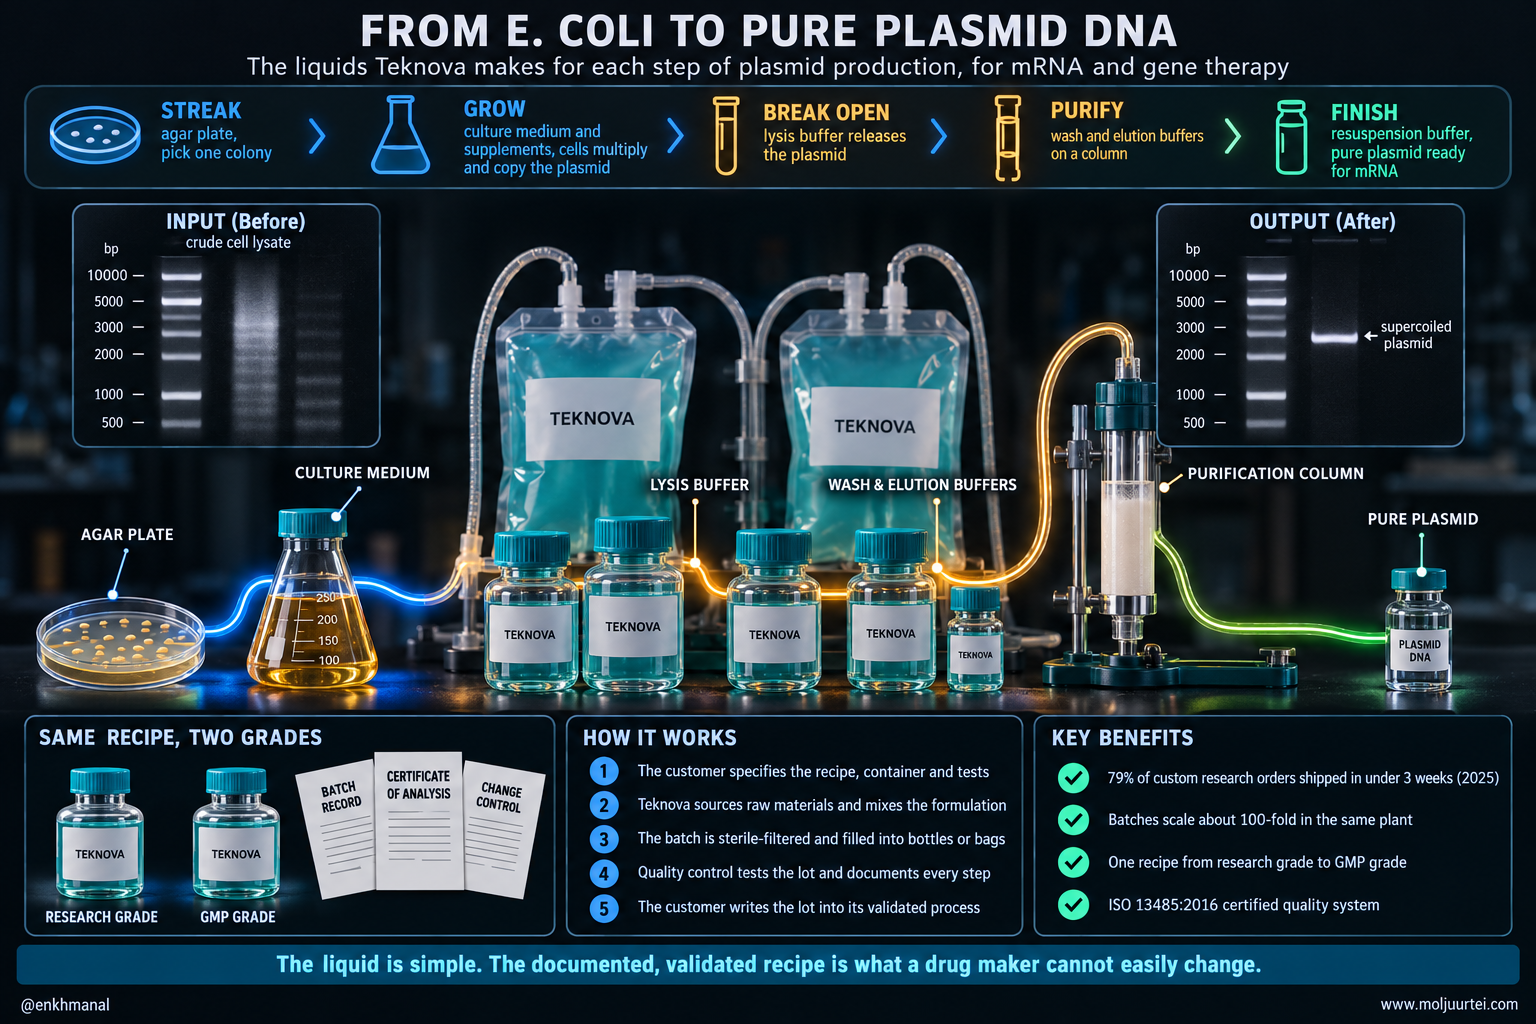
Follow one job across the bench. A scientist making the DNA template for an mRNA vaccine streaks E. coli carrying the plasmid onto an agar plate and picks one colony, grows it overnight in a few litres of broth, cracks the cells open with a lysis buffer, runs the result through a purification column with a sequence of wash and elution buffers, and ends with a vial of pure plasmid that is then copied into mRNA. Every step uses up a different liquid, and Teknova makes all of them. We walked through the other half of that chain, how a personalized mRNA vaccine is designed, in our personalized cancer vaccines piece.
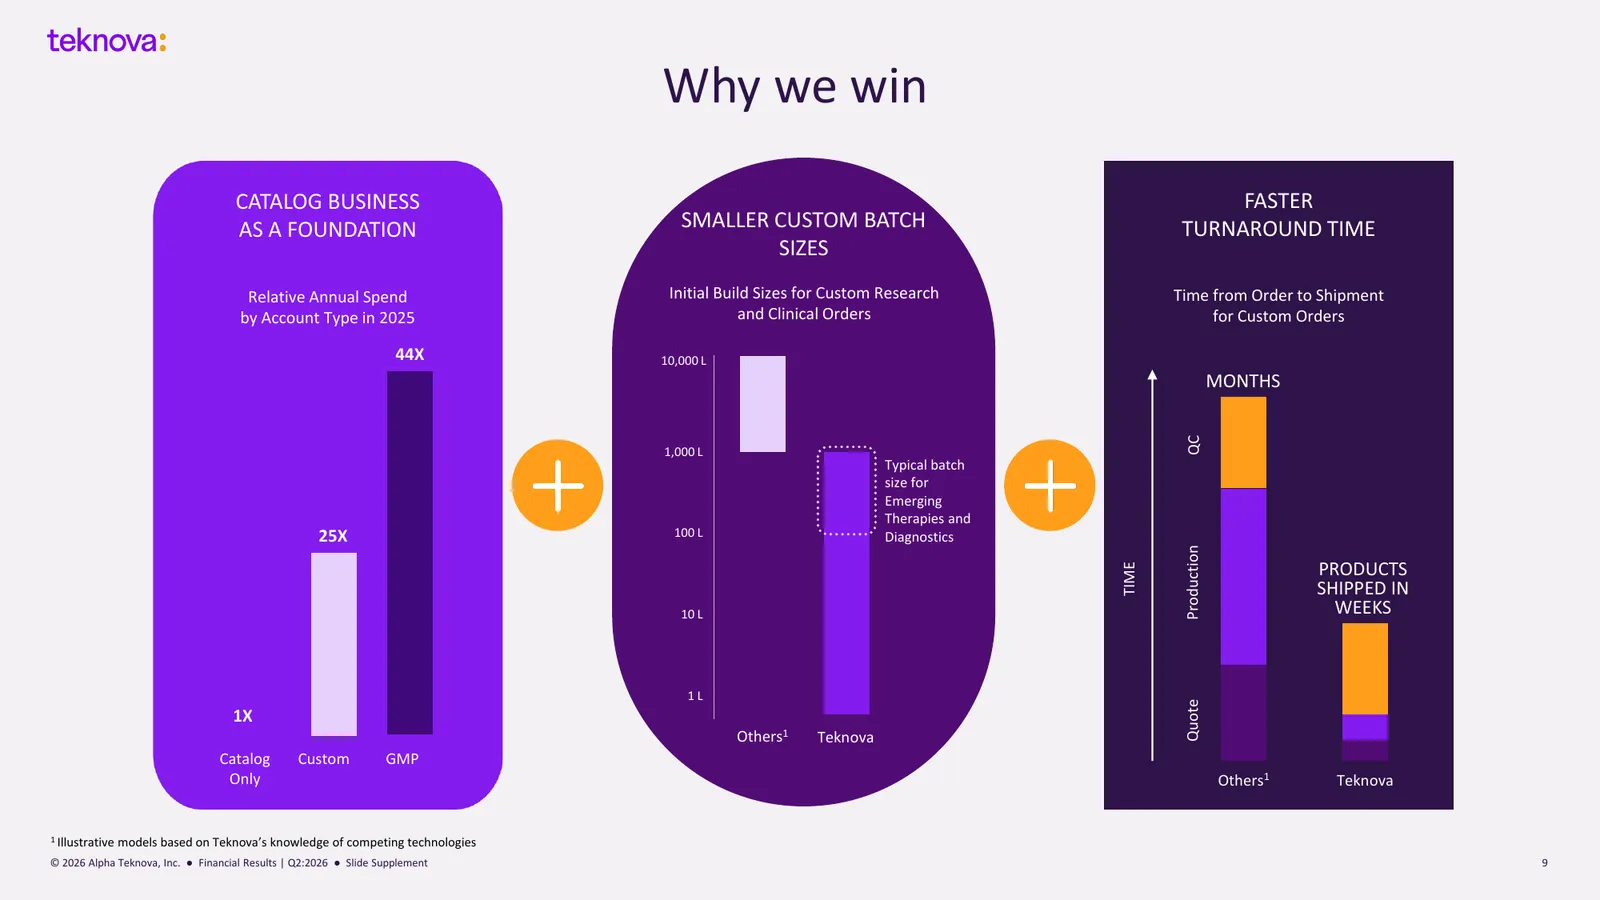
Labs have two traditional sources for those liquids. They mix their own, which is cheap per litre but costs skilled hours, varies from batch to batch and produces none of the paperwork a drug filing needs. Or they buy from the giants, Thermo Fisher, MilliporeSigma (owned by Merck KGaA) and Cytiva (owned by Danaher), whose plants are built to run large, standard lots well. That model strains when the customer wants its own recipe: by Teknova's own illustrative comparison, large suppliers' custom lots start around 1,000 litres and take months from quote to shipment.
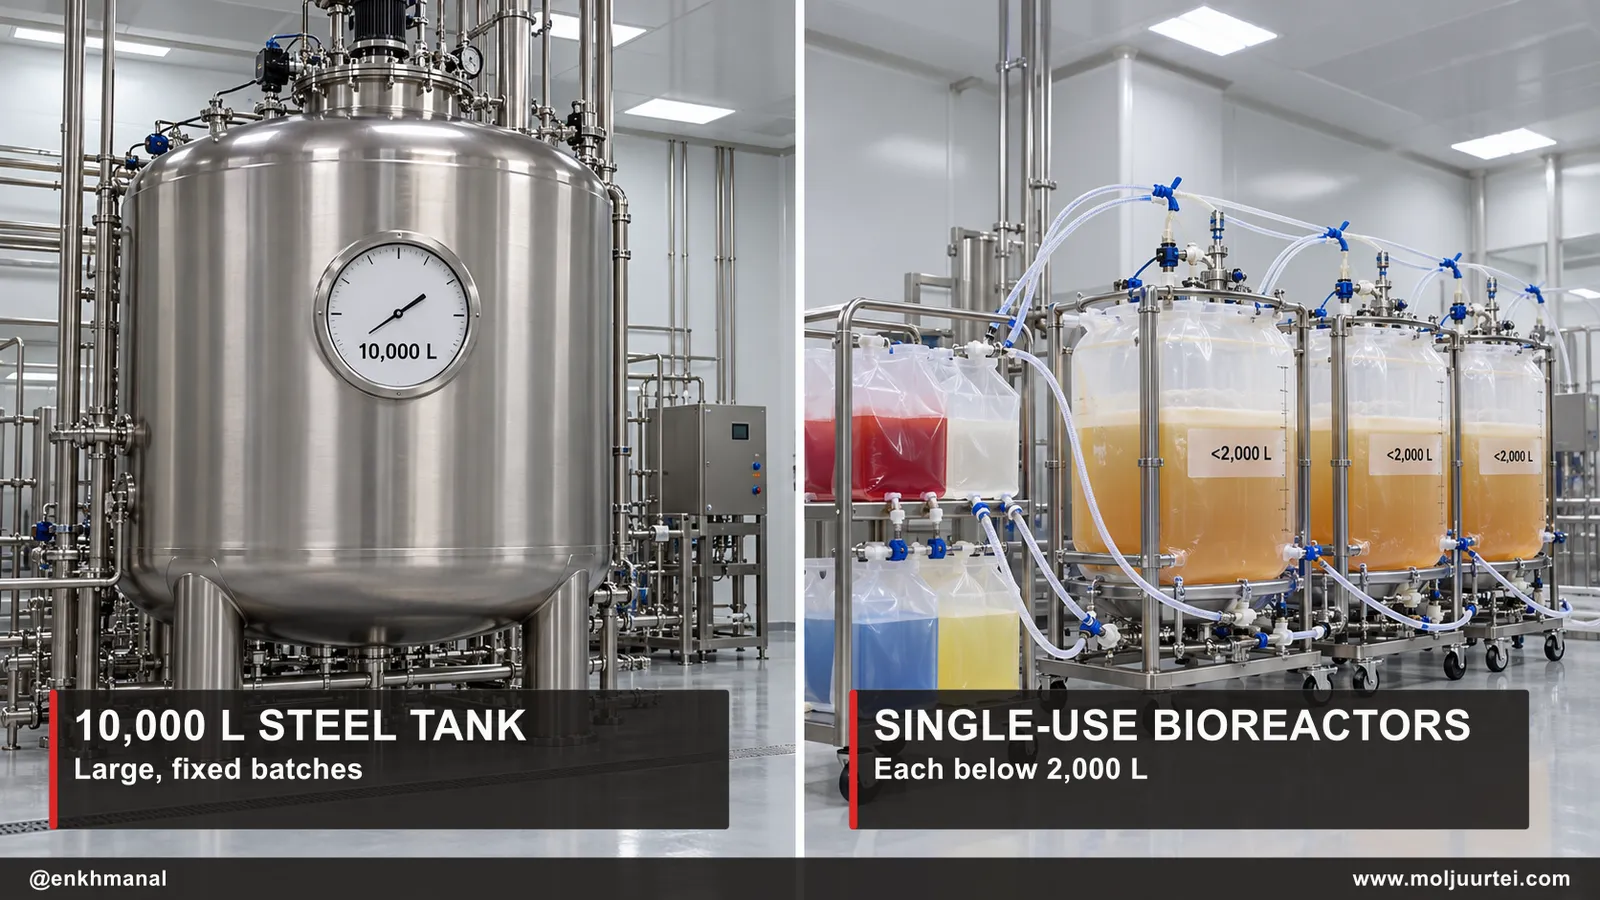
Three things moved the work toward small, custom and documented batches. New drug types, cell and gene therapies, mRNA and antibody-drug conjugates, are made in single-use bioreactors in batches under 2,000 litres, and each program brings its own recipe. Regulators lock a validated process: change a supplier or a formulation after a trial starts and the developer has to prove the product is unchanged, which is why a buffer written into a filing tends to stay for the life of the product. And diagnostics became manufactured products: liquid-biopsy, sequencing and spatial-biology kits are built on custom buffers made to someone else's specification.
The money is coming back to that work. Biotech funding fell hard from 2022 into 2024, and by management's count it has been higher year on year for three straight quarters; Teknova's own history shows about a four-quarter lag before new funding becomes its revenue. The company that gains most from small, custom, documented batches is the one that already built a plant for them and runs it at a fraction of its capacity. That is Alpha Teknova.
Thesis
$TKNO turns a customer's recipe into research-grade or drug-grade batches in weeks, and its GMP accounts spend about 44 times a catalog-only buyer; preliminary Q3 sales grew 19–21%, but margin fell and the new $5 offering adds material dilution, so growth has yet to prove itself in per-share cash generation.
Business & Backdrop
Teknova sells two grades of three products. Lab Essentials is research grade ("research use only"), about three-quarters catalog and one-quarter custom; Clinical Solutions is GMP grade and about 90% custom. The products are agar plates, liquid culture media with supplements, and molecular-biology reagents: buffers, lysis and purification solutions, and water. It sells to more than 3,000 accounts, ships almost everything from Hollister, California, and booked 94.4% of 2025 revenue in the United States. One distributor accounted for 21% of 2025 revenue; the largest direct customer was under 7% of Q2 2026 sales.
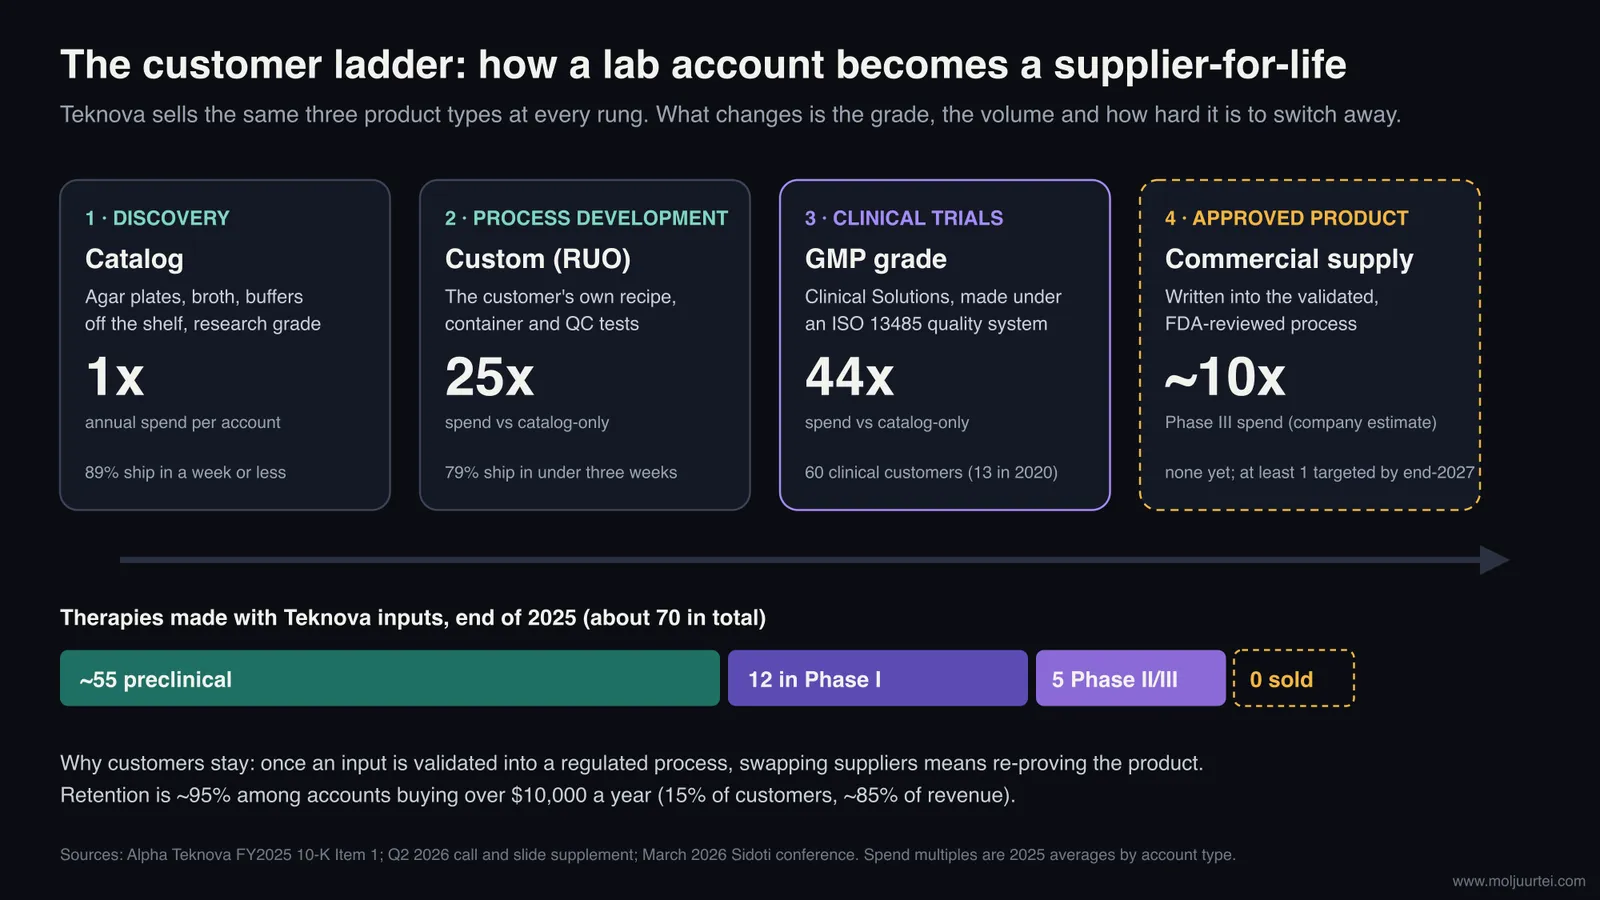
The business model is a ladder. A lab starts on catalog plates and broth; when its process matures it orders its own recipe; when the product enters trials it needs the GMP version. In 2025 custom accounts spent about 25 times what catalog-only accounts did and GMP accounts about 44 times, and retention ran about 95% among accounts buying over $10,000 a year, which are 15% of customers and roughly 85% of revenue.
Lab Essentials was 76.6% of 2025 revenue and Clinical Solutions 18.9%, with other revenue at 4.5%. By end market, biopharma and contract manufacturers are about 50% of revenue, life-science tools and diagnostics about 30%, academic, government, hospital and other buyers about 15%, and non-product revenue 5%; cell and gene therapy customers are about 24%. In Q2 2026 Lab Essentials was 75.4% of total revenue and supplied 73% of the year-on-year growth, mostly custom work for tools and diagnostics makers; Clinical Solutions was 19.9% of total revenue and supplied 19% of it. Over the first half the leader flips: Clinical Solutions grew 41.9% and produced 42% of the growth. The laggard is an end market rather than a product line, as cell and gene therapy accounts fell in Q2 on a delayed order.
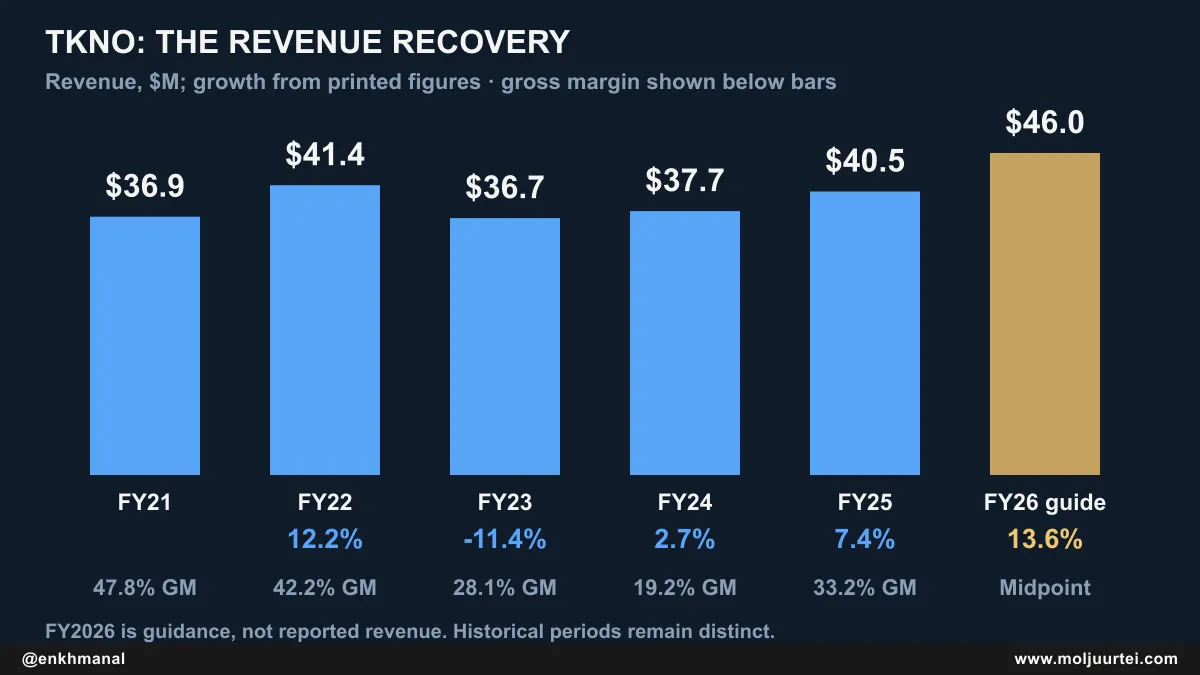
The record so far is a round trip. Revenue was $36.9M in FY21, $41.4M in FY22 (+12.2%), $36.7M in FY23 (−11.4%), $37.7M in FY24 (+2.7%) and $40.5M in FY25 (+7.4%), with FY26 guided to $45–47M (+14% at the midpoint). Gross margin ran 47.8% in FY21 and 42.2% in FY22, fell to 28.1% in FY23 and 19.2% in FY24 as volume dropped on a plant built for growth (FY24 also carried a $2.8M inventory charge), and recovered to 33.2% in FY25. Operating margin went from −32.5% in FY21 to −119.9% in FY22 and has narrowed every year since, to −41.9% in FY25.
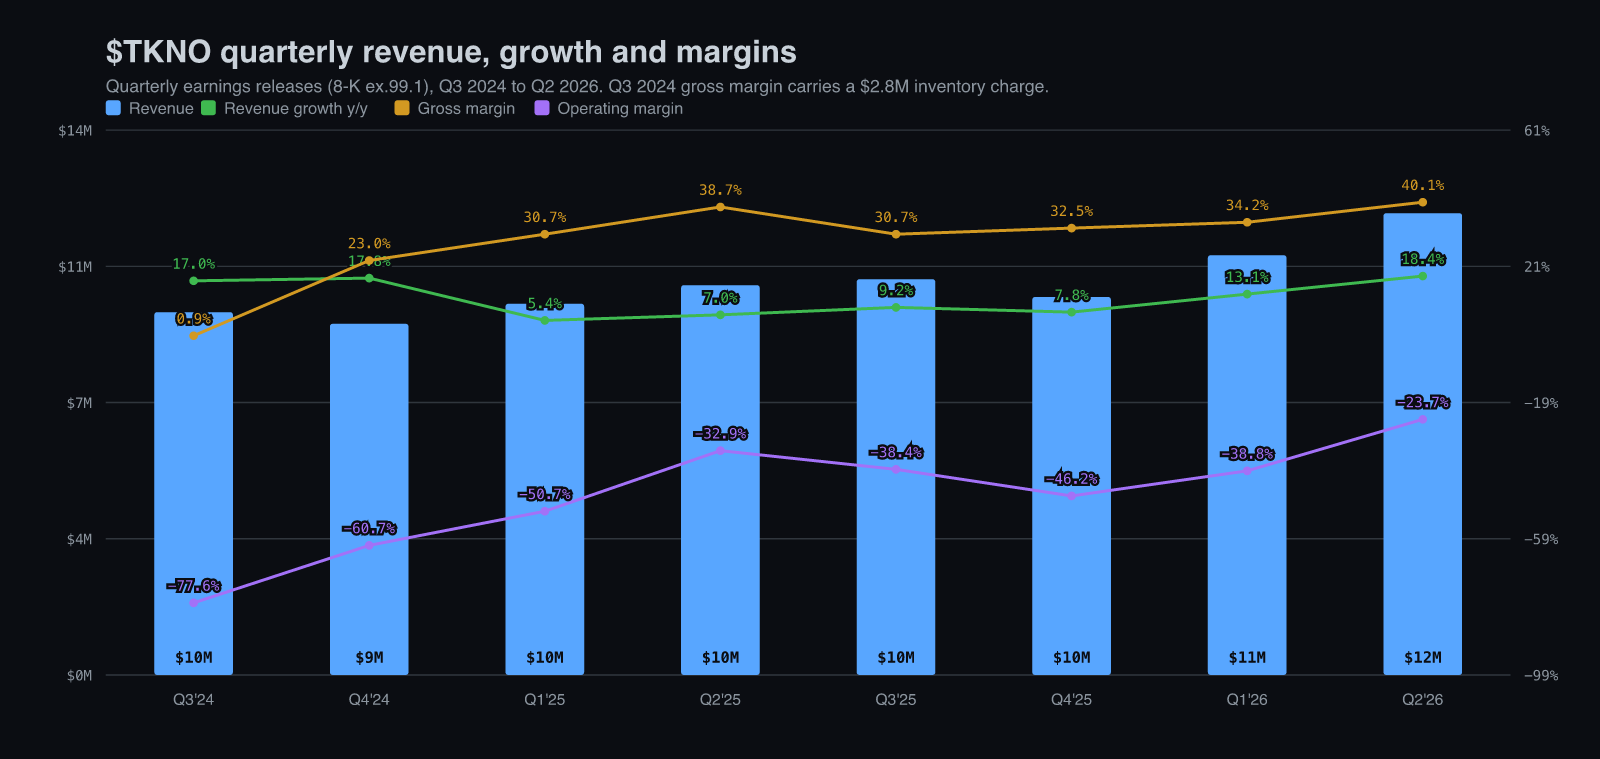
The quarters show where it turned. Revenue grew 17.0% in Q3 2024 and 17.8% in Q4 2024 off a weak base, slowed to 5.4%, 7.0%, 9.2% and 7.8% through 2025, then accelerated to 13.1% in Q1 2026 and 18.4% in Q2 2026 ($12.2M). Over the same eight quarters gross margin went from 0.9% in Q3 2024 (the inventory charge) to 23.0%, 30.7%, 38.7%, 30.7%, 32.5%, 34.2% and 40.1%, and operating margin from −77.6% to −23.7%.
Peers confirm the turn and show where Teknova sits in it. $RGEN grew 13% organically in Q2 2026 to $204M and raised its 2026 organic growth guide to 10.5–13.5%. $MRVI's TriLink unit, which makes mRNA raw materials, grew 13.4% excluding COVID orders on demand for discovery mRNA and GMP consumables. $BLFS, whose cell-therapy storage media sit inside 18 approved therapies, grew 21% to $28.5M. The weak spot is the academic research reagent: $TECH grew 3% organically in its June quarter and was flat for the fiscal year, then agreed to be bought by Merck KGaA for $73 a share in cash. Teknova's 18% sits at the top of that range, from a much smaller base.
One popular framing on X files $TKNO with $AZTA, $RPID and $TWST as suppliers to automated, round-the-clock labs. The filings support a narrower version. Teknova makes plate formats for robotic handlers and bulk buffers that customers plumb into their own instruments, so more automation means more consumables used, but the company does not cite automation as a growth driver. The ladder from catalog to GMP is the engine; automation is a modest boost to the bottom rung.
Technology & Moat
What Teknova makes is ordinary chemistry done to an unusual standard of speed and record-keeping, and the moat is process rather than patent: the company owns no issued patents and relies on trade secrets, a database of thousands of previously made formulations and 30 years of production know-how. In 2025 it shipped 79% of custom research orders in under three weeks and 89% of catalog orders within a week. Its batches start at a few litres and scale about 100-fold in the same clean rooms (about 12,500 square feet inside a 190,000-square-foot leased campus), and the same recipe can be made to research grade or, under an ISO 13485:2016 certified quality system, to GMP grade.
Walk the advantage through to dollars. The comparator is a custom lot from a large supplier, which Teknova illustrates as 1,000–10,000 litres and months from quote to shipment; we have no independent measure of rivals' lead times, so treat the gap as the company's claim. The measured property is Teknova's 79% under three weeks, with starting batches of 100–1,000 litres for emerging therapies. The system consequence is that a process-development team can iterate on its exact recipe in weeks and carry it into the GMP version without qualifying a new vendor. The purchase is the step-up: those accounts spend 25 times (custom) to 44 times (GMP) a catalog buyer's annual spend. The revenue is Clinical Solutions, $7.65M in 2025 and up 41.9% in the first half of 2026. The step not yet proven is the last one, a supported therapy reaching the market.
The lock-in comes from regulation rather than from the chemistry. A buffer validated into a filed manufacturing process is expensive to swap because the developer must show the product is unchanged; that is why management describes its components as used for the life of a product, and why retention is high where the spend is. The limits are real too. Thermo Fisher, MilliporeSigma and Cytiva are many times larger, and some are also Teknova customers; smaller rivals such as GeminiBio, Boston BioProducts and Biologos chase the same custom work; and some customers can make the same liquids in-house. None of Teknova's products is registered with the FDA: they are sold as ancillary materials, and their standing rests on customers' own audits of the Hollister quality system.
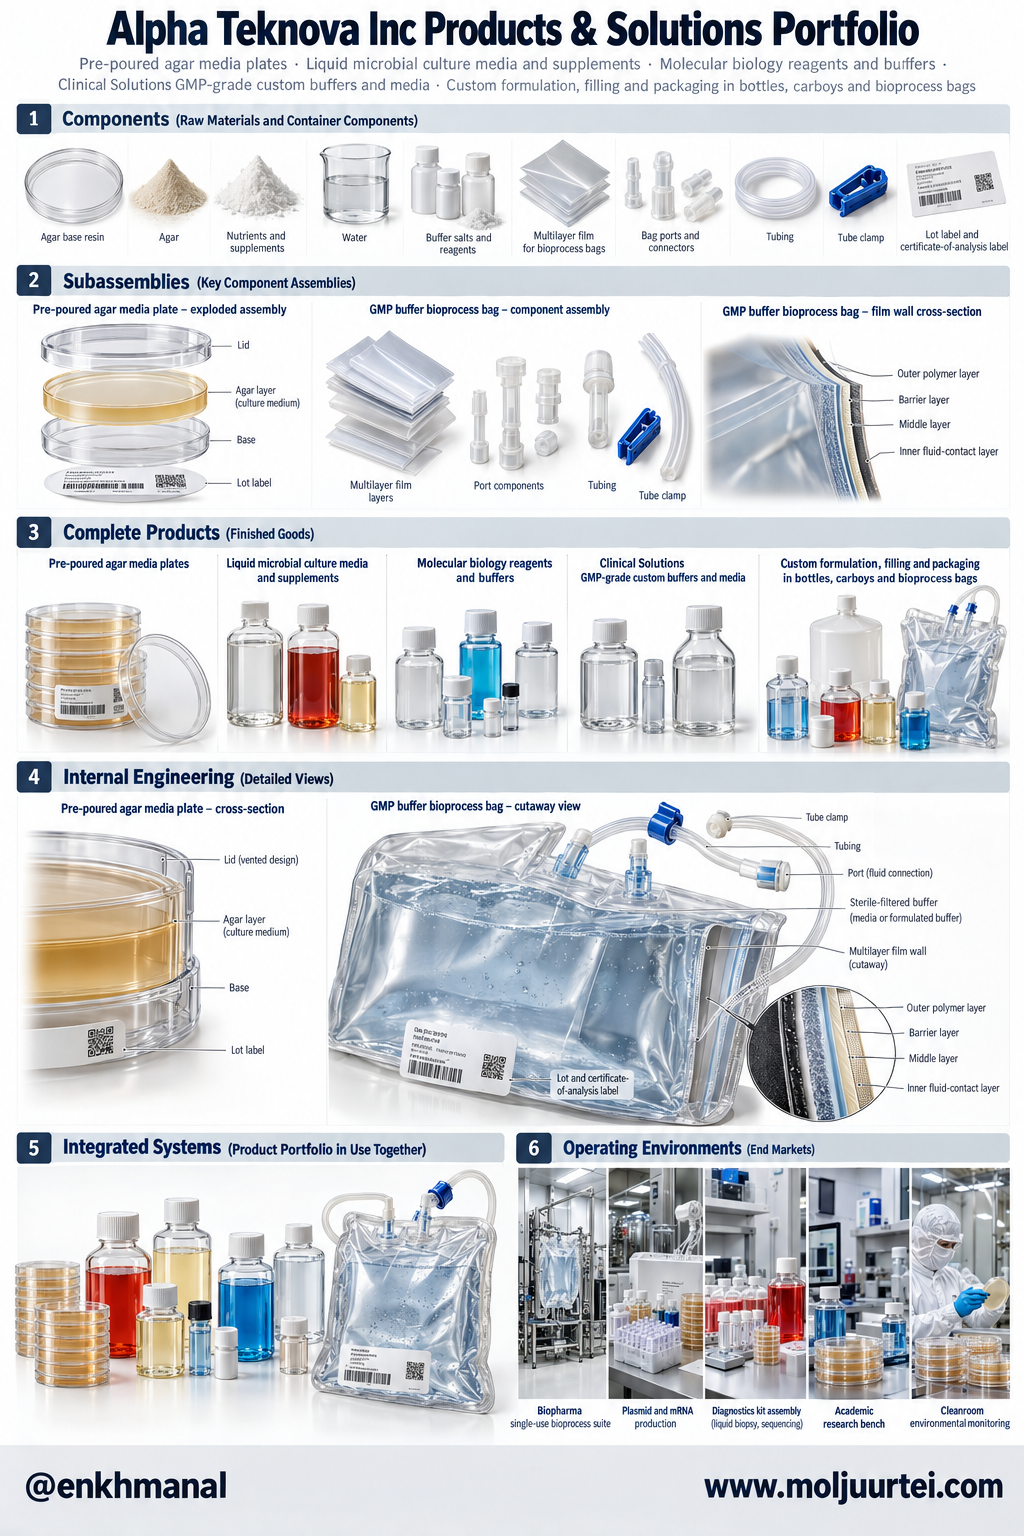
The product line is narrower than a tools giant's, and that is the point. Three product types in two grades come off one campus, so a customer's research recipe and its drug-grade successor are made on the same lines, by the same people, against the same records.
Roadmap & R&D
Teknova spends little on research in the laboratory sense, $2.2M in 2025 or about 5% of revenue, and its roadmap is commercial and operational rather than scientific. The money is going to four places.
The roadmap's real deliverable is not on that list: a customer's therapy reaching the market. Five supported therapies were in Phase II or III at the end of 2025, up from three a year earlier, and management expects at least one to be commercial by the end of 2027.
The Setup — Why It's Mispriced
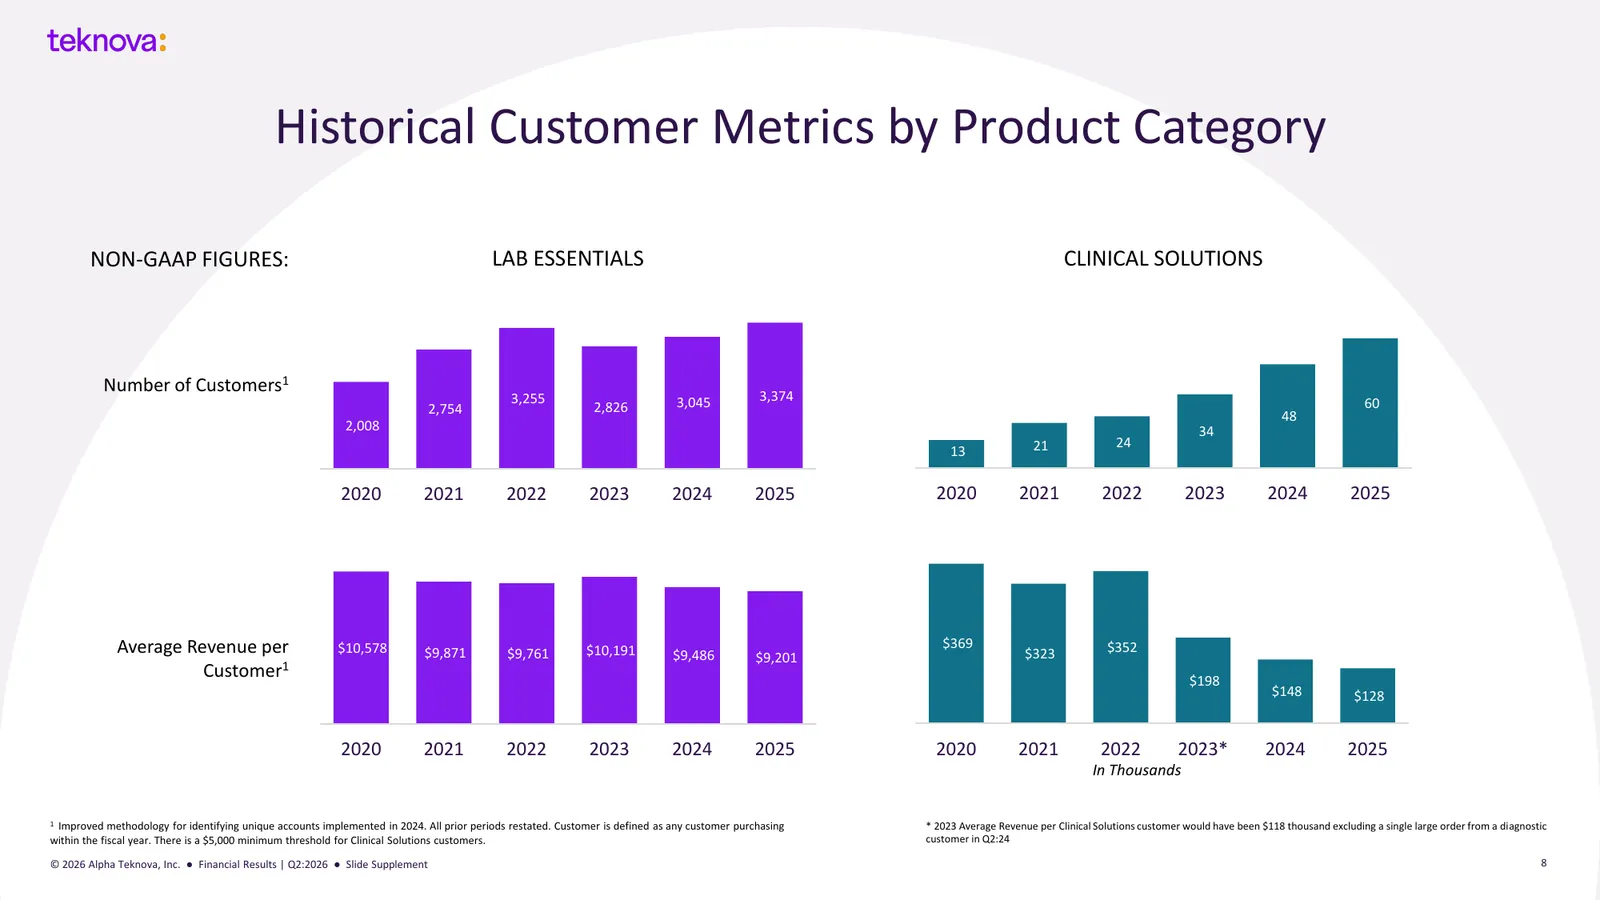
The original October 20 report observed that $TKNO had traded with the biotech recovery. Its long-run value depends on a slower variable: how fast clinical customers climb. Through that October 20 snapshot, the shares had moved with $MRVI and the $XBI biotech fund, rising 4.0× off February's $1.91 low on funding headlines. The number that sets the long-run value is revenue per clinical customer, and it is falling for a good reason. Clinical Solutions customers rose from 13 in 2020 to 60 in 2025, while average revenue per clinical customer fell from $369,000 to $128,000 because most new accounts are early programs buying small lots. Those are the accounts whose spend multiplies if their therapies advance.
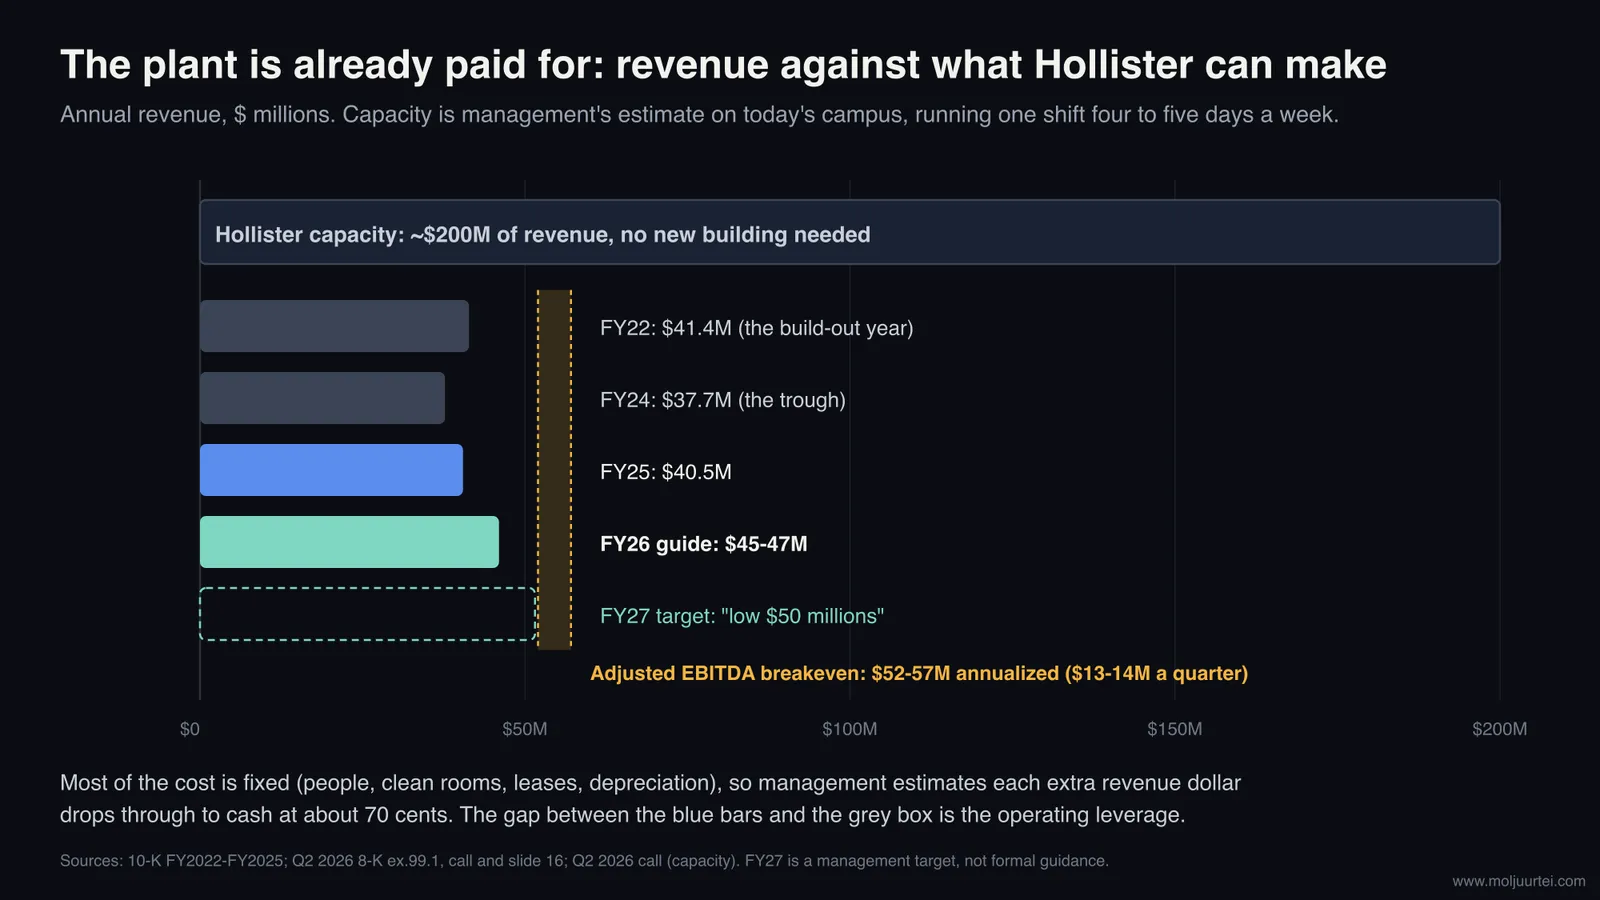
The cost base is mostly fixed, which is what makes the climb valuable. Management estimates incremental revenue turns into cash at about 70%, and guides adjusted EBITDA breakeven at $52–57M of annualized revenue, or $13–14M a quarter, with operating expenses held near $8M a quarter. Q2 2026 came within $0.7M: revenue $12.2M, gross margin 40.1%, operating expenses $7.8M, adjusted EBITDA −$0.7M. The breakeven range was $50–55M through 2025 and moved up when the sales investment began, so watch whether it moves again. The preliminary Q3 figures show why the 70% incremental-cash estimate is a management scaling assumption rather than an achieved result each quarter: sales rose but gross margin declined sequentially.
Q2 results, reported August 5. Q2 2026 revenue rose 18% to $12.2M; both product lines grew 18%, catalog revenue grew at a low double-digit rate, and growth came from custom work for tools and diagnostics customers and from biopharma outside cell and gene therapy. Cell and gene therapy accounts were down on a delayed order the company says shipped in Q3. The FY26 guide rose to $45–47M from $42–44M, the gross-margin outlook to the mid-to-upper 30s from the mid-30s, and the free-cash-outflow ceiling fell to under $8M from under $10M. The guide assumes the second half roughly matches the first and builds in no funding recovery.
Our products are used to manufacture more than 70 therapies or diagnostics currently in clinical trials, at least one of which we expect will be commercial by the end of next year.
Cash is running well ahead of reported profit. In 2025 Teknova lost $17.3M but used $8.6M of operating cash flow and $9.8M of free cash flow, because $6.3M of depreciation and amortization on a plant mostly paid for in 2021–22 and $3.4M of stock compensation never left the building. In the first half of 2026 the net loss was $7.7M against operating cash use of $3.8M and free cash outflow of $4.2M, with Q2 alone at −$0.6M. Working capital is the drag to watch: the cash cycle ran 118 days in 2025 (42 days of receivables, 95 of inventory, 19 of payables), because a catalog business keeps finished goods on hand.
The clinical ladder remains a more direct way to test the opportunity than funding headlines alone. Preliminary Q3 sales have accelerated, while both the margin comparison and the newly priced financing have changed since the original report. Track the count of supported therapies in Phase II and III, revenue per clinical customer and cash conversion to distinguish a temporary mix effect from a lasting shortfall in the growth thesis.
Management & Track Record
The operating team has been together since 2020–21, and its record has two halves. Stephen Gunstream and CFO Matt Lowell took Teknova public in June 2021 into a growth plan that did not arrive: 2022 guidance of $45–48M was cut to $40–42M, and 2023 guidance of $42–46M was cut to $37–40M before the year came in at $36.7M, below even the cut range. A January 2024 restructuring removed two executive roles and much of the cost base. Since then the record is cleaner. 2024 ($37.7M against $35–38M) and 2025 ($40.5M against $39–42M) landed inside guidance, 2026 has been raised, gross margin went from 19.2% in 2024 to 40.1% in Q2 2026, and free cash outflow fell from $55.5M in 2022 to $9.8M in 2025.
Telegraph Hill Partners held 70.4% of the shares in the pre-offering ownership disclosure. Its exact ownership after the offering depends on participation and the final share count. It led the July 2024 private placement at $1.24 alongside Gunstream and Lowell (together they bought 12.2M of the 12.4M shares sold), and both executives bought again on the open market on 6 March 2026 at about $2.15–2.19. Director Irene Davis, Teknova's chief operating officer until 2021 and with her husband a 6.7% holder, left the board at the 1 June 2026 annual meeting. Control cuts both ways: Telegraph Hill's support funded the recovery, and Telegraph Hill alone decides whether the company is ever sold.
Risks & What Breaks It
The growth assumption remains the central test. Revenue grew at a 2.4% compound annual rate from FY2021 to FY2025. The FY2026 guidance midpoint of $46M is 13.6% above $40.5M in FY2025, and management’s approximately $51.5M 2027 objective is 12.0% above that midpoint. Preliminary Q3 growth of 19–21% is encouraging evidence of acceleration. Sustaining that pace requires clinical programs to progress and purchases per program to rise; a lower share issue price does not itself prove those outcomes.
What forces a thesis change. Upward: a supported therapy approved, or a quarter above $14M, before the end of 2027. Downward: a cut to 2026 guidance, Clinical Solutions shrinking two quarters in a row, or the breakeven range moving up again.
Historical price and options snapshot · October 20
The October 20 chart records the recovery from the February low to the September high and the subsequent retreat. Its displayed price, moving averages and options levels predate the $5 offering. They are retained as dated market history, not current trading instructions; the original report’s reference price and the chart’s intraday price were different snapshots.
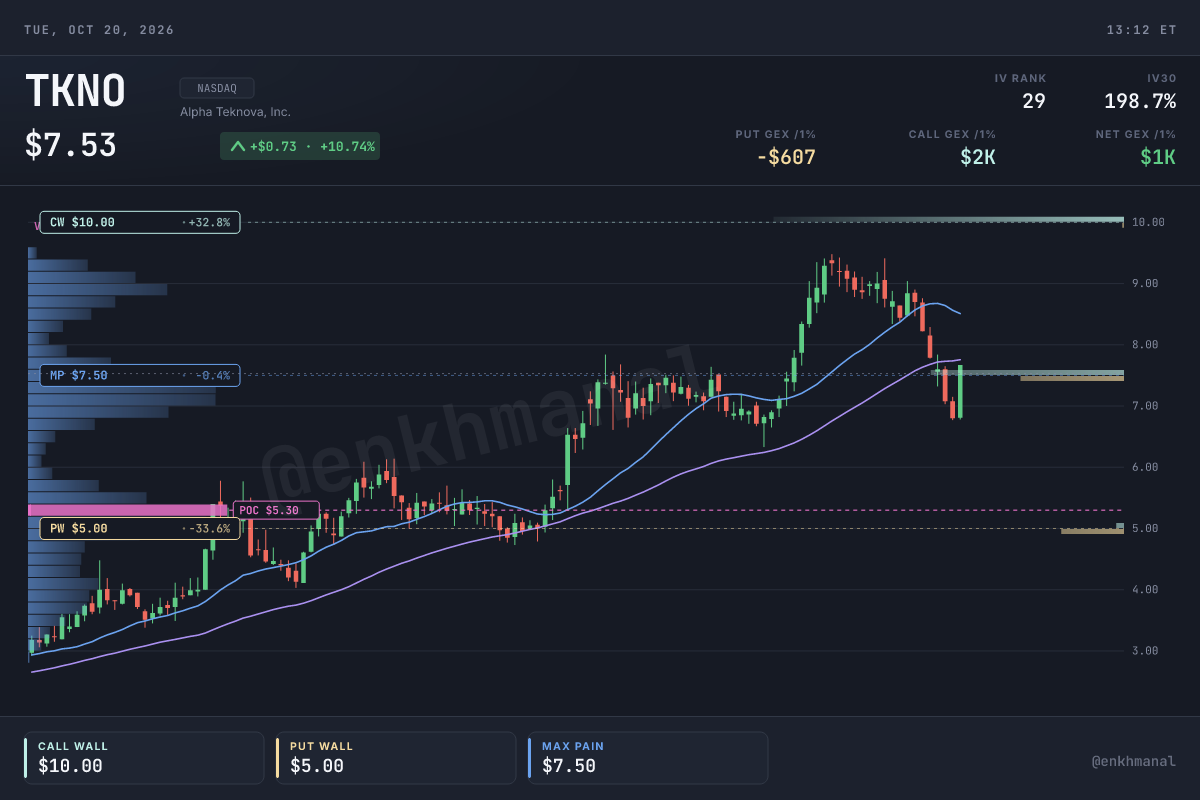
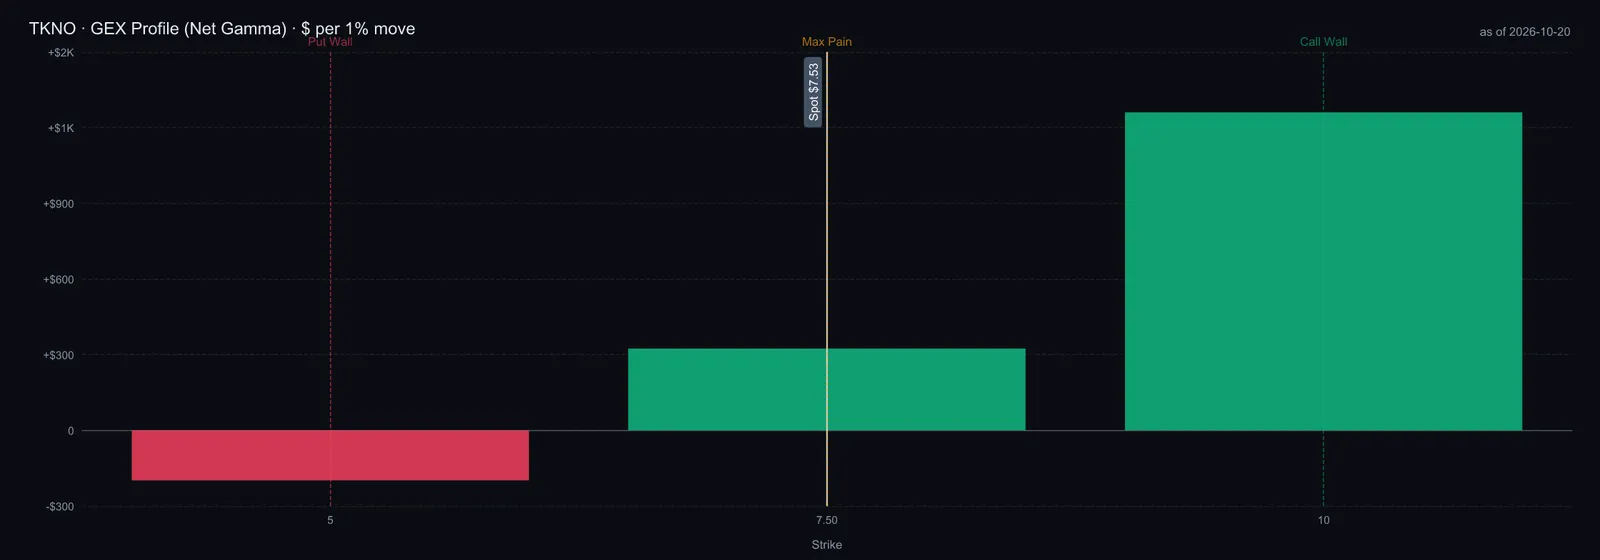
At the October 20 snapshot, the options market was small: 357 call contracts and 97 put contracts across four expirations. The plotted $10 call concentration and $5 put concentration were sentiment markers, not validated price barriers. The roughly 199% near-term implied volatility versus 96% for March also predates the offering. These historical readings cannot establish current dealer positioning or the post-offering trading range.
The next company-announced event is final Q3 results on November 4 after market close. The useful questions are whether preliminary revenue holds, why gross margin declined from Q2, how clinical-program demand is progressing and what the final financing balance looks like. Management’s first commercial therapy and first $13–14M quarter objectives remain prospective milestones for the end of 2027, rather than achieved results.
Valuation after the priced offering
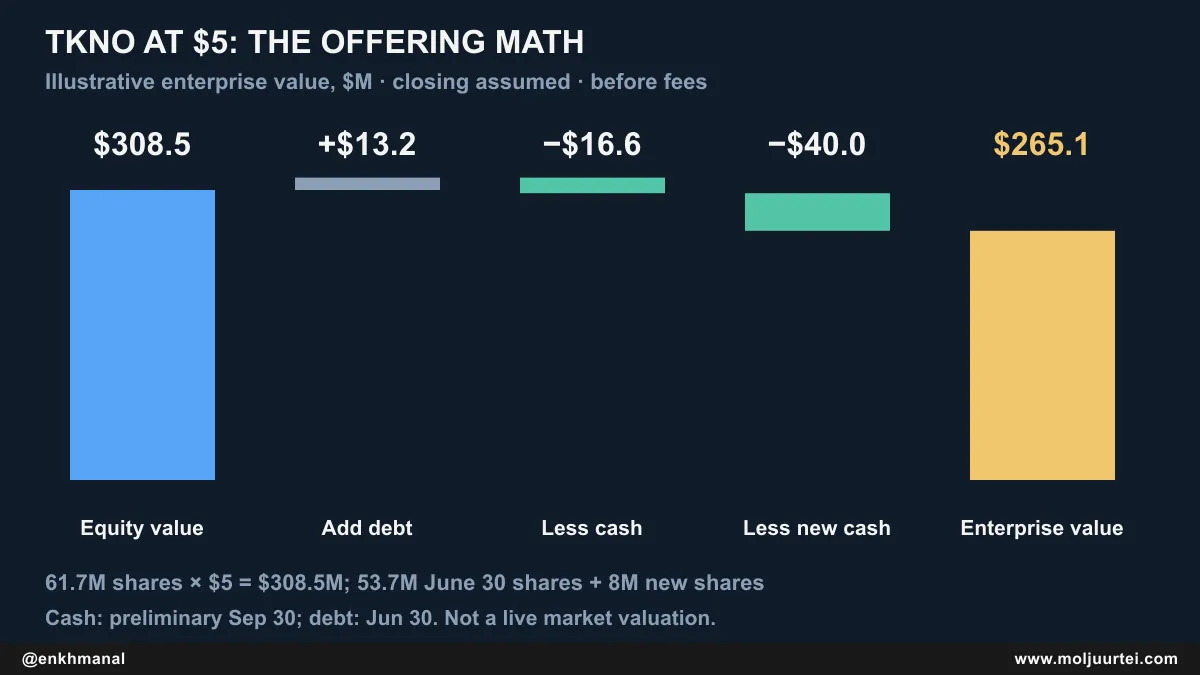
The $5 issue price materially changes the valuation reference. A transparent illustration uses the last reported June 30 basic count of 53.7M shares, adds 8M new shares and assumes the base offering closes: 61.7M shares × $5 = $308.5M equity value. Add June 30 debt of $13.2M and subtract preliminary September 30 cash and short-term investments of $16.6M plus $40M gross proceeds: enterprise value is $265.1M before fees and intervening cash use. This is 5.8× the $46M FY2026 revenue-guidance midpoint, or 5.2× management’s approximately $51.5M 2027 objective. These are illustrative offering-price multiples, not current market valuation; the dates differ, the exact current share count may differ, and option dilution, fees and later cash movements must be included in a final model.
One more anchor matters for a controlled company. Merck KGaA's $73 offer values Bio-Techne at about 9.3× revenue and about 32× trailing EBITDA, for a reagent franchise growing about 3% a year, and Merck's MilliporeSigma is one of the suppliers Teknova competes with. A buyer that wanted U.S. capacity for custom and GMP liquids would be paying for a plant it would otherwise have to build and qualify. No sale is on the table, and Telegraph Hill, which has held its stake since before the 2021 IPO, would decide one.
A cash-flow model still needs to explain the path from sales to profit. The original October 20 model used $46M revenue in 2026, about $51.5M in 2027, growth fading to 4% by 2035, gross margin approaching 50% and operating costs growing about 2.5% a year. It was highly sensitive to terminal assumptions and the treatment of $90.3M of federal tax-loss carryforwards. Its old per-share values are superseded by the priced financing and should not be treated as current targets. The operating question survives the financing: can clinical customers fill existing capacity rapidly enough for cash earnings to grow faster than the share count?
The following business-outcome scenarios retain the original sales-multiple assumptions but remove obsolete per-share returns. From the $46M FY2026 midpoint to FY2028, $68M implies 21.6% annual revenue growth, $58M implies 12.3% and $50M implies 4.3%. Multiplying those revenues by 10×, 8× and 3.5× gives hypothetical FY2028 enterprise values of $680M, $464M and $175M. These are scenarios, not forecasts or current equity targets; future cash, debt, dilution and the eventual valuation multiple determine per-share outcomes.
Teknova’s structural opportunity remains attractive: more therapies and diagnostics need small, documented, customer-specific batches, and the company can serve them in an already-built plant. Preliminary Q3 growth of 19–21% is evidence that demand is accelerating. The $5 offering can fund the path to scale and lowers the valuation reference relative to the original report, even as it dilutes percentage ownership. This supports examining the opportunity before the first commercial approval; it does not require waiting for every milestone. The decisive evidence is clinical-program progression, higher spend per customer and recovering cash margins. A persistent failure to convert growing sales into cash, repeated upward resets in break-even sales or lost clinical programs would weaken the thesis.