
$SMCI Deep Dive — The working capital behind a $65-72bn guide · into Monday's annual report
$SMCI closed Friday at $37.08, some 37% below its October high, carrying a bear case that everyone can recite and almost nobody has read. The export-control story is a real overhang and a badly mispriced one; the thing that can actually break this company is that it now has to buy roughly $60 billion of components before it is allowed to bill anyone for them.
The constraint moved from the chip to the balance sheet
For two years the binding constraint in AI infrastructure was silicon. If you could get accelerators you could sell systems, and the interesting question was allocation. That constraint has moved twice since, and both moves changed who makes money. The first move was from the chip to the system. A GB200 NVL72 is not a server; it is a 120kW liquid-cooled rack that has to be plumbed, powered, switched and managed. The unit of sale stopped being a box with a margin on it and became an integrated rack with a deployment schedule attached, which narrowed the field to firms with factory capacity, thermal engineering and the ability to be first to a new silicon platform. That is the shift Supermicro was built for, and it is why revenue went from $7.1bn in FY23 to $39.1bn in FY26.
The second move is the one the market has not repriced. Once the rack became the unit, the bottleneck jumped to the two things a supplier does not control: the customer's site, and the supplier's own balance sheet. Charles Liang named the first on the August call — June-quarter revenue came in near the bottom of the guide due to short-term customer delay in power, cooling and networking. The second is visible only in the cash flow statement, and it is larger. Fiscal 2026 consumed $6.8 billion of operating cash against $1.66bn generated in FY25, inventory closed the year at $12.9 billion, and the cash conversion cycle went from 106 days to 149 days in a single quarter. The AI server business stopped being a manufacturing business and became a working-capital business.
The market is worrying about the wrong variable
Three facts sit awkwardly together, and the awkwardness is the opportunity. First, the business is not deteriorating: FY26 revenue rose 78%, non-GAAP earnings per share went from $2.06 to $3.63, more than $60bn of new orders landed in the June quarter alone, and FY27 is guided to $65–72bn against a sell-side carrying roughly $52–54bn. Nine customers billed over $1bn in FY26 against four the year before. Second, the thing everyone is afraid of is not what they think it is: the company is not a defendant in the March 2026 indictment, is not alleged to be a co-conspirator, and states in its own filings that it has not been informed it is a target. Third, and this is the part the bulls skip, the balance sheet is now the thesis.
A business that burns $6.8bn of operating cash to grow 78% and then guides to another 75% of growth is a financing story wearing a technology costume. Supermicro has $7.5bn of cash, $8.7bn of debt, a $1.25bn at-the-market equity programme authorised and not yet drawn, and a founder-chief executive who said out loud that revenue beyond $80 billion would require more cash. At roughly 8× FY27 guidance-implied earnings and 0.42× guided sales, you are being paid to take a financing risk that is real while the market charges you for a legal risk that is mostly other people's.
Once we take between $65 billion to $72 billion, I guess our cash flow now is pretty enough. But if there are chances to grow much higher revenue, then we may need more cash flow. For example, $80 billion or beyond $80 billion.
Half the June quarter came from enterprise
The strategic frame management wants to be re-rated on is its Data Center Building Block Solutions bundle, which packages accelerated and general-purpose compute, enterprise storage, direct liquid cooling, coolant distribution units, rear-door heat exchangers, cooling towers, 1.6T switching and a management software suite into one purchase order with lifecycle services attached. Liang frames the pitch as time rather than price: customers build and scale an AI data centre in quarters rather than years. The backdrop is favourable and getting more expensive at the same time. Demand is not in question — the $60bn order book settles that. But memory is now the marginal input cost in an AI server, and NVIDIA told the market in August to expect memory prices higher into next year. NVIDIA absorbs that at a 72% gross margin. Supermicro absorbs it at 10.8%.
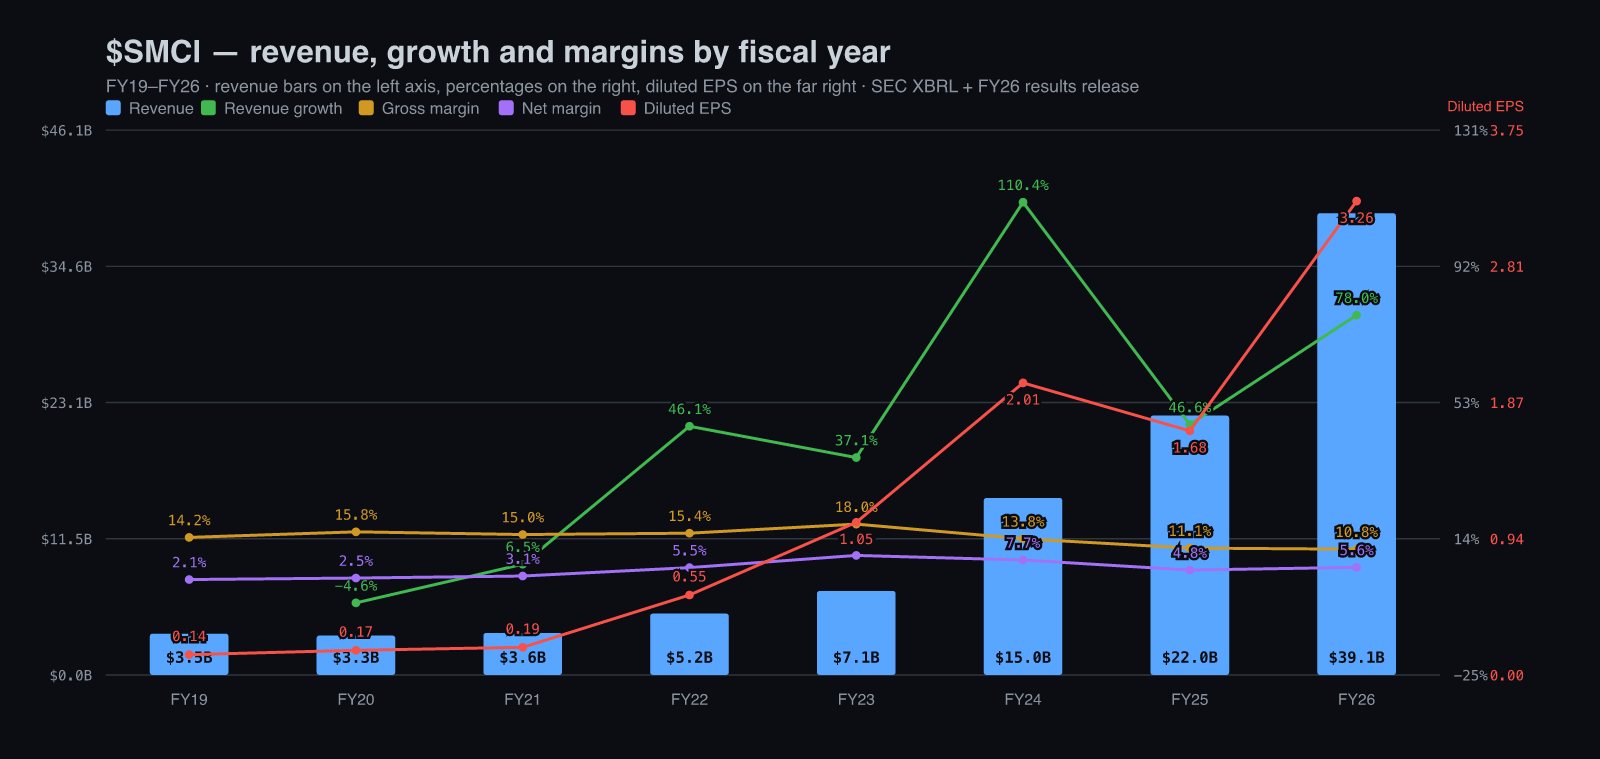
What revenue and margins have actually done: revenue is up elevenfold in seven years, and gross margin peaked before the AI ramp started and has fallen every year since. Gross margin ran 14.2% in FY19 and 15.4% in FY22, peaked at 18.0% in FY23, then fell to 13.8% in FY24, 11.1% in FY25 and 10.8% in FY26, while revenue compounded from $3.50bn to $39.10bn.
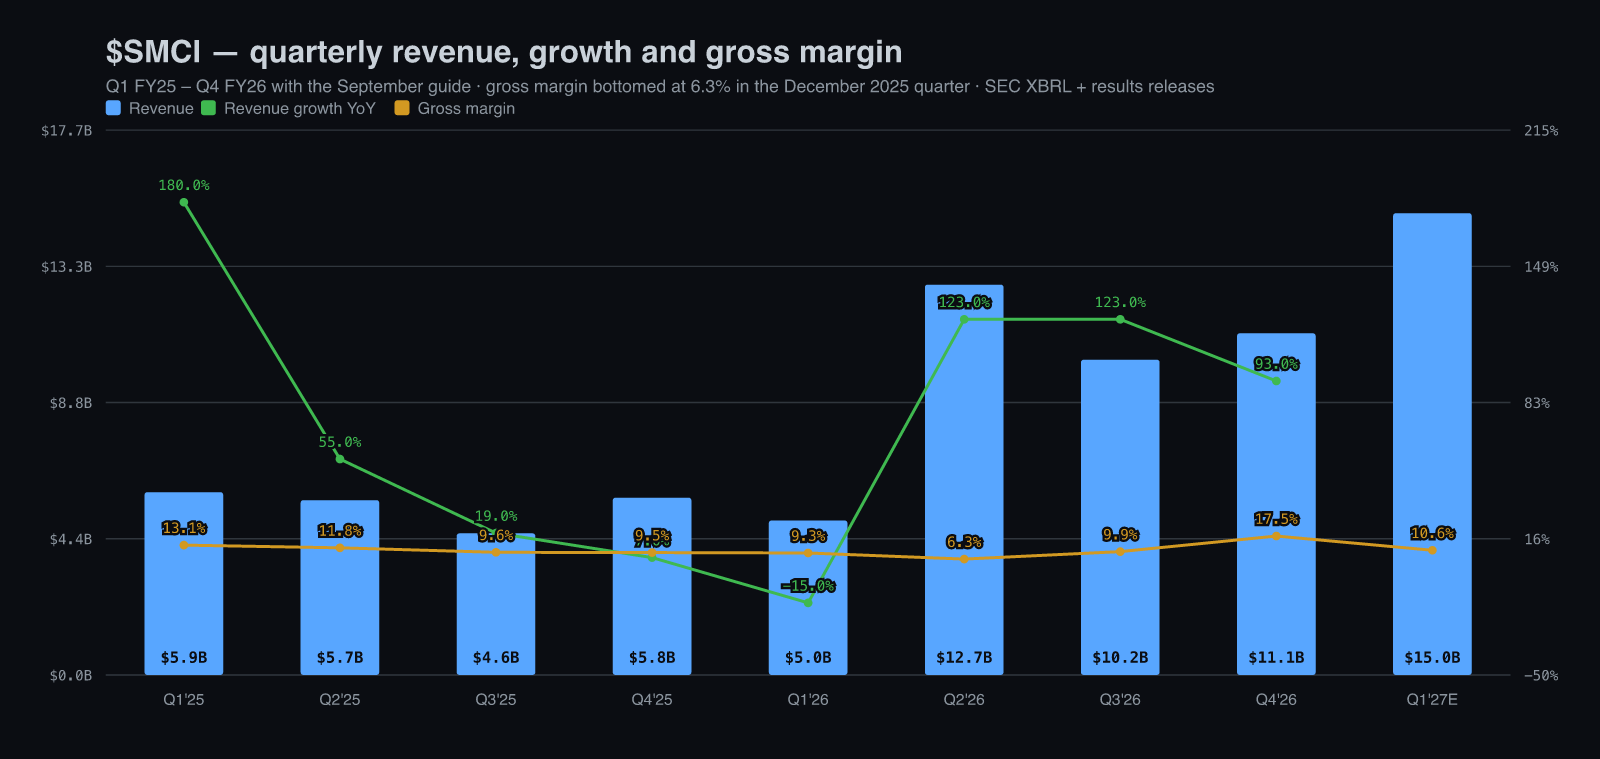
By quarter the gross margin ran 13.1% in Q1 FY25, 9.6% by Q3, 9.3% in Q1 FY26, a trough of 6.3% in Q2, then 9.9% in Q3 and 17.5% in Q4, on revenue that went from $5.94bn to $11.10bn across the same span. September is guided to 10.4–10.8%, the highest guided range in two years. The slide is real, and on this evidence it stopped nine months ago. A reader shown only the 10.8% full-year figure would not know that. The two series also have to be read together rather than in sequence: the trough quarter and the 17.5% quarter are eighteen months apart in a business whose revenue nearly doubled between them, so neither is a clean read on the underlying rate. The honest statement is a range — somewhere between the 9–10% the last two years actually delivered and the low teens the bundling pivot is supposed to produce — and the FY27 guide's silence on margin is management declining to narrow it.
The suppliers' own calls tell you why the rate is where it is. Micron's May quarter ran an 84.9% gross margin on revenue up 346%, with roughly 40% of revenue locked into take-or-pay agreements whose floor prices deliver a very robust gross margin well above Micron's peak in any past cycle and $22bn of customer deposits collected. Seagate is doing the same one layer over: a record 52.7% gross margin, the vast majority of nearline exabytes already allocated into calendar 2028, and contracts defining product configuration and pricing terms across the entirety of calendar 2027. The most useful peer is the one that missed. Vertiv sells the power and cooling Supermicro says is gating its revenue, and it missed its June quarter by 3.2% on minor timing shifts driven by multi-phase project execution and temporary supply chain dynamics — the same constraint, from the other side of it. That is corroboration that site readiness is an industry condition rather than an excuse. It is also the uncomfortable comparison: Vertiv absorbed that disruption at a 22.6% adjusted operating margin, up 410 basis points, and raised guidance. Supermicro absorbed it at 8.1%.
A time-to-first-rack moat, not a technology moat
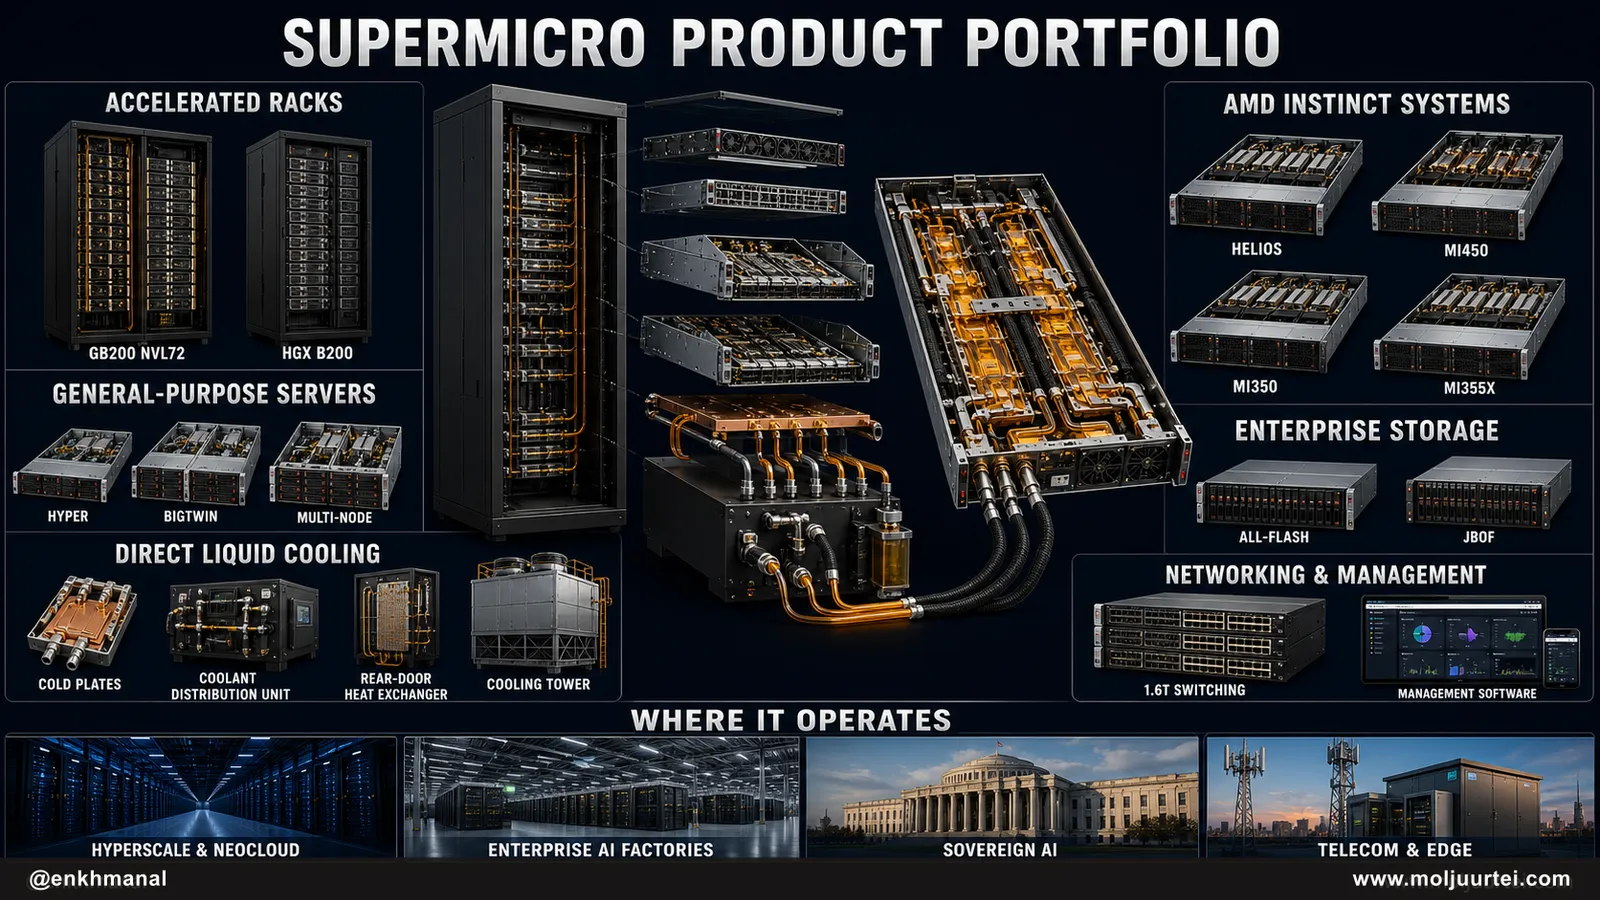
This is not really a technology moat. What Supermicro has is a time-to-first-rack advantage, built out of a modular subsystem library and a manufacturing footprint sized ahead of demand. Because most subsystems are compatible across product lines and across silicon generations, a platform transition becomes a mix shift rather than a write-down, which matters enormously with $12.9bn of inventory on the balance sheet. The observable output is platform coverage nobody else matches at speed: volume shipments across the GB200 NVL72 and HGX B200 lines, first-to-market preparation for Rubin, Vera Rubin NVL72 and the Vera processor, the Helios line and Instinct MI450 with AMD, and an Intel edge system. Direct liquid cooling turns breadth into a moat, because at 120kW per rack air cooling is not an option and liquid cooling is a plumbing-and-service competence rather than a component you buy.
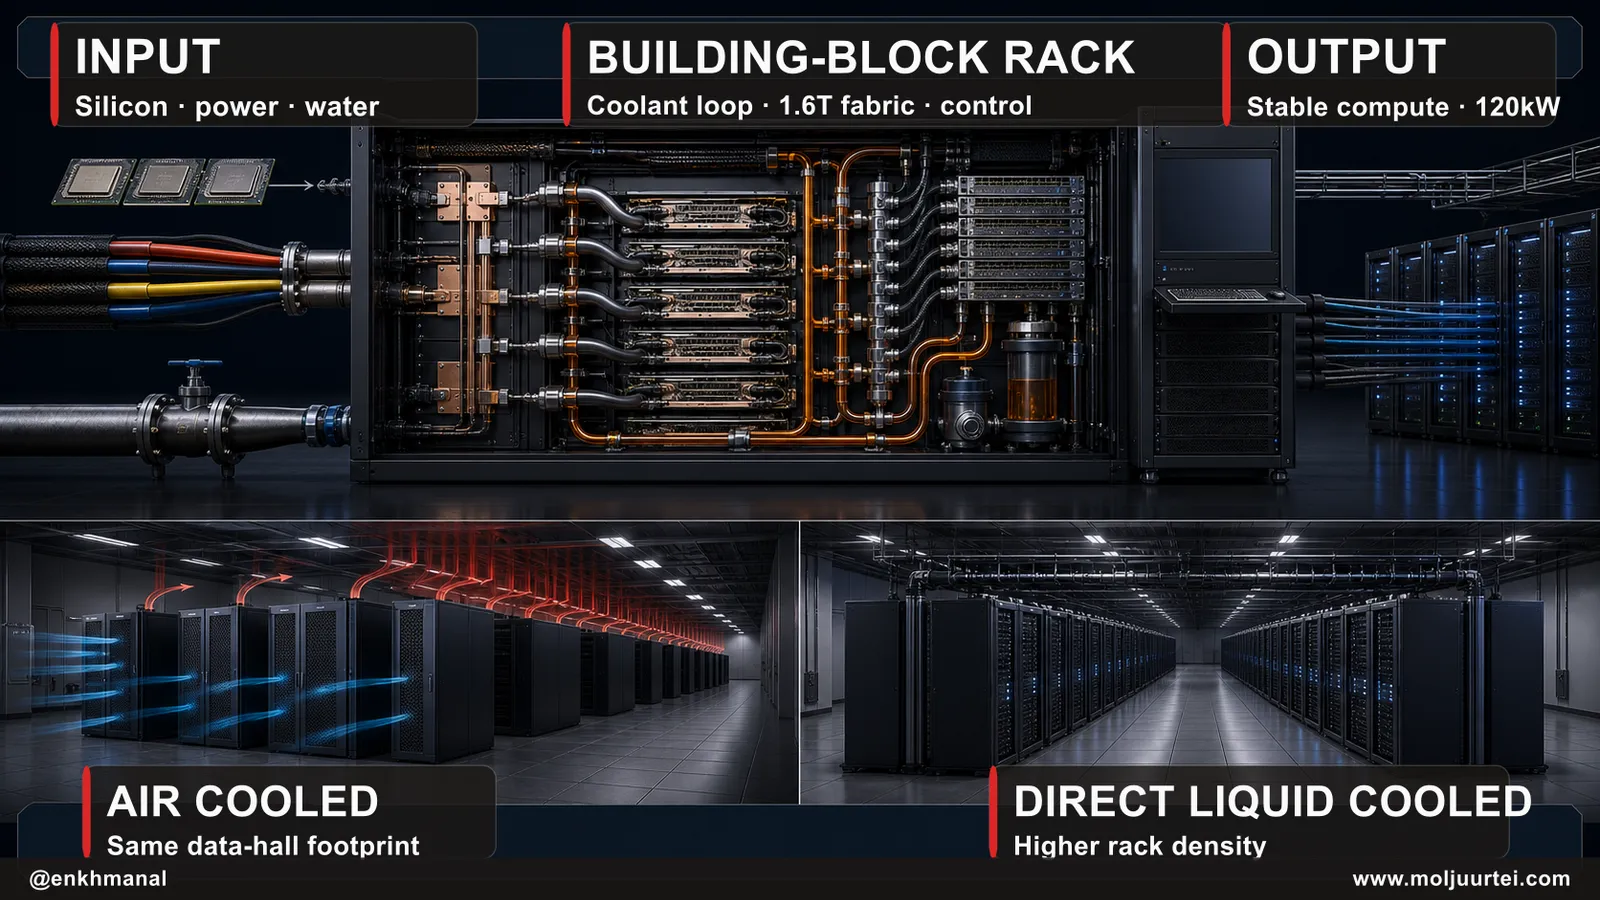
Worth stating plainly: a 10.8% full-year gross margin is the market's verdict that this is assembly rather than architecture. The bundling pivot argues that verdict is wrong, on the grounds that selling cooling, switching, software and services alongside the box changes the margin structure. The June quarter's 17.6% is the first real evidence for it, and management immediately told investors not to extrapolate it, guiding September back to 10.4–10.8%.
Selling into the bottleneck that is costing it revenue
Operating expenses are scaling faster than revenue, which is what you would expect from a company trying to climb out of the assembly bracket: non-GAAP operating expenses were $357m in the June quarter, up 49% year on year and 28% sequentially. Three roadmap items are load-bearing. The first is the move up-stack into energy and optics — Liang described the bundle as spanning compute, storage, energy, 1.6T switching, upcoming optical networking and the management software suite. Read that against his own explanation of why June revenue slipped, and the strategy resolves: Supermicro is selling into the bottleneck that is currently costing it revenue. The second is software and services as the margin lever, where a new proactive service model dispatches before a unit fails and management claims the bundle will soon contribute significant net income. The third is capacity: FY26 capital expenditure was $162m against $127m in FY25, trivially small against $39bn of revenue, which tells you the capital intensity lives in inventory rather than in plant.
Half the volume moved to enterprises, and the June raise replaced vendor financing
Supermicro reports one operating segment, so there is no segment table to read and the mix question has to be asked on the axes management actually uses. Two of them moved sharply in June, and together they are the most under-discussed part of the print.
A company that a year ago sold racks to a handful of hyperscalers now sells half its volume to enterprises, which carry better margin than a hyperscaler tender. What the disclosure will not let you do is finish the argument. Supermicro publishes no margin by customer type, so the mix story has to be tested against the margin series rather than assumed — and tested, it only half survives. The co-movement is striking: enterprise and channel went 28% → 50% of revenue in the same quarter gross margin went 9.9% → 17.5%. But management then guided September back to 10.4–10.8% and said nothing about the enterprise share falling. If a mix that is holding produced a margin that is not, mix is not the whole explanation, and something non-recurring sits inside that 17.5%. Which makes the September gross margin, read against the enterprise share disclosed beside it, the most informative pair of numbers in the next print — and the reason the mix cut belongs in the memo rather than in a footnote.
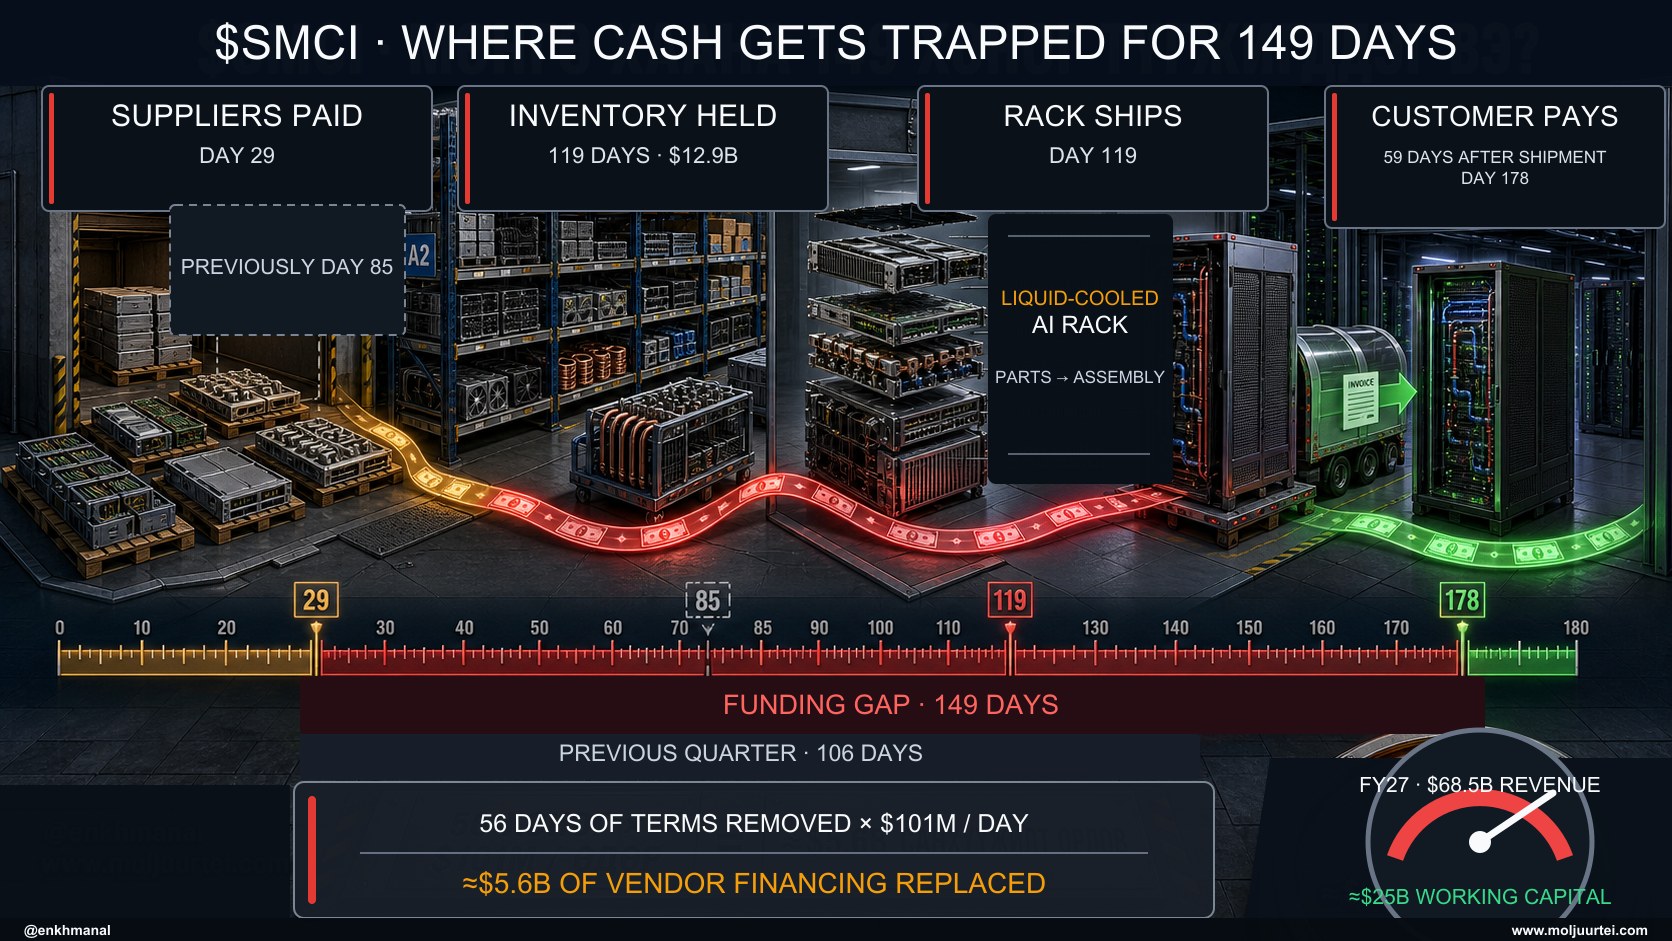
Here is the arithmetic almost nobody has run. In the June quarter days payable outstanding fell from 85 days to 29 — a 56-day withdrawal of supplier credit. Cost of goods sold for the quarter was roughly $9.2bn, or about $101m per day. Fifty-six days of that is approximately $5.6bn. Supermicro raised $5.6bn net in the same quarter. That is an arithmetic coincidence rather than a proven causal identity — the company says the proceeds fund components against new orders, and inventory did rise $1.8bn — but the size match is the point. The June raise was in substantial part the replacement of vendor float that suppliers pulled. Suppliers in a shortage do not extend 85-day terms to everyone; they extend them to whoever they must. Losing that float is what a supply chain does when it stops needing you as much as you need it.
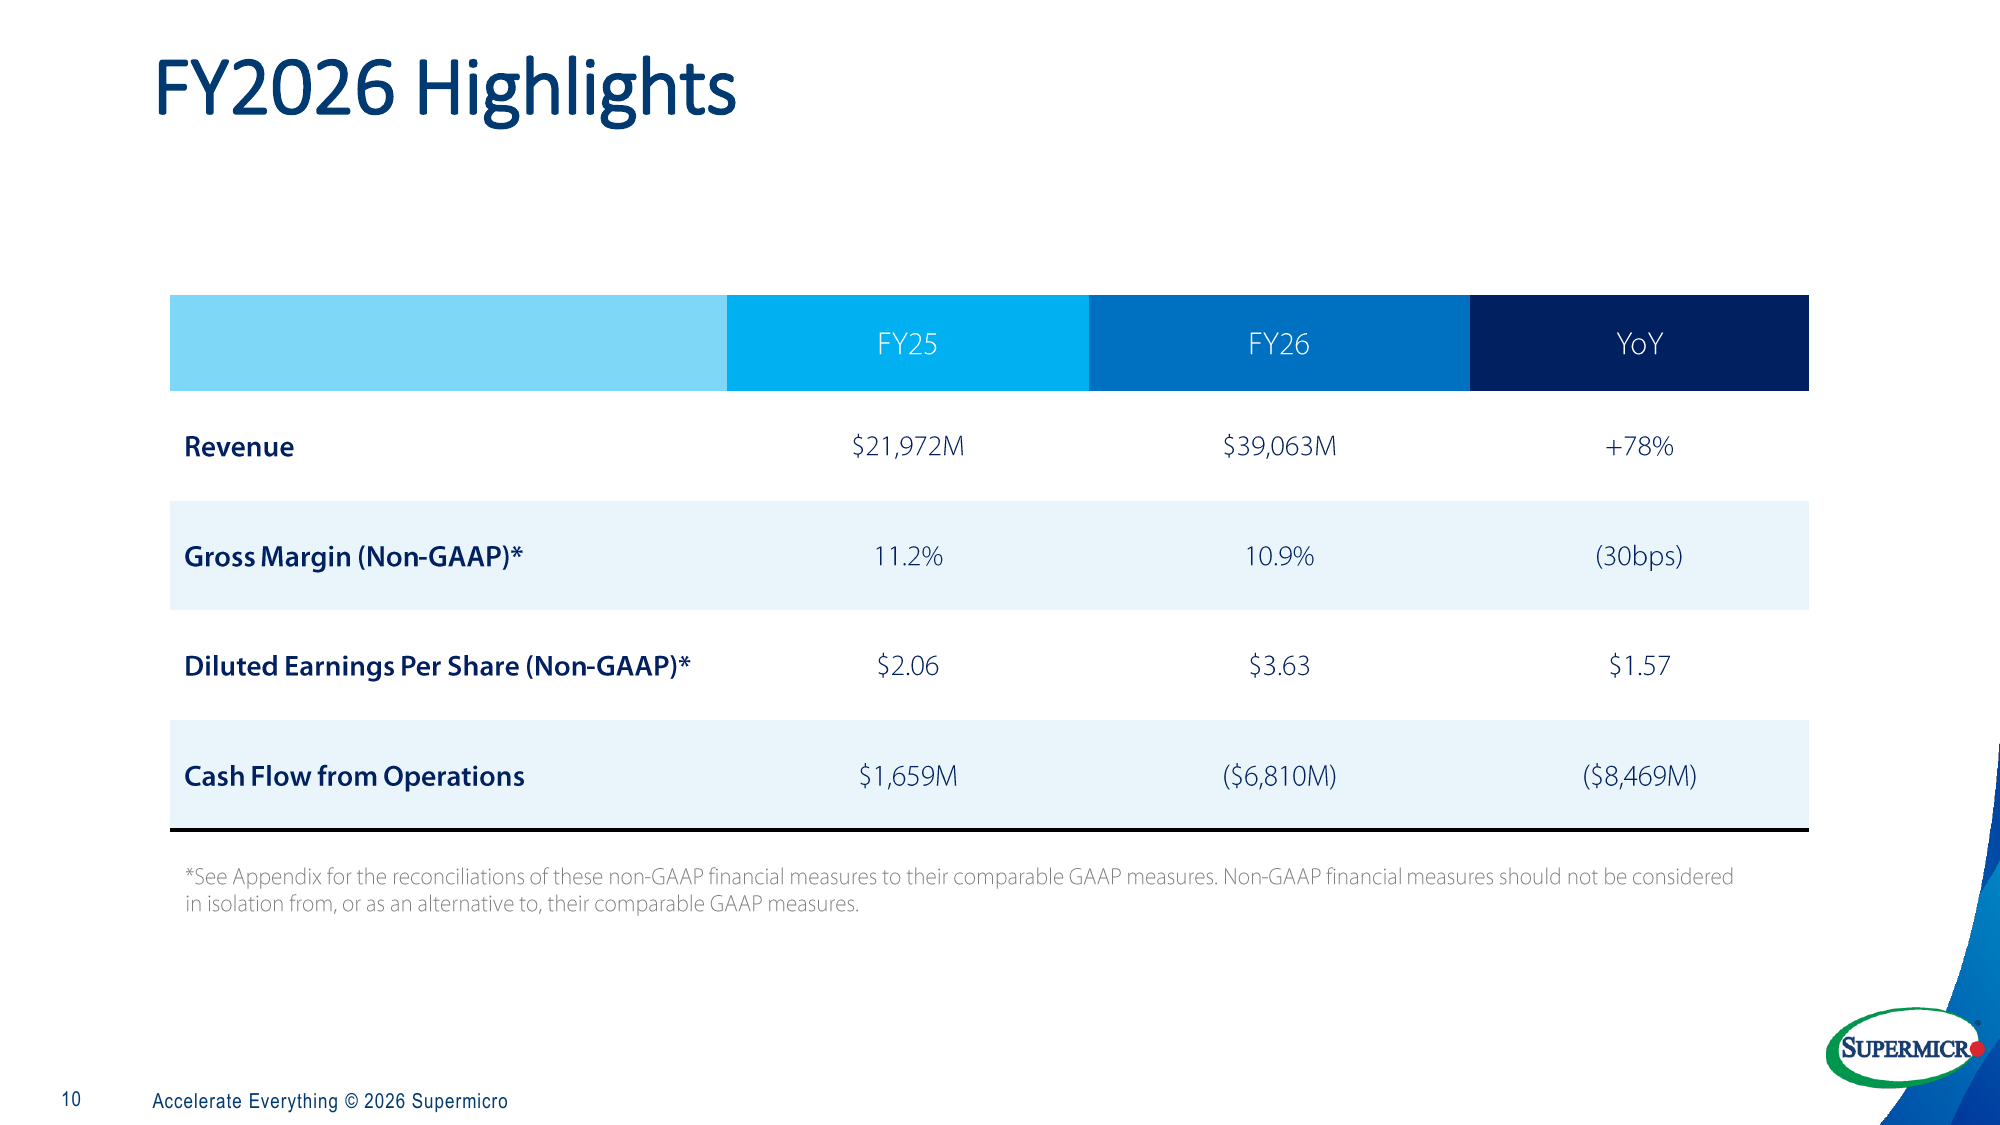
One absence in that deck is worth naming. The outlook slide guides FY27 revenue of $65 to $72bn and gives quarterly earnings per share, and it does not guide full-year gross margin at all. For a company whose entire re-rating case is margin, declining to guide the number is itself information.
And it has happened twice before. Supermicro's operating cash flow alternates with its growth rate, and the pattern is in the filings: −$441m in FY22, +$664m in FY23, −$2.5bn in FY24, +$1.7bn in FY25, −$6.81bn in FY26. It burns cash in the years it grows fastest and collects it in the years it does not. FY25 converted 128% of EBITDA into operating cash flow; FY24 converted −200%, on an accrual ratio of 53.9% of average assets — the widest gap between reported profit and cash in the company's public life until this year.
That reframes the risk rather than removing it. This is how the model works, not a break in it, which is the strongest thing the bulls have. What is new is amplitude: each burn is larger than the last and scales with revenue, so at a $65–72bn guide the next one is bigger again, and the equity programme is what absorbs it.
Now scale it. At the FY27 guide midpoint of $68.5bn and roughly 89% cost of sales, daily cost of goods runs near $167m. Hold the cash conversion cycle at 149 days and the business needs on the order of $25bn of net working capital, against $7.5bn of cash, an undrawn $1.25bn equity programme and $8.7bn of debt already outstanding. Management's answer is that the cycle improves, because the backlog carries improved terms. So the mispricing is not that the market is wrong to worry — it is that the market is worrying about the wrong variable. The consensus bear case is fraud; the actual bear case is terms. And terms are observable every ninety days in a single line item, which makes this one of the more cheaply monitorable risks in large-cap technology. If payables days recover toward 50 to 60 and inventory days fall as the deferred contracts ship, the FY27 guide funds itself and the stock is absurdly cheap. If payables stay at 29 days, the equity programme gets drawn and holders are diluted into a rising revenue line.
A pedigree is not a track record
Charles Liang founded Supermicro in 1993 and has been chairman and chief executive throughout. The operating record is exceptional: $3.3bn of revenue in FY20 to $39.1bn in FY26, first to market on essentially every accelerator generation, and a manufacturing organisation that scaled 78% in a year without a capital-expenditure cycle. The governance record is the other half. This team has now presided over two separate filing-delinquency episodes: FY2017 to FY2019, which ended in a restatement and an annual report filed 626 days late, and FY2024, which brought a late-filing notice, the resignation of Ernst & Young as auditor in October 2024, and an annual report filed nearly six months late.
The single hardest fact in the file is one the company discloses itself. Yih-Shyan Wally Liaw, a co-founder, resigned from all positions including the board in January 2018 during a period when the company was not current in its filings and following an Audit Committee investigation, as part of remediating material weaknesses in internal control. He returned as a consultant in May 2021, rejoined as senior vice president of business development in August 2022, and was re-appointed to the board in December 2023. In March 2026 he was indicted. A board that returned a former executive to its own boardroom five years after he left during an accounting remediation made a judgement call and got it wrong. Against that, the auditor BDO USA issued a clean opinion on the FY25 financial statements, the FY25 annual report was filed a day early, and management remediated the manual journal-entry material weakness during the year.
Four threads, discussed as one
Thread one, accounting, is largely closed: an August 2024 short report, a Special Committee investigation, the auditor's resignation and a late FY2024 filing — but every periodic report since has been on time and the opinion on the numbers is clean. Thread two, internal control, is open: as of 30 June 2025 management concluded internal control over financial reporting was not effective, with four unremediated material weaknesses covering information-technology general controls, segregation of duties, completeness and accuracy of information produced by the entity, and documentation of controls over the timely identification and disclosure of new related-party transactions. The auditor issued an adverse opinion on internal control alongside its clean opinion on the financial statements.
The Company has not been informed that it is the target of any of these investigations, but if we become the target of any of these investigations, the Department of Justice could pursue civil or criminal enforcement actions against us.
Thread three is export controls. On 19 March 2026 the Southern District of New York unsealed an indictment of three individuals then employed by or associated with the company, including co-founder Wally Liaw, for alleged conspiracy to commit export-control violations. Flowing from it: a Securities and Exchange Commission subpoena, a grand jury subpoena covering the compliance programme and internal controls, further subpoenas from two other districts predating the indictment, and at least two subpoenas from the Commerce Department's export-enforcement arm. On 27 August 2026 Bloomberg reported that the same agency is examining freight forwarder Apex Logistics, a Kuehne+Nagel unit, over 47 shipments from 2024 including whether it moved Supermicro-built systems to China — where the alleged mislabelling is attributed to two former Apex employees, not to the manufacturer. Thread four is the board's own internal review, which remains ongoing and is not yet concluded, and which the company says may or may not identify material deficiencies.
What Monday tests. The FY2026 annual report is due 31 August. Supermicro's own filing history is the base rate and it is bimodal: 626 days late for FY2017, no separate FY2018 filing, 112 days late for FY2019, then on the deadline in FY2020 and FY2022, three days early in FY2021, one day early in FY2023 and FY2025, and nearly six months late for FY2024. Critically, in 2024 the company pre-announced the delay in a current report before filing its late-filing notice. As of Friday's close no late-filing notice and no delay announcement had been filed. Three things resolve at once in Monday's document: whether it arrives on time, whether internal control is now effective, and whether the internal review's conclusion appears. It is the cheapest information event on this name all year.
What breaks it
Pinned between a call wall and a filing deadline
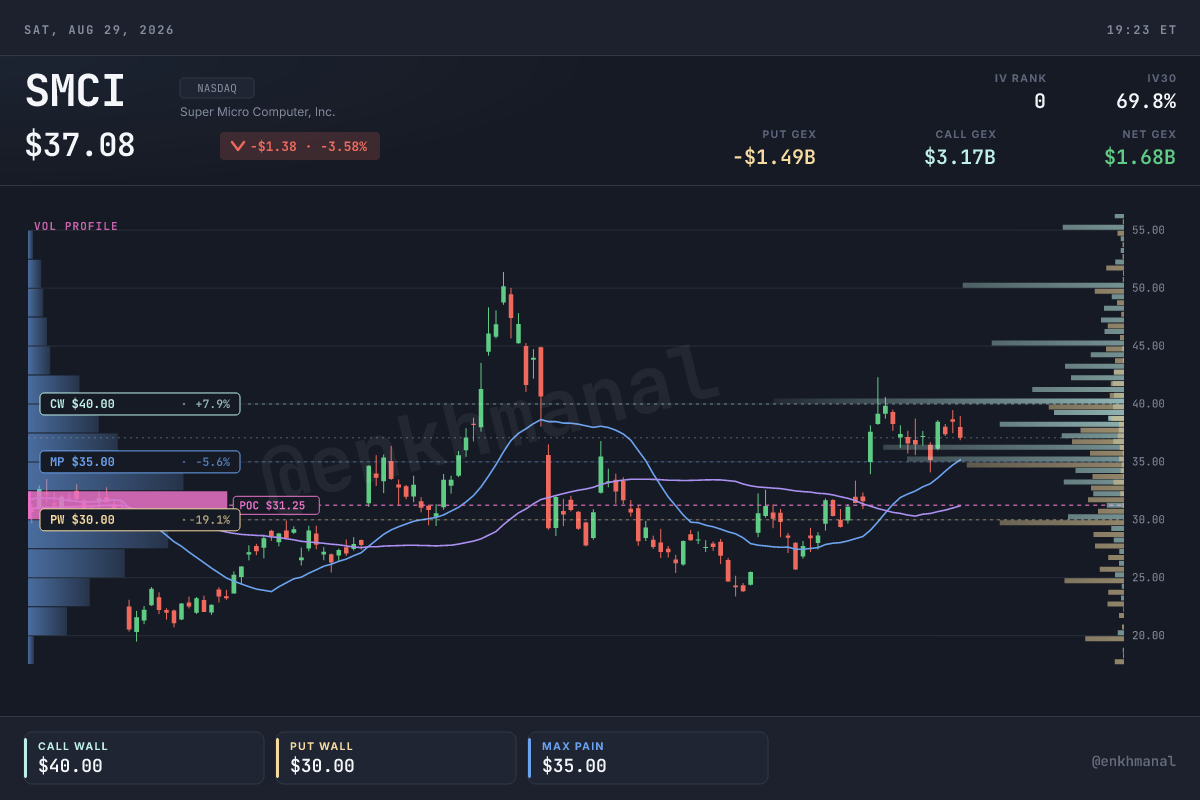
Price closed Friday at $37.08, down 3.6% on the day, above the 20-day ($35.17), 50-day ($31.21), 100-day ($31.93) and 200-day ($31.34) averages with a 14-day relative-strength reading near 63. The 52-week range is $20.53, set on 20 March — the day after the indictment was unsealed — to $58.68 on 8 October 2025. Shares sit 37% below that high and 81% above the low.
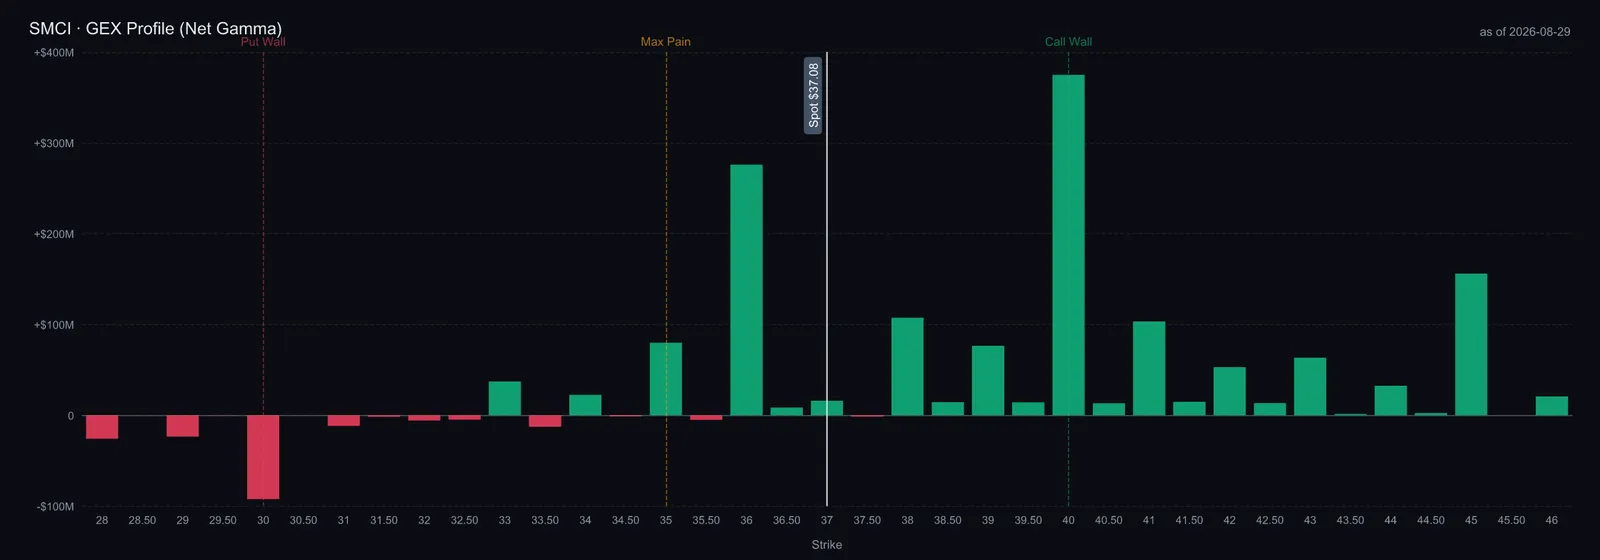
The dealer map is the more useful read. On the 28 August snapshot, computed off the prior session's $38.45 spot, net gamma exposure is strongly positive at $4.58bn with a call wall at $40, a put wall at $30, maximum pain at $35 and put-to-call open interest of 0.86 across 18 expirations. Positive net gamma means dealers hedge against the move, so the mechanical expectation is compression inside roughly $35 to $40 until something forces a repricing. Front-month implied volatility sits near 64 to 70%, rising to 78% for the November expiry that spans the next print. That is a market positioned for a range into a week containing an annual report, a competitor's earnings and two conferences: a clean filing has to fight through $40 of dealer supply, and a bad one has an air pocket to $30.
Eight times a guide the sell-side does not carry
Start from the company's own share count. The first quarter of FY27 is guided on 745m GAAP and 761m non-GAAP fully diluted shares. At $37.08 that is roughly $27.6bn of diluted market capitalisation; with $8.7bn of debt against $7.5bn of cash, enterprise value is about $28.8bn — 0.40 to 0.44 times the FY27 revenue guide for a business growing 75%. The first-quarter non-GAAP guide of $1.01 to $1.10 on 761m shares implies roughly $800m of quarterly non-GAAP net income on $15bn of revenue, a 5.3% net margin; hold that through a $68.5bn year and FY27 non-GAAP earnings land near $4.50 a share, or about eight times forward earnings. Sell-side consensus in mid-August was a hold across 16 analysts with a $42.38 mean target — 14% above Friday's close and well below the arithmetic the company's own guidance implies. Markets do not pay for revenue that has to be pre-funded, and they do not pay for governance uncertainty. The question is whether eight times adequately compensates both, and I think it does.
The level only means something against the history. On trailing GAAP earnings Supermicro sits at 19.4 times against a five-year median of 20.7, the 44th percentile of its own range: squarely mid-range, neither distressed nor expensive. Dell is at 36.4 times against an 18.0 median, the 93rd percentile of its own range, and HPE at 48.0 against 15.3, the 98th. Both peers sit at or near the top of their five-year ranges while Supermicro does not.
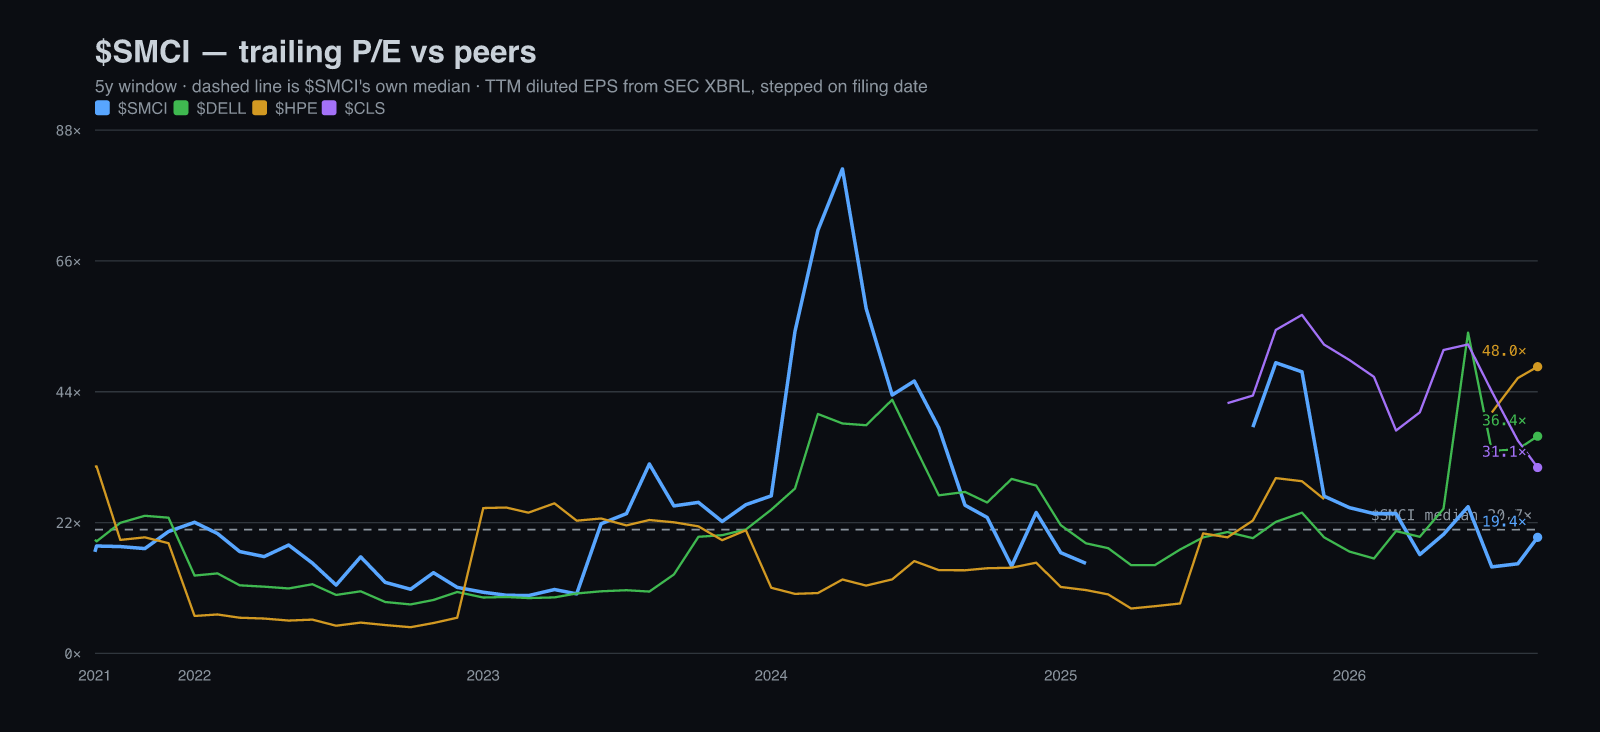
Two caveats on that 19.4 times. It is trailing, and the twelve months it trails exclude the June quarter, which was reported on 11 August but does not enter the XBRL record until Monday's annual report; on FY26's actual $3.26 of GAAP earnings the multiple is closer to 11 times. And a trailing PEG of 0.35, on a realised 55.7% earnings growth rate, is either an opportunity or a warning that the growth rate is not repeatable. This memo's answer is that the guide says repeatable and the balance sheet says expensive to repeat.
House view: buy it, size it for the balance sheet rather than the headline, and treat Monday as the trigger rather than the thesis. The setup is asymmetric because the two risks resolve on different clocks. The governance risk is binary and imminent, and there is no delay notice on file as of Friday; the financing risk is gradual and shows up in one observable line every ninety days, so if it does not recover you will see it before it hurts you. What would make me wrong, in order: payables days staying near 29 into the first quarter, a September gross margin below 10%, an annual report that repeats 'not effective', or the company moving from witness to target. What would make the position work is duller than the bull case usually is — terms normalising, the deferred contracts shipping, and a filing that is simply unremarkable.