Shipping — exceptional freight meets an expanding orderbook
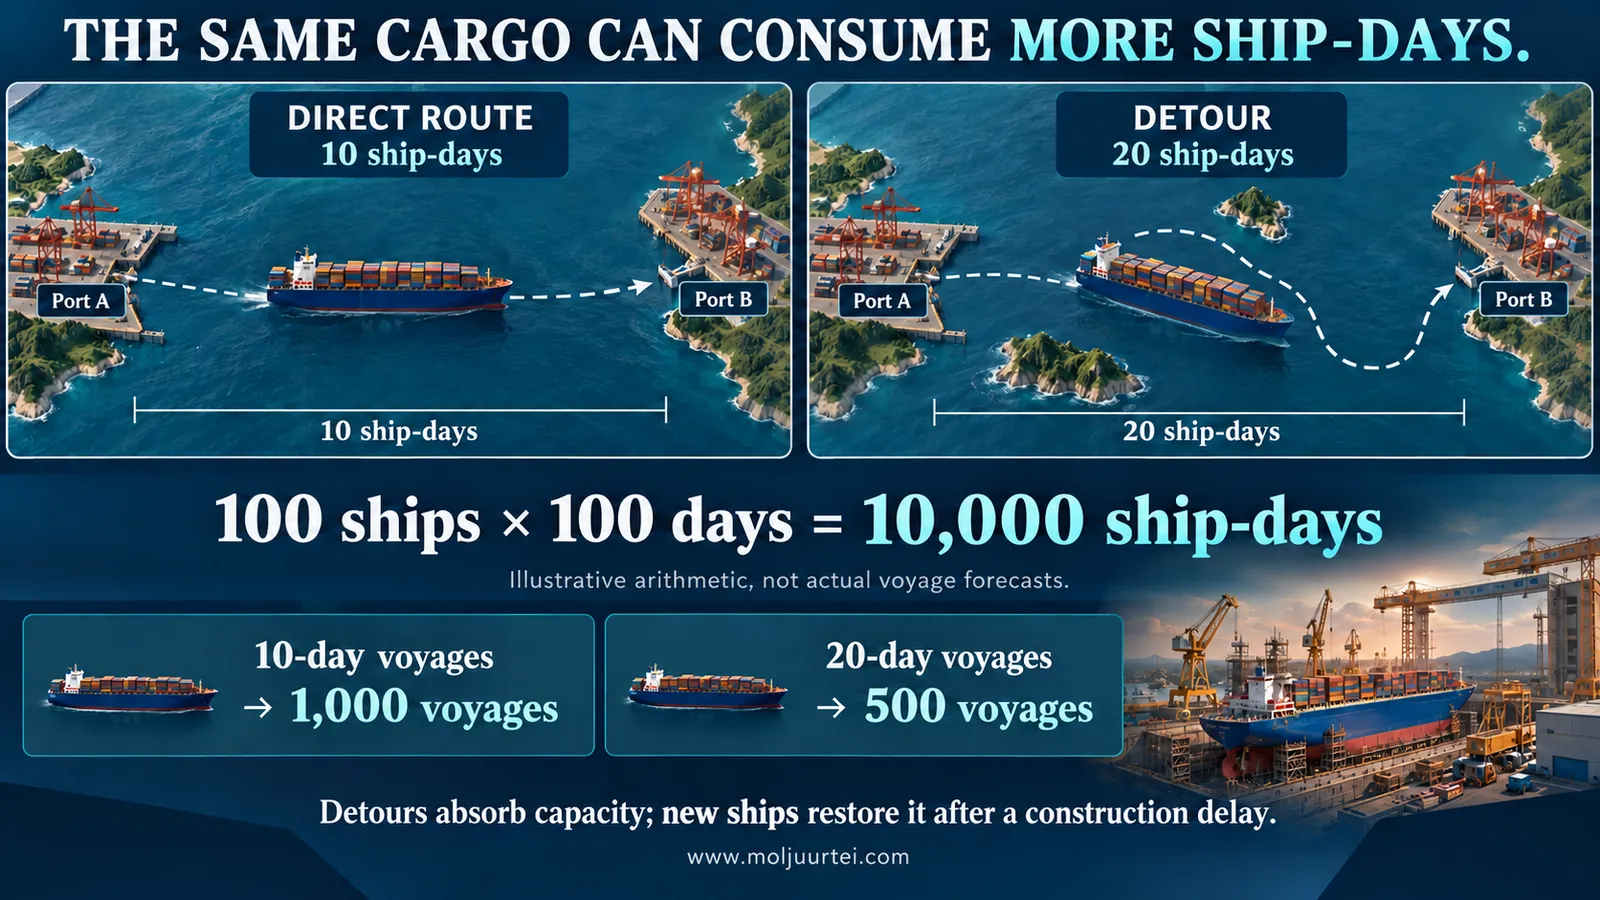
A ship moves cargo, but the scarce resource its owner sells is time. A fleet of 100 ships available for 100 days supplies 10,000 ship-days. If each voyage consumes 10 days, it can complete 1,000 voyages; at 20 days, only 500. This simplified example holds cargo size, speed and utilisation constant. Real capacity also depends on loading, waiting, ballast voyages, maintenance and insurance. That is why a fleet can become effectively smaller without losing a single hull.
Ton-miles combine the amount of cargo with the distance it travels. Longer routes can lift demand for ship-days even when cargo volumes fall. The investment question is whether that extra work lasts long enough for owners to recover the price paid for their ships and equity. Modern, efficient fleets can capture exceptional cash flows now; newbuild deliveries, route normalisation and weaker end demand can later reverse them. The same logic does not describe every company in this basket: Golar sells liquefaction capacity, while ZIM also carries a takeover outcome.
What Changed — September evidence replaces the August snapshot
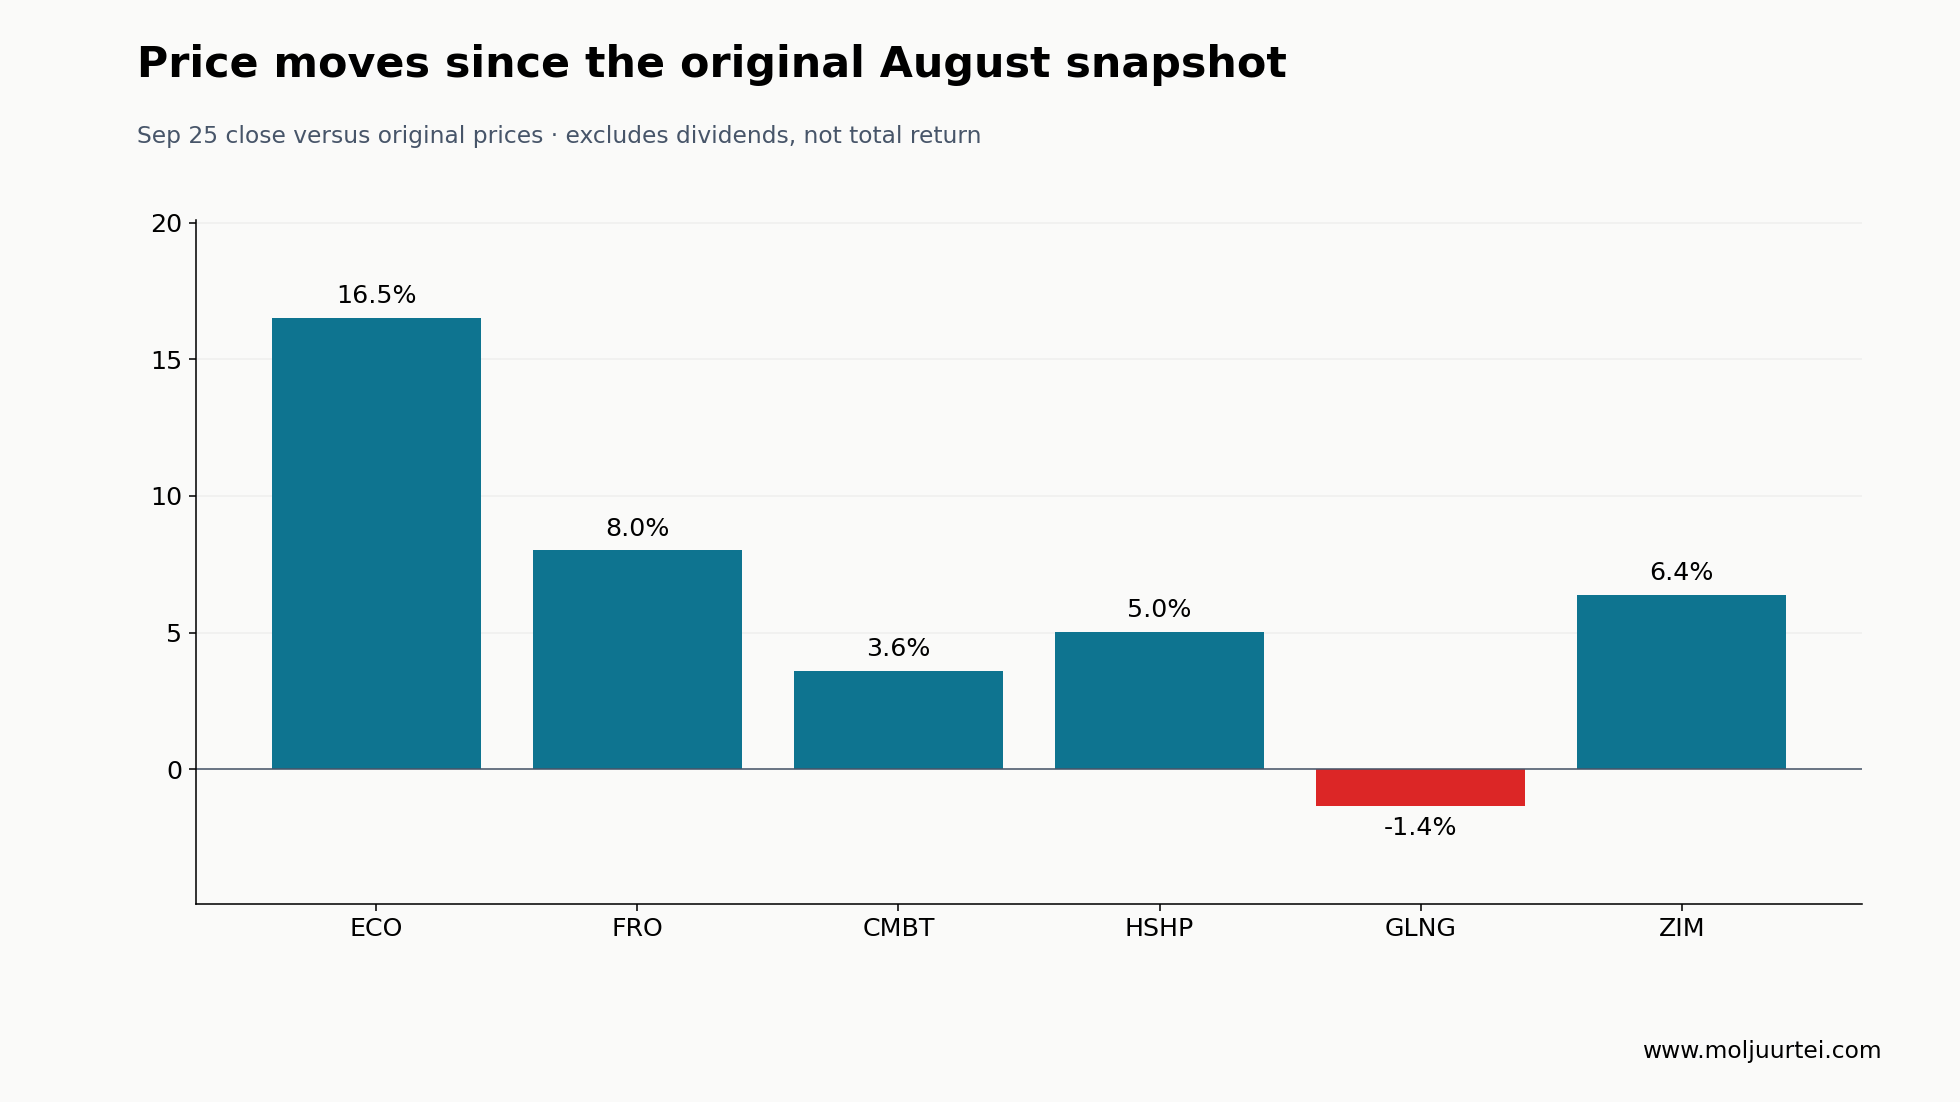
The September 25 closes are ECO $77.90, FRO $47.73, CMBT $19.01, HSHP $17.54, GLNG $49.61 and ZIM $29.19. Since the original August price references, those moves are +16.5%, +8.0%, +3.6%, +5.0%, −1.4% and +6.4%, respectively, excluding dividends. The earlier claim that the equity rerating was already finished was too categorical. The stronger question is how much sustained earning power today’s prices require.
Three new pieces of evidence matter. Frontline’s September presentation puts VLCC orders at 33.2% of the existing fleet, alongside an old and partly sanctioned fleet that cannot be treated as fully interchangeable supply. Himalaya’s September presentation shows that long charter duration still leaves earnings linked to freight indexes. September reporting on ZIM describes a revised Israeli approval framework, not completed approval. Golar’s backlog also needs separation by accounting measure and project start date; the old single $17B EBITDA label was not defensible.
Thesis — different sources of persistence
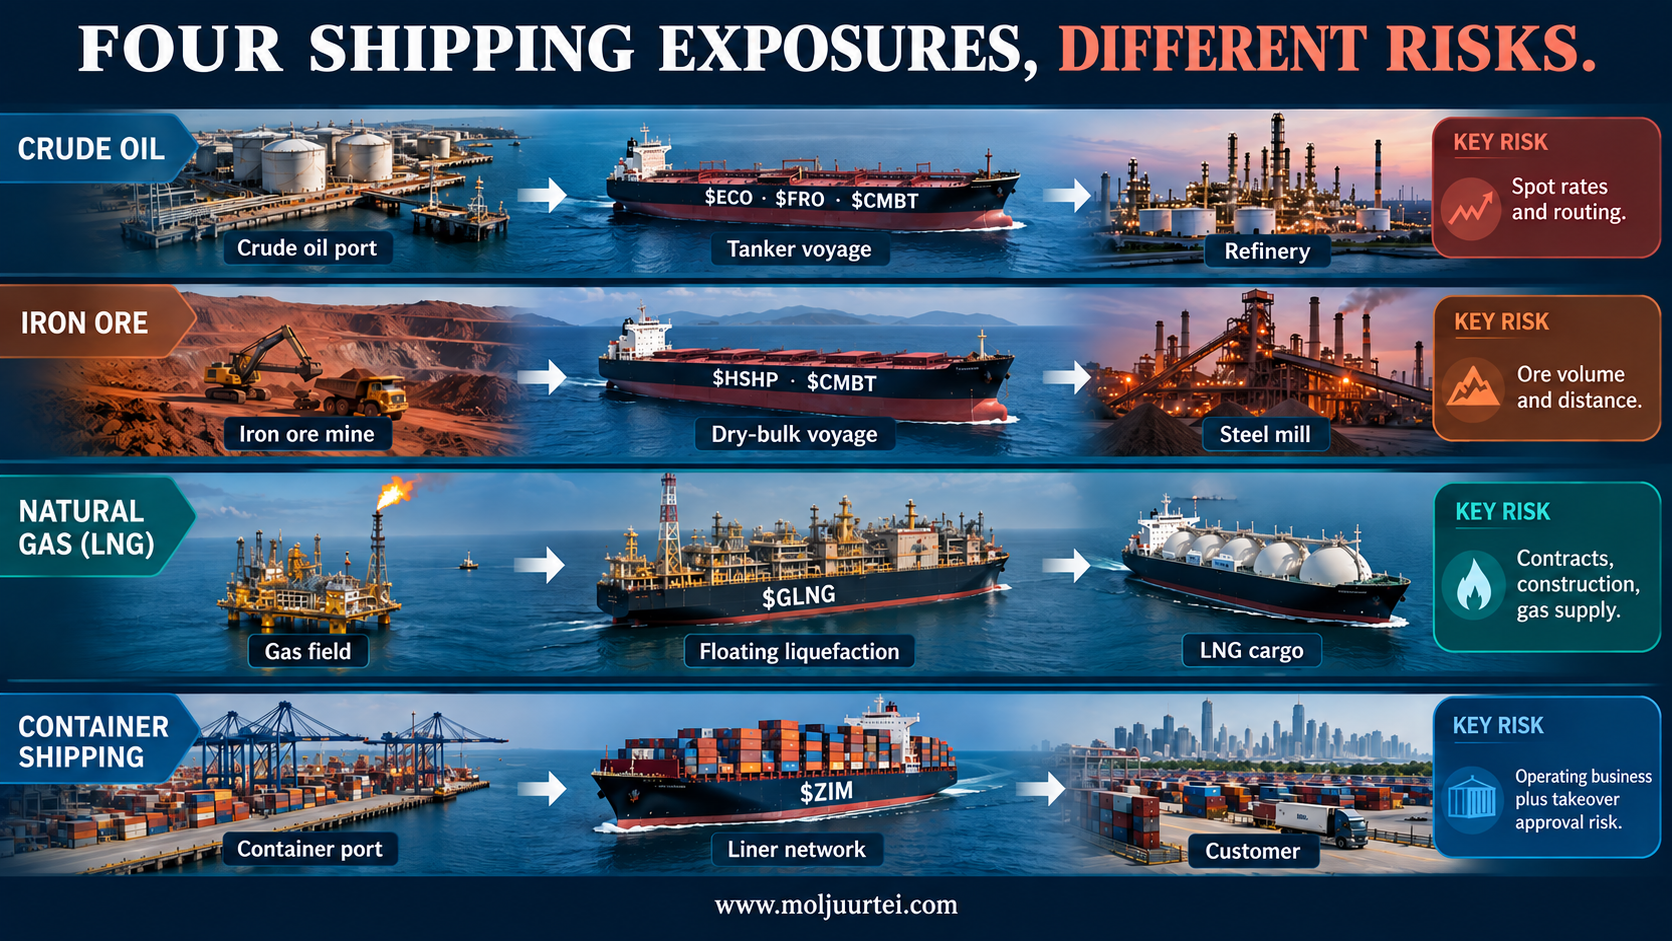
The opportunity is the mismatch between freight work that changes quickly and ships that take years to deliver. Tankers can earn extraordinary cash while unsafe routes, waiting and replacement supply routes consume capacity. Dry bulk has an additional distance driver from West African ore. Floating LNG converts gas resources into contracted processing income. These mechanisms deserve separate underwriting; buying six tickers does not automatically diversify the common exposure to capital spending, credit conditions and global trade.
Our ranking is conditional. ECO and FRO offer the most direct tanker-rate exposure; HSHP offers concentrated dry-bulk exposure with financial leverage; CMBT combines segments and asset trading; GLNG offers more contracted income but substantial construction and funding risk; ZIM is an operating liner with a merger spread. GLNG is a different kind of exposure, not automatically the cheapest or safest. Waiting for perfect confirmation may sacrifice strong cash distributions and further price gains, but assuming peak freight is permanent can be equally expensive. No position size or prior investor holding is assumed here.
Backdrop — physical capacity and usable capacity
The industry entered this period after years of limited tanker ordering. Red Sea diversions then lengthened voyages; Black Sea disruption complicated exports; restrictions around Hormuz impaired access to Gulf cargoes. These are different constraints. The Cape of Good Hope can replace a Suez transit at the cost of time and fuel. It cannot provide a sea exit for oil trapped inside the Persian Gulf. Pipelines, inventories and ship-to-ship transfers help, but none is an unlimited substitute.
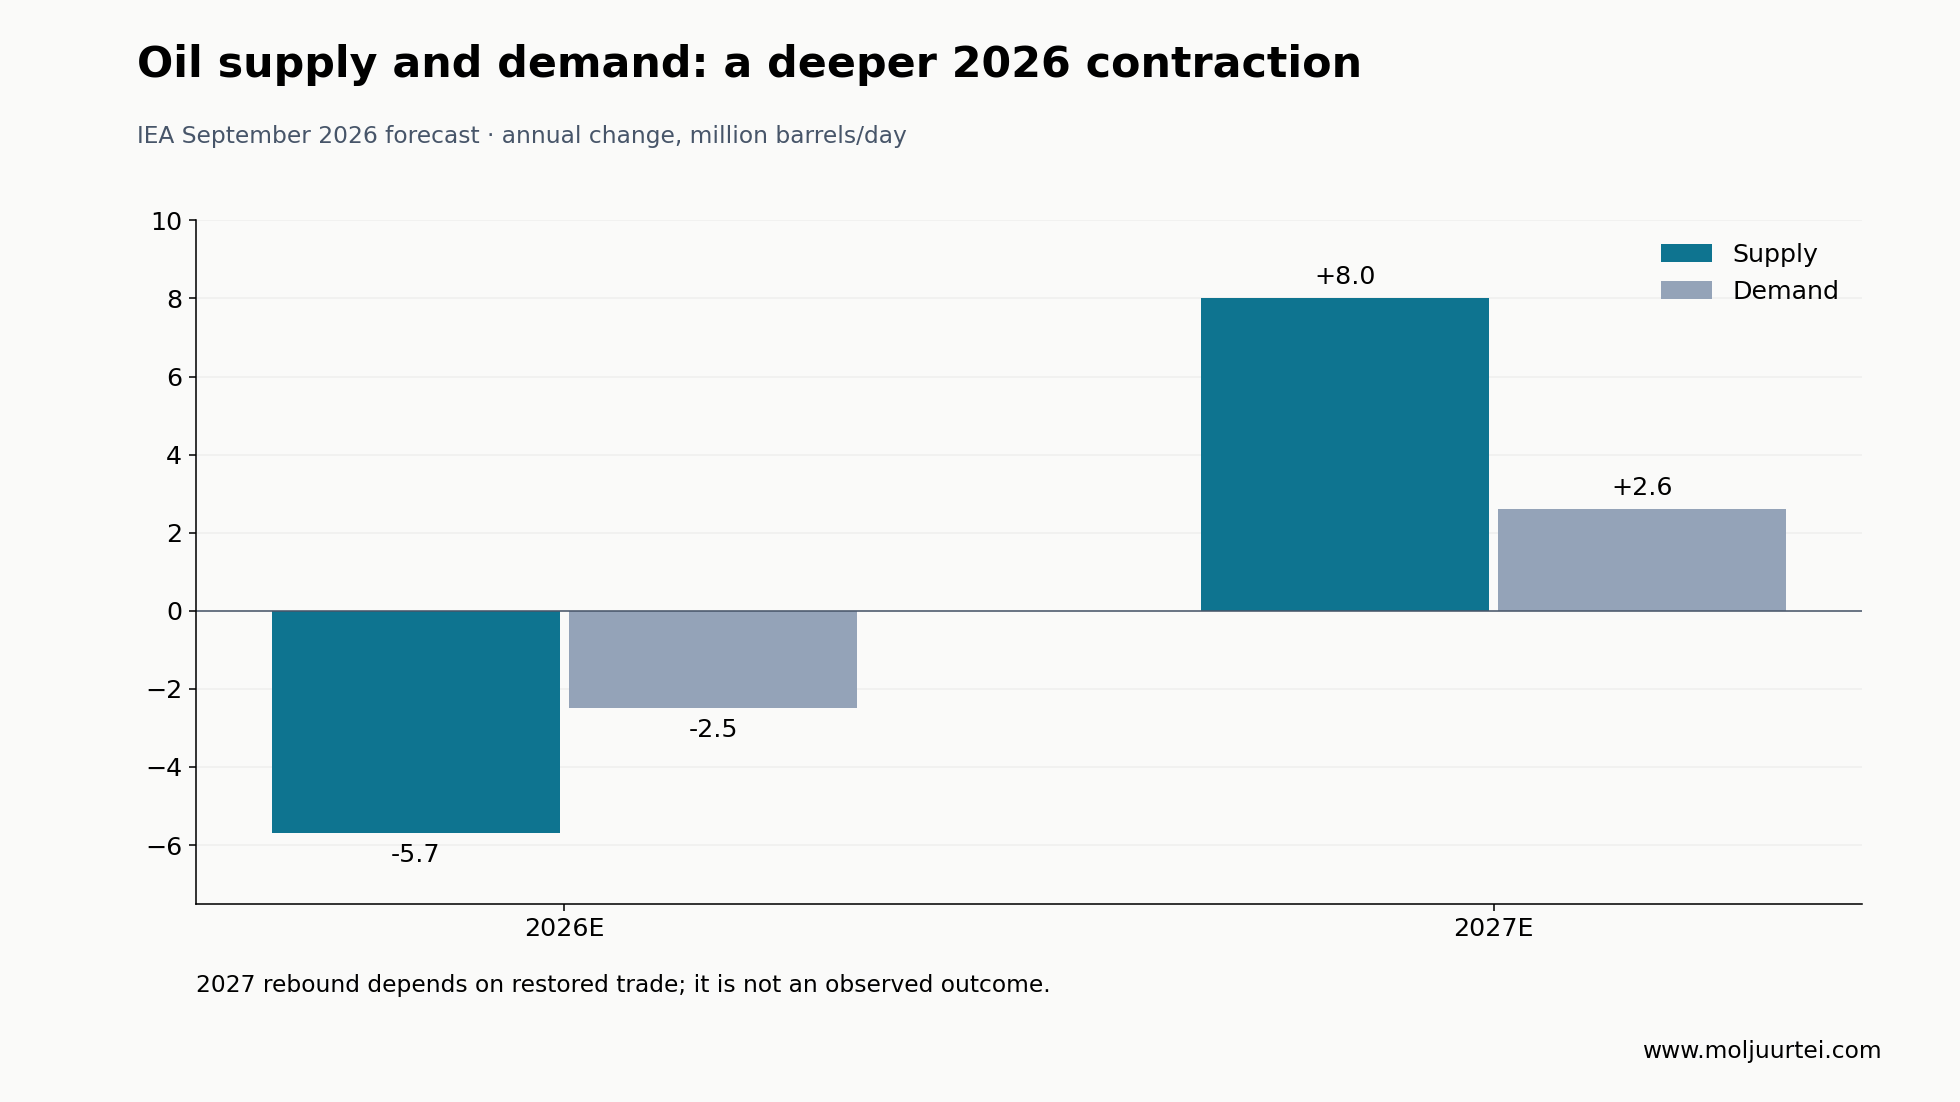
The IEA’s September 11 forecast is materially weaker than the August figures in the original memo: 2026 oil demand falls 2.5 million barrels/day and supply falls 5.7 million barrels/day. Its 2027 rebound assumptions are +2.6 and +8.0 million barrels/day, respectively, conditional on restored trade. Inventories had fallen about 507 million barrels since February. This is a supply shock with demand destruction, not straightforward volume growth. A reopening would release ship capacity but could also restore cargoes and trigger inventory rebuilding.
A ceasefire headline is therefore neither an immediate reset nor irrelevant. Mines, insurance, port access, crew willingness and confidence can delay normalisation. Conversely, it would be wrong to assume every extra mile survives indefinitely. The observations that matter are actual transit recovery, voyage duration, ballast days, cargo availability and freight fixtures. Weather constraints in canals and inland waterways can amplify disruption, but old Panama or Rhine spot anecdotes should not be presented as current September measurements.
Mechanism — two clocks, neither perfectly predictable
The original August 19 route snapshot illustrated the distinction between distance and risk: Middle East Gulf–China was quoted at roughly $524,000/day, versus roughly $171,000 from Oman. Those are historical observations, not September quotes. Their difference cannot be attributed entirely to a pure war premium: routes, voyage costs, waiting and fixture terms differ. A listed owner collecting cargo outside Hormuz does not automatically earn the inside-strait benchmark. Nor can we assert that national oil companies capture every dollar of the difference.
Supply responds on a different schedule. Frontline’s September table shows 302 VLCCs on order against 909 existing vessels, 199 Suezmaxes against 664, 188 LR2s against 549 and 39 Aframaxes against 677. The ratios are 33.2%, 30.0%, 34.2% and 5.8%. These are orders across delivery years, not a fleet increase already completed in 2026. Vessel classes overlap economically to some degree, but they are not identical substitutes. A single all-tanker percentage hides that difference.
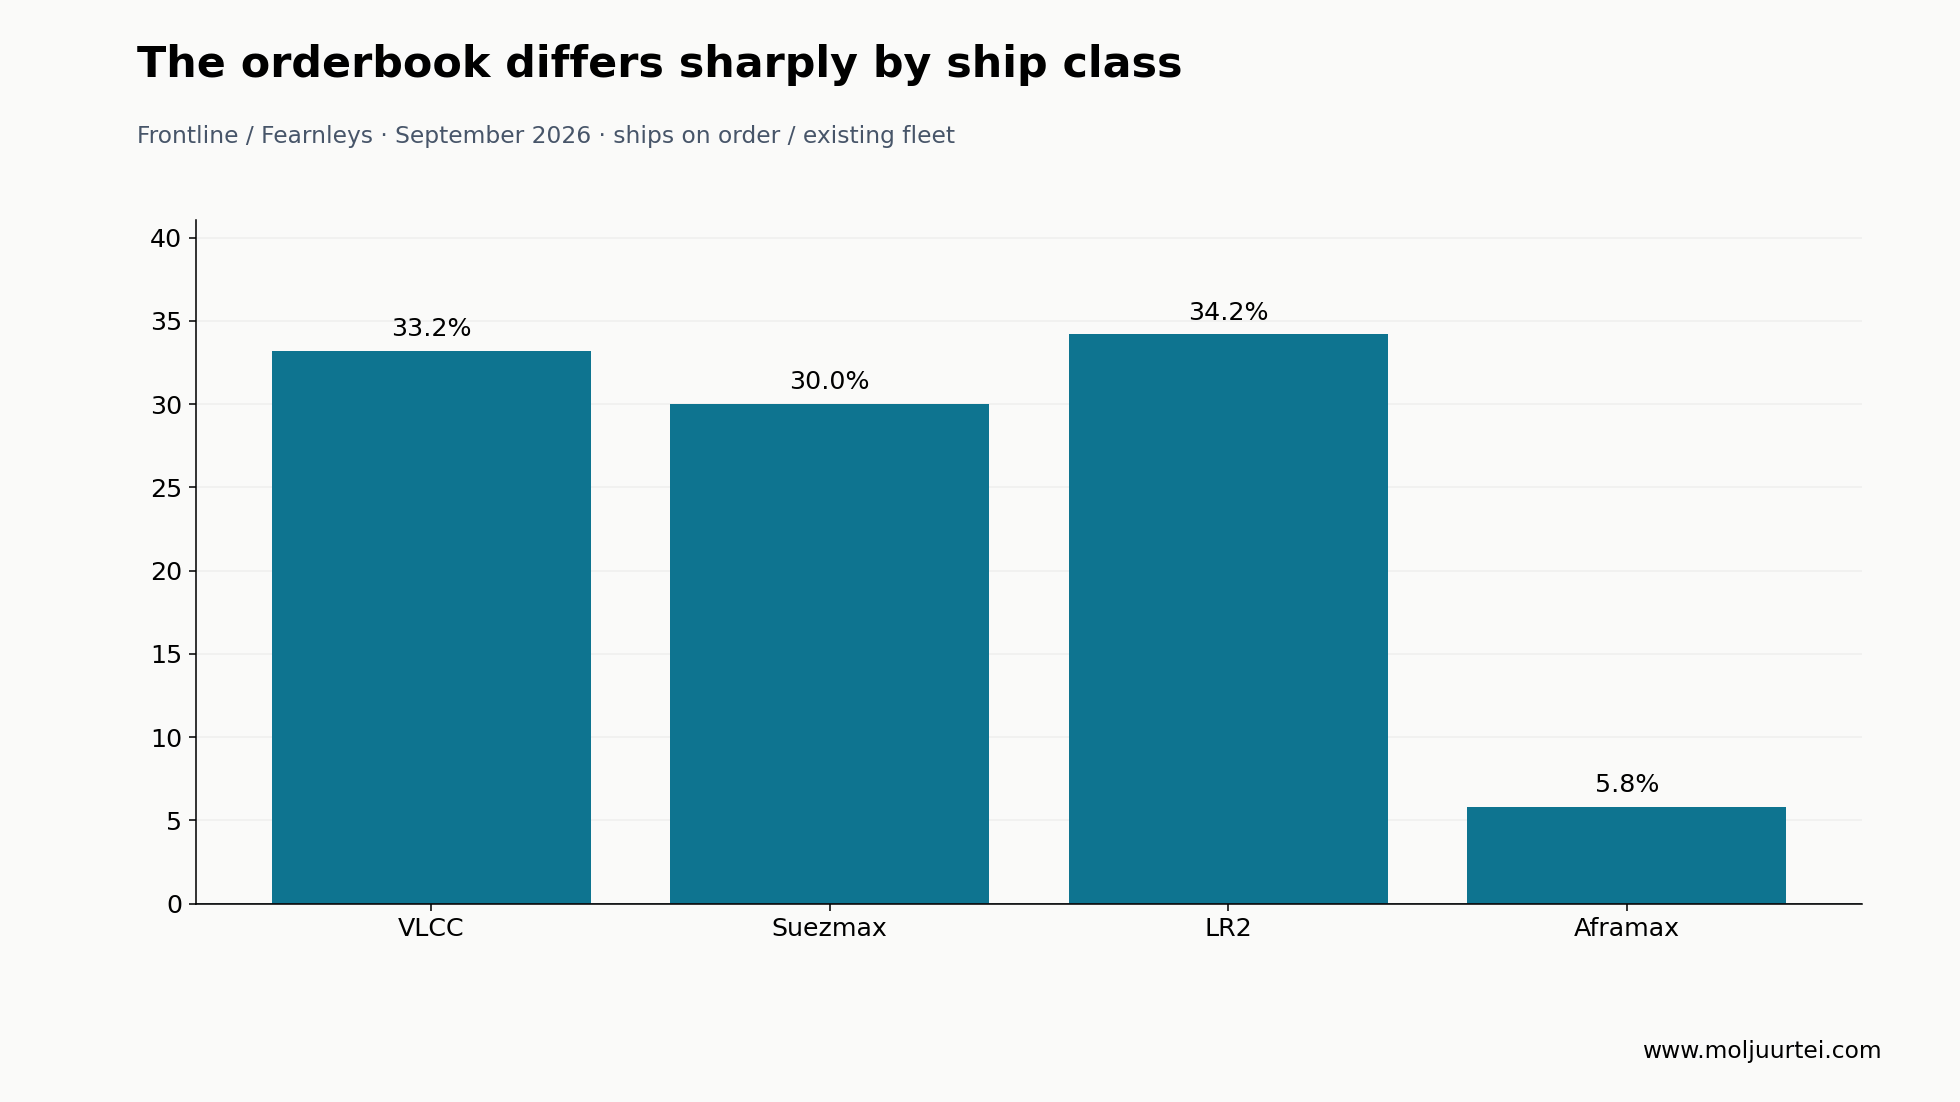
The counterweight is real: 18.2% of VLCCs are over 20 years old and 18.6% are sanctioned. Those groups overlap and must not be added. Old vessels do not all scrap on their twentieth birthday, and sanctions can change. New deliveries minus scrapping, losses and commercially unavailable ships determine usable supply. Frontline also describes roughly 3.5-year lead times into 2030. The old claim that shipyard scarcity had simply ended was too strong; the 2027–29 delivery wave and continuing yard constraints can coexist.
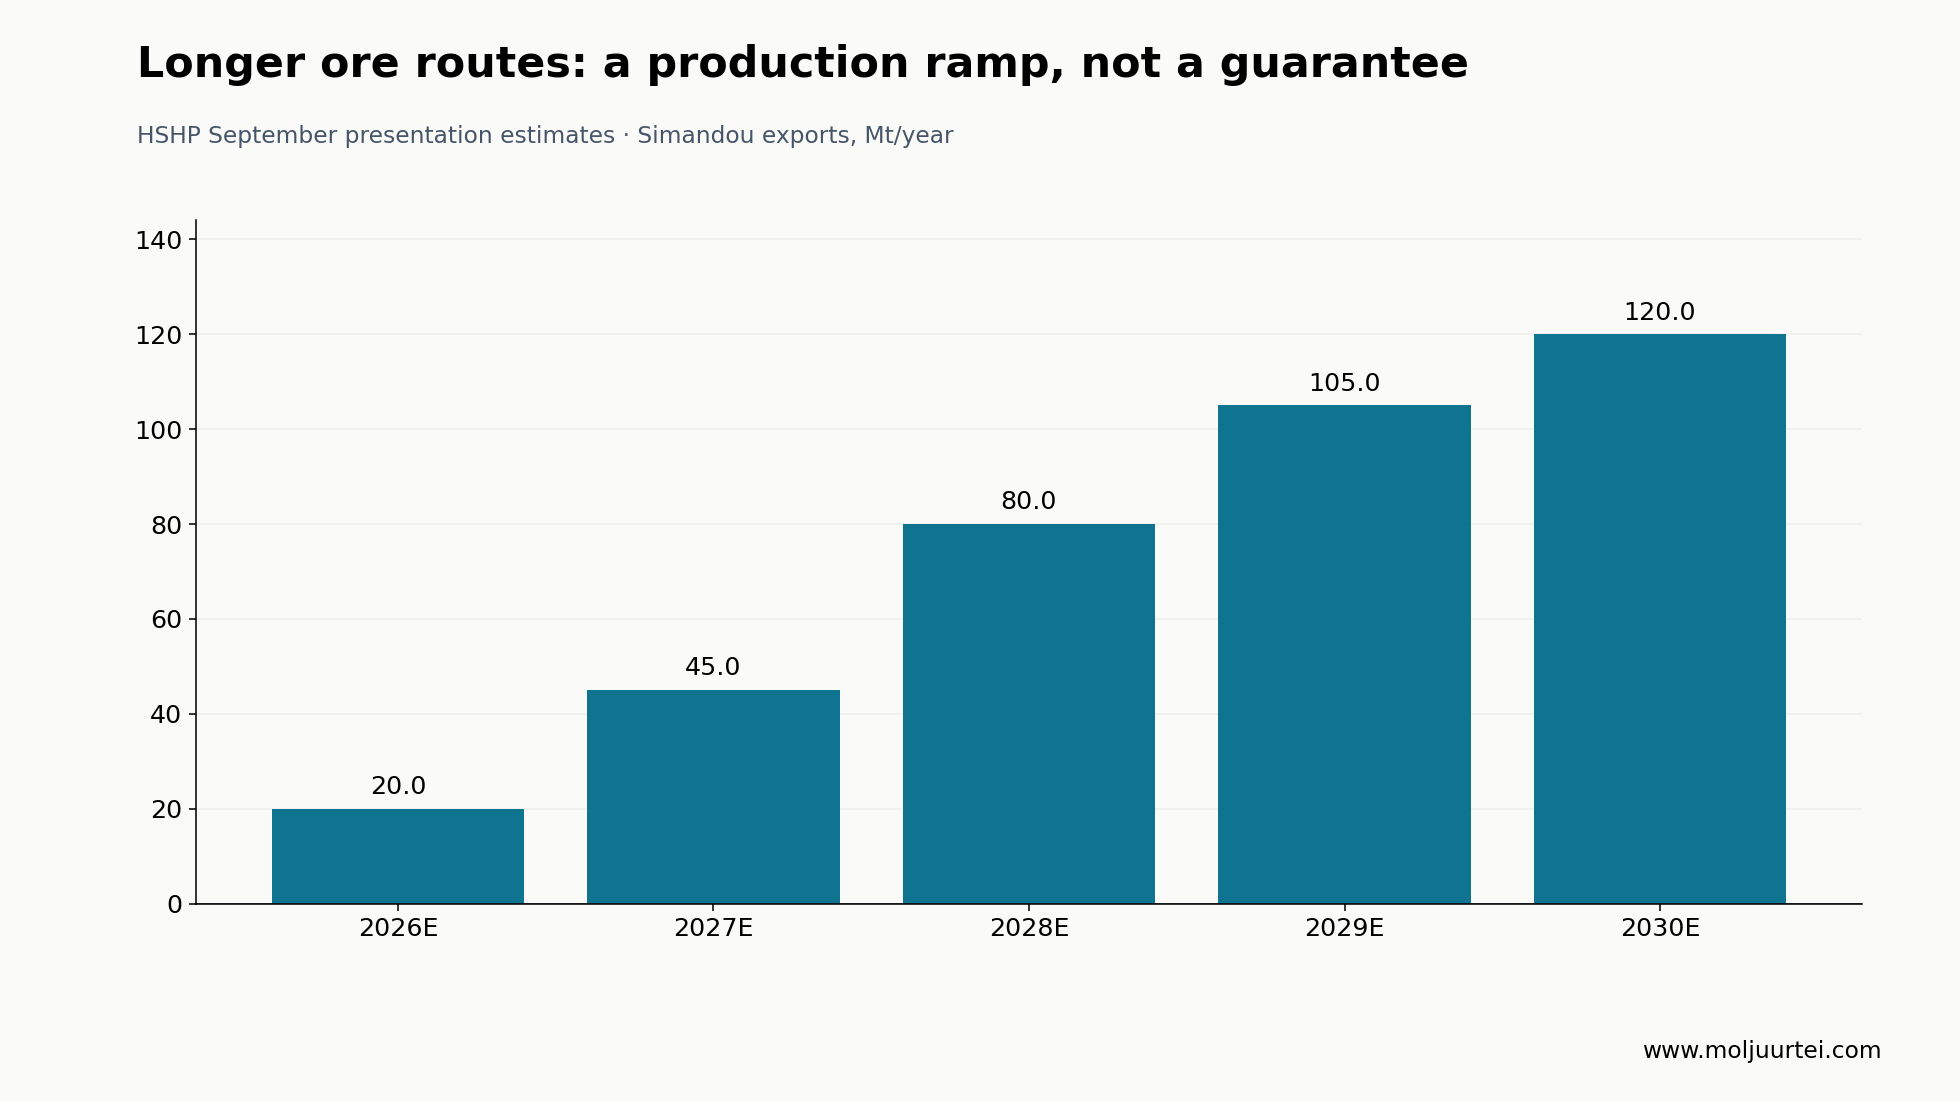
Dry bulk adds a more durable geographic mechanism. Guinea–China ore routes are roughly 11,000 nautical miles versus about 3,000 from Australia in Himalaya’s presentation. Its Simandou export estimates rise from 20 million tonnes in 2026 to 120 million in 2030. These are project ramp assumptions, not delivered cargo or guaranteed HSHP revenue. Mine, rail and port execution, displacement of other exports and Chinese steel demand decide the net ton-mile benefit. The same presentation puts the Capesize orderbook around 16% in July, so dry bulk is not exempt from supply risk.
Basket — six businesses, different cash-flow engines
YTD is recalculated from the December 31, 2025 unadjusted closing price to September 25, 2026. It excludes dividends and therefore is not total shareholder return. Market capitalisations are approximately $3.04B/$10.63B/$5.52B/$0.83B/$5.07B/$3.52B in the same order. This refreshed methodology replaces the mixed vendor YTD figures in the original table. INSW and STNG are useful additional tanker controls, closing at $105.64 and $81.49; they are not additional recommendations or implied holdings.
Table terminology: EBITDA.
These amounts should not be summed into precise shares of a supposedly comparable profit pool. Adjustments and lease treatment differ. Subtracting CMBT’s vessel-disposal gain leaves about $425.3M, but that is our arithmetic, not a company-defined adjusted EBITDA measure, and it does not remove every non-recurring item. EBITDA also precedes interest, maintenance investment and much of the economic cost of renewing a fleet.
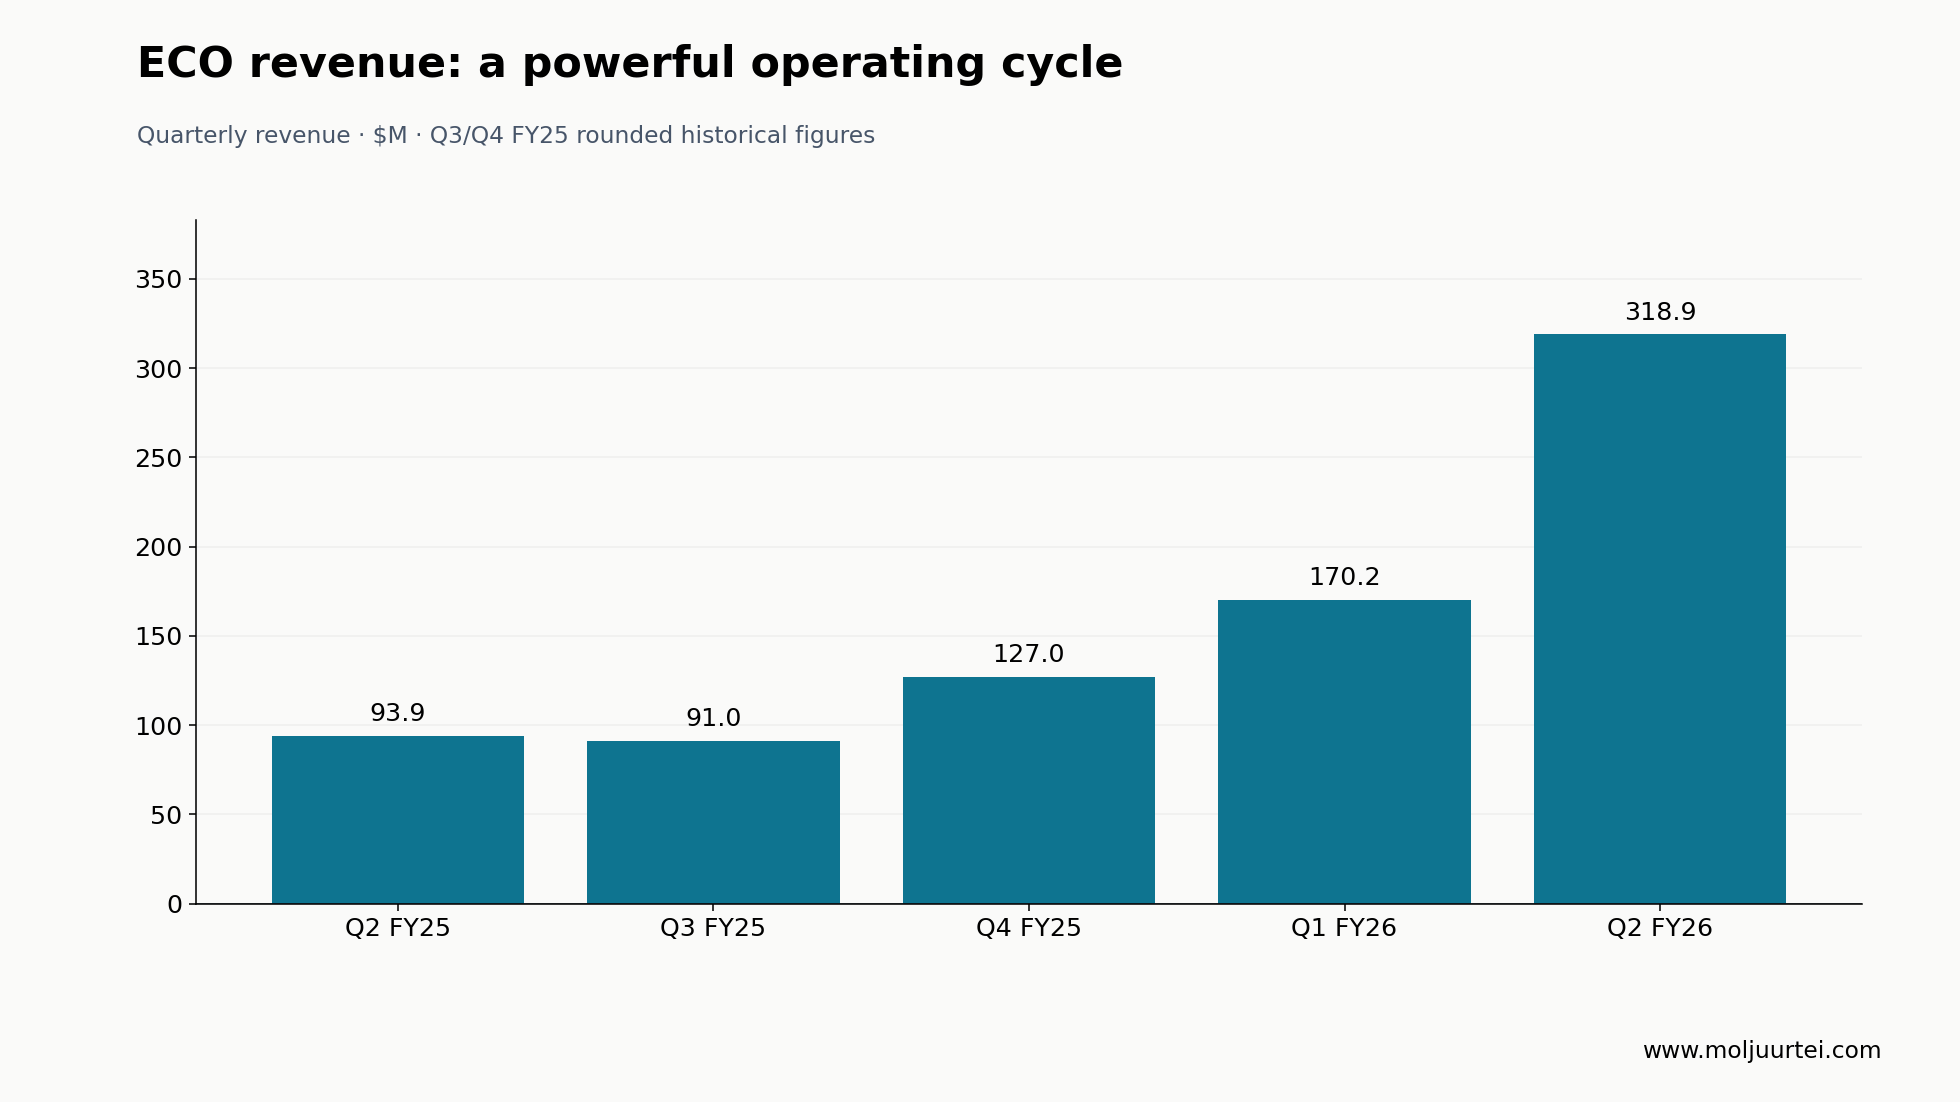
ECO is a strong operator with 18 modern, scrubber-fitted vessels in its August disclosure. Q2 revenue was $318.9M, profit $230.3M and EPS $5.90. EBITDA/revenue was about 78.9%, using $251.6M, rather than the old 79.3% figure. The $5.25 distribution had an August 14 NYSE ex-date and August 21 payment date; a September buyer does not receive that past distribution. A fuel-efficient fleet and commercially successful fixtures support high cash capture, but the result is also a rate-cycle outcome, not a permanent margin.
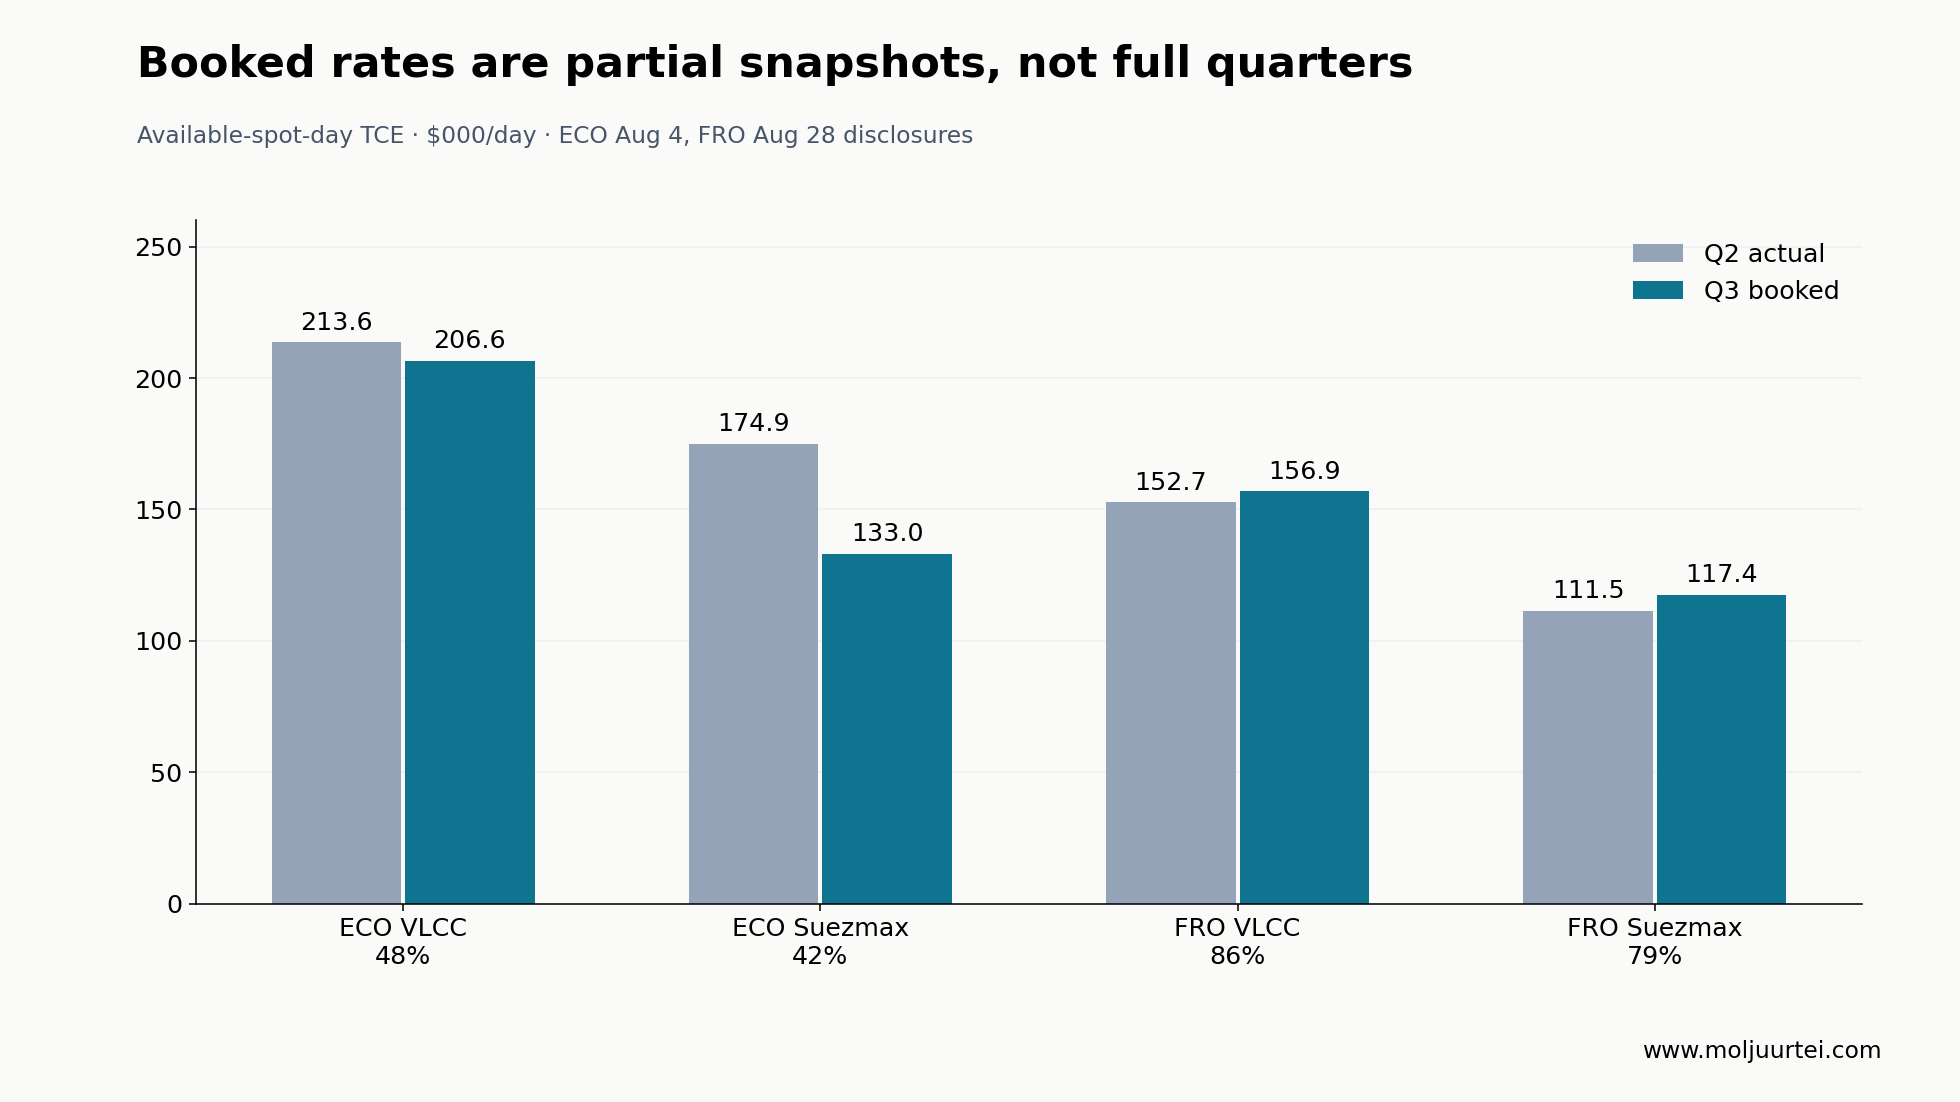
The rate comparison needs its denominator. ECO’s Q2 VLCC TCE was $213,600 per available spot day but $187,700 per operating day; fleetwide operating-day TCE was $181,200. On August 4, Q3 VLCC and Suezmax bookings covered only 48% and 42% at $206,600 and $133,000/day. Frontline’s August 28 VLCC and Suezmax bookings covered 86% and 79% at $156,900 and $117,400, above its Q2 spot figures of $152,700 and $111,500. This mixed evidence does not establish a sector-wide rollover. Different booking dates, voyage timing and ballast accounting prevent a clean league table of skill.
FRO adds scale and capital recycling. Its Q2 profit was $659.2M reported and $580.2M adjusted. The September 11 announcement confirmed completion of two VLCC sales for $270M and $179M net cash proceeds, funding an $0.80 special dividend alongside the $2.61 ordinary payment. The combined $3.41 is payable around September 28, but the September 18 NYSE ex-date has passed. It is not a fresh buyer’s windfall or a recurring quarterly yield. Selected time charters at fixed rates moderate exposure; they do not hedge the whole fleet.
CMBT combines tankers, dry bulk and other vessels with an active sale-and-reinvestment programme. Q2 profit was $364.4M and contracted revenue backlog $3.26B. The reported $11.2B fleet market value is an asset valuation, not equity value: debt, commitments, sale costs and minority interests matter. Expected disposal gains in later quarters are not already-earned operating cash. The proposed $0.64 distribution combines $0.21 dividend and $0.43 share-premium repayment and requires the October 8 shareholder vote; the dividend component is subject to the announced withholding treatment.
HSHP owns 12 LNG dual-fuel Newcastlemax vessels. Long-term charters average about 141% of the Capesize index, so long duration does not mean fixed earnings. August gross TCE was $57,700/day. September financing data show about $681M gross debt and 57% loan-to-value. Most importantly, the $17,500/day breakeven in its illustration is an index-equivalent rate; actual vessel cash breakeven is about $24,567/day. Confusing either with roughly $6,500/day operating expense substantially understates the financing burden.
Himalaya’s illustrative cash-flow formula applies a 41% premium to the index, deducts 5% commissions and adds $1,600/day scrubber benefit before vessel cash costs. The result is highly sensitive to freight and fuel spreads. Its deck used 47.145M shares; the September 16 issue lifted the count to 47.170M. A declared monthly distribution is a board decision from available earnings, not a perpetual fixed coupon. The structural ore opportunity remains attractive only if it reaches net cash per share after debt service.
GLNG liquefies gas offshore. Hilli’s Argentina contract carries $5.7B of adjusted EBITDA backlog over 20 years; Esperanza carries $8B on the same measure. Gimi’s approximately $2.9B figure is net earnings backlog attributable to Golar, a different measure. Adding these and calling the result $17B of contracted EBITDA was wrong. Straight division of the first two contracts gives about $285M and $400M per year before considering timing and commodity-linked terms. These are project economics, not free cash available to common shareholders.
Timing is the key bridge. Hilli left Cameroon in August and is expected to begin Argentina service in the second half of 2027 after conversion. Esperanza is scheduled for delivery in late 2027 and Argentina start-up in the second half of 2028. The fourth FLNG project has a $2.45B EPC cost and year-end 2029 delivery target but was uncontracted in the Q2 update. Q2 adjusted EBITDA of $127.4M is therefore not the steady-state cash flow of all these future projects. Construction payments, financing, downtime, gas availability and counterparties must bridge the gap.
The Argentina contracts also have commodity participation above the specified $8/MMBtu FOB LNG threshold. That is distinct from Hilli’s old Cameroon oil-and-gas-linked earnings. A long contract reduces some spot exposure but does not eliminate execution or gas-price sensitivity. GLNG deserves a project-by-project equity cash-flow model including remaining capital expenditure and financing, rather than a low P/E screen or a multiple applied to a mixed-definition backlog.
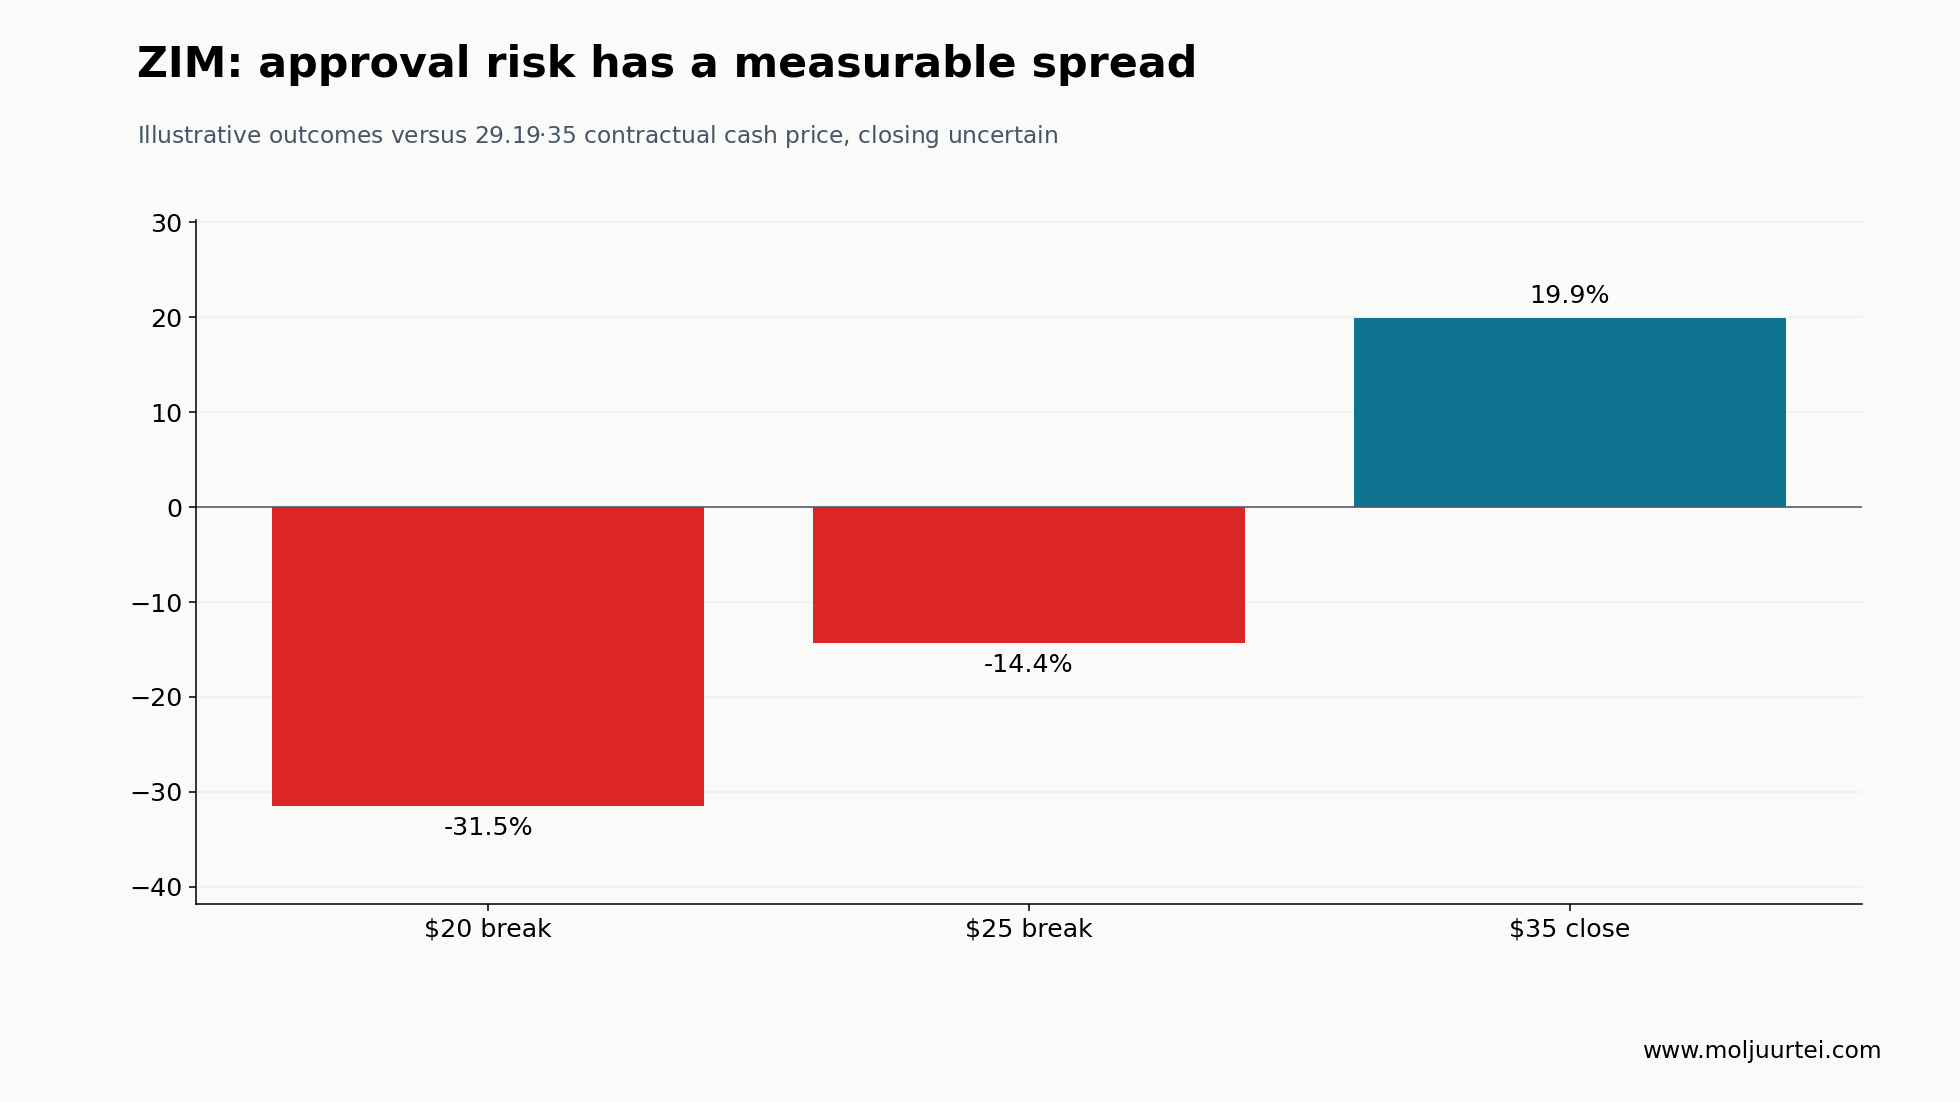
ZIM’s $35 cash takeover price is 19.9% above $29.19, a $5.81 gross spread before time, costs and taxes. Its Q2 release targeted a fourth-quarter 2026 close subject to approvals. September 24–25 reporting describes a revised framework with FIMI for Israeli security requirements, with further documentation still required and possible delay into 2027 discussed in the press. That is not an official new closing date or completed approval. The State’s Golden Share remains a central uncertainty.
The operating company still matters if the deal fails: Q2 revenue was $1.78B, adjusted EBITDA $491M and net income $64M; full-year adjusted EBITDA guidance was $2.0–2.4B. Hypothetical break prices of $20 and $25 imply −31.5% and −14.4% from today, versus +19.9% at contractual completion. Those break prices are stress assumptions, not independent fair-value estimates. The spread is not an annualised guaranteed return; delay changes the realised annual return and a broken deal changes the payoff entirely.
Management & Track Record — capital allocation under high rates
Saverys at CMBT is selling some tanker assets while investing in dry bulk and new technology. That can recycle elevated asset values into longer-lived opportunities, but also commits capital to newbuild and fuel-technology risk. Frontline under Barstad has sold vessels, returned cash and lowered its weighted financing margin from 178 to 126 basis points. That 52-basis-point reduction is the loan margin, not a guaranteed reduction in every all-in borrowing cost. The correct test is cash returned plus future earning capacity after debt and replacement spending.
Alafouzos at ECO has pursued modern vessels and high spot exposure, which worked exceptionally well in this environment but remains a deliberate cyclical choice. Staubo at Golar has concentrated the business on floating liquefaction; Hilli’s long operating record supports execution credibility, while the next conversions and start-ups still require proof. Across the basket, related-party dealings, new equity issuance, asset-sale timing and debt maturity discipline deserve as much attention as management’s rate outlook. A profitable quarter is evidence of execution, not immunity from the next cycle.
Risks — what would weaken or strengthen the thesis
Milestones are concrete: actual Q3 rate and cash-flow reports; the October 8 CMBT distribution vote; progress on the revised ZIM approval documents; realised Simandou exports; Hilli’s conversion and 2027 start; Esperanza delivery and 2028 start; and 2027–29 ship deliveries net of removals. A stale booking snapshot or a political headline is not a substitute. No unconfirmed earnings date is presented as a scheduled catalyst.
Price Setup — trends and positioning as of September 25–26
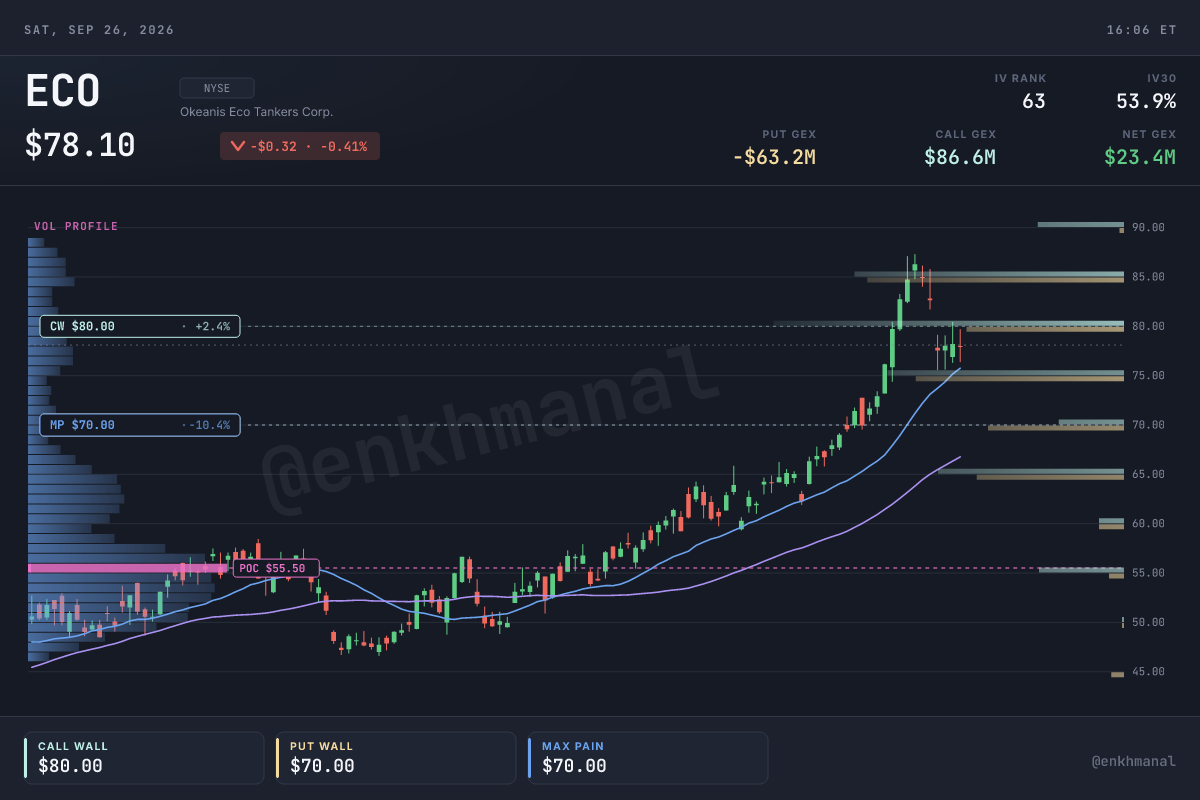
ECO remains above all four tracked moving averages: $75.75/$66.77/$59.78/$52.01 for 20/50/100/200 sessions. FRO, CMBT and HSHP are below their 20-day averages but above their longer averages; GLNG is below its 20-, 50- and 100-day averages but above the 200-day. These relative positions replace the old support levels and CMBT’s obsolete inverted picture. They describe trend, not guaranteed entry or exit points. A conflict headline can overwhelm a moving average.
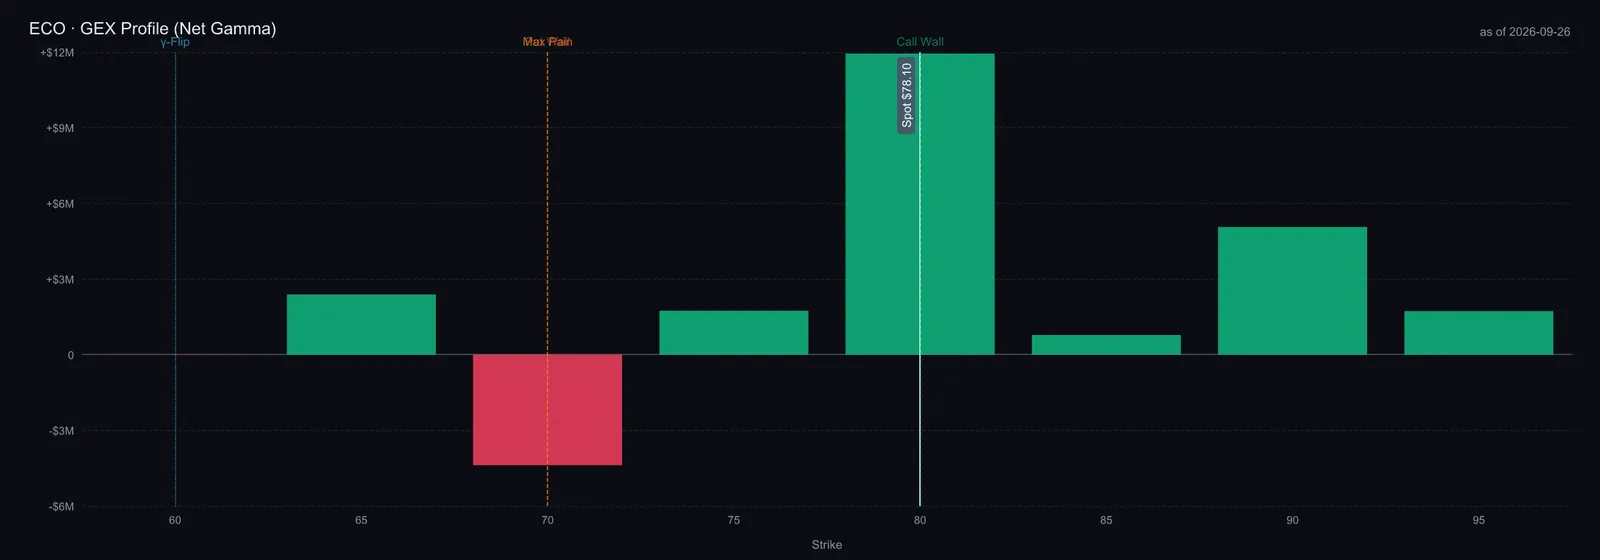
The available ECO gamma estimate is +$23.37M across six expirations, with call concentration at $80 and put concentration and max pain at $70. Call/put open interest is 7,839/8,251, a put/call ratio of 1.05. The snapshot’s underlying price is $78.10, not the $77.90 closing quote. Its spot gamma-flip estimate is $60; a $75 strike-profile transition is a different calculation. Neither is a guaranteed support level, and the signs depend on position assumptions.
Implied volatility is about 53.94%. The available IV-rank history is 113 days, so a rank of 62.9 is not a full-year comparison. A simple square-root-of-time estimate is about ±15.5%, or ±$12.05, over 30 calendar days. This is a scale of option-implied uncertainty, not a promised trading range or a statement about the probability of peace.
Valuation — pay for sustainable cash, not a peak quarter
The old valuation shortcuts overstated precision. A P/E multiple cannot be applied directly to EBITDA; enterprise value must be bridged to equity by debt and cash. P/B is not price/NAV when vessel market values differ from carrying values. Vendor forward EPS estimates also use unverified forecast periods and accounting conventions; they do not prove a universal 35–60% earnings decline. At today’s prices, the vendor trailing EPS screen gives roughly 7.2x ECO, 7.2x FRO, 6.4x CMBT, 15.5x HSHP, 34.0x GLNG and 25.4x ZIM. Gains, timing and cyclicality limit comparability.
A transparent ECO sensitivity is more useful than a falsely exact target. Assume annual EBITDA of $207M, $500M or $800M; the low case approximates the old FY2025 EBITDA reference, while the other two are analyst scenarios, not company guidance. Apply an assumed 7x EV/EBITDA, subtract a fixed illustrative $500M net debt, and divide by 39.045M shares. The result is $24.31/$76.84/$130.62 per share, or −68.8%/−1.4%/+67.7% versus $77.90. These are conditional valuation states, not probability-weighted price forecasts.
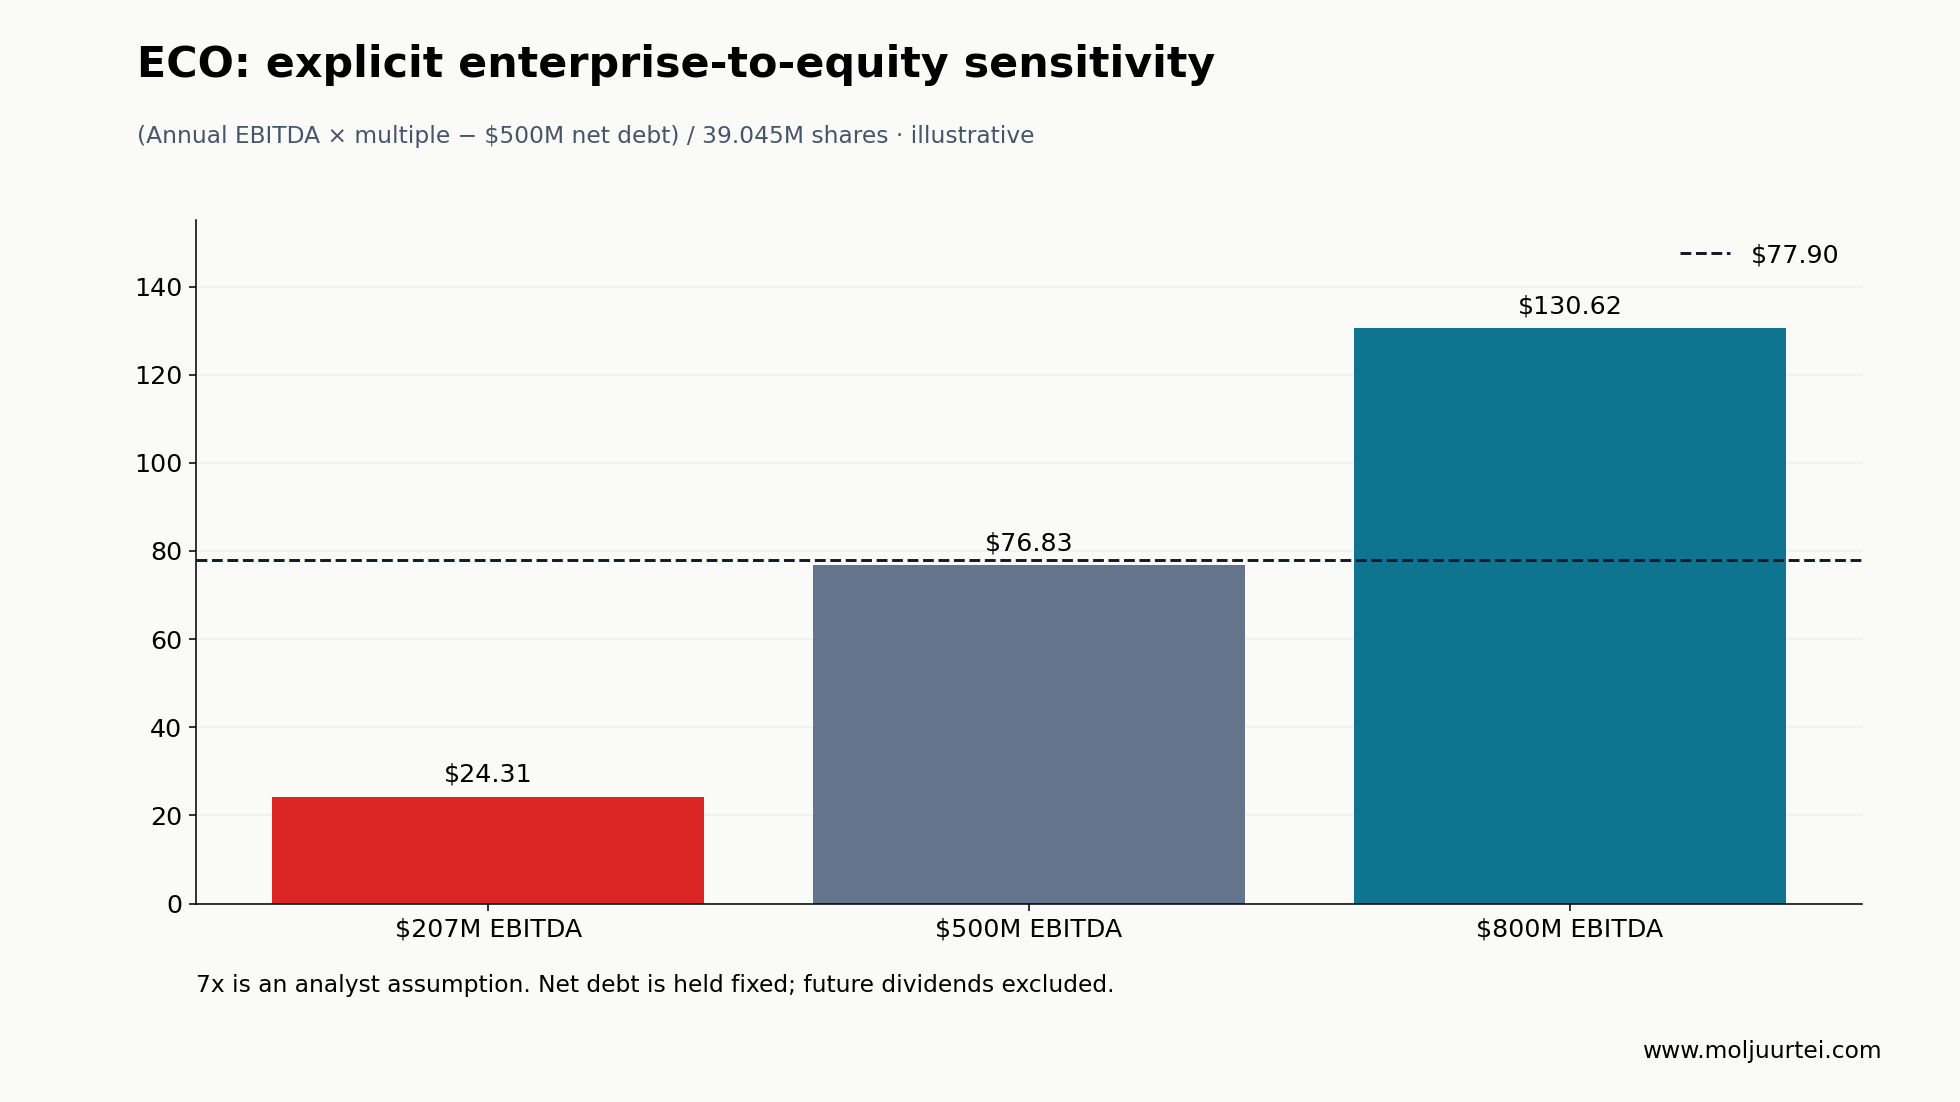
The net-debt input is deliberately labelled an assumption. June reported debt was $722.5M and total cash including restricted cash $247.8M, implying $474.7M on that broad cash basis. September cash is not reported here; the August $5.25 distribution uses about $205M before considering subsequent operating cash, financing and capital spending. The vendor EV-minus-market-cap bridge is about $500M but uses lagged balances. It is not a verified September balance sheet. Every extra $100M of net debt reduces the illustrative equity value by about $2.56/share.
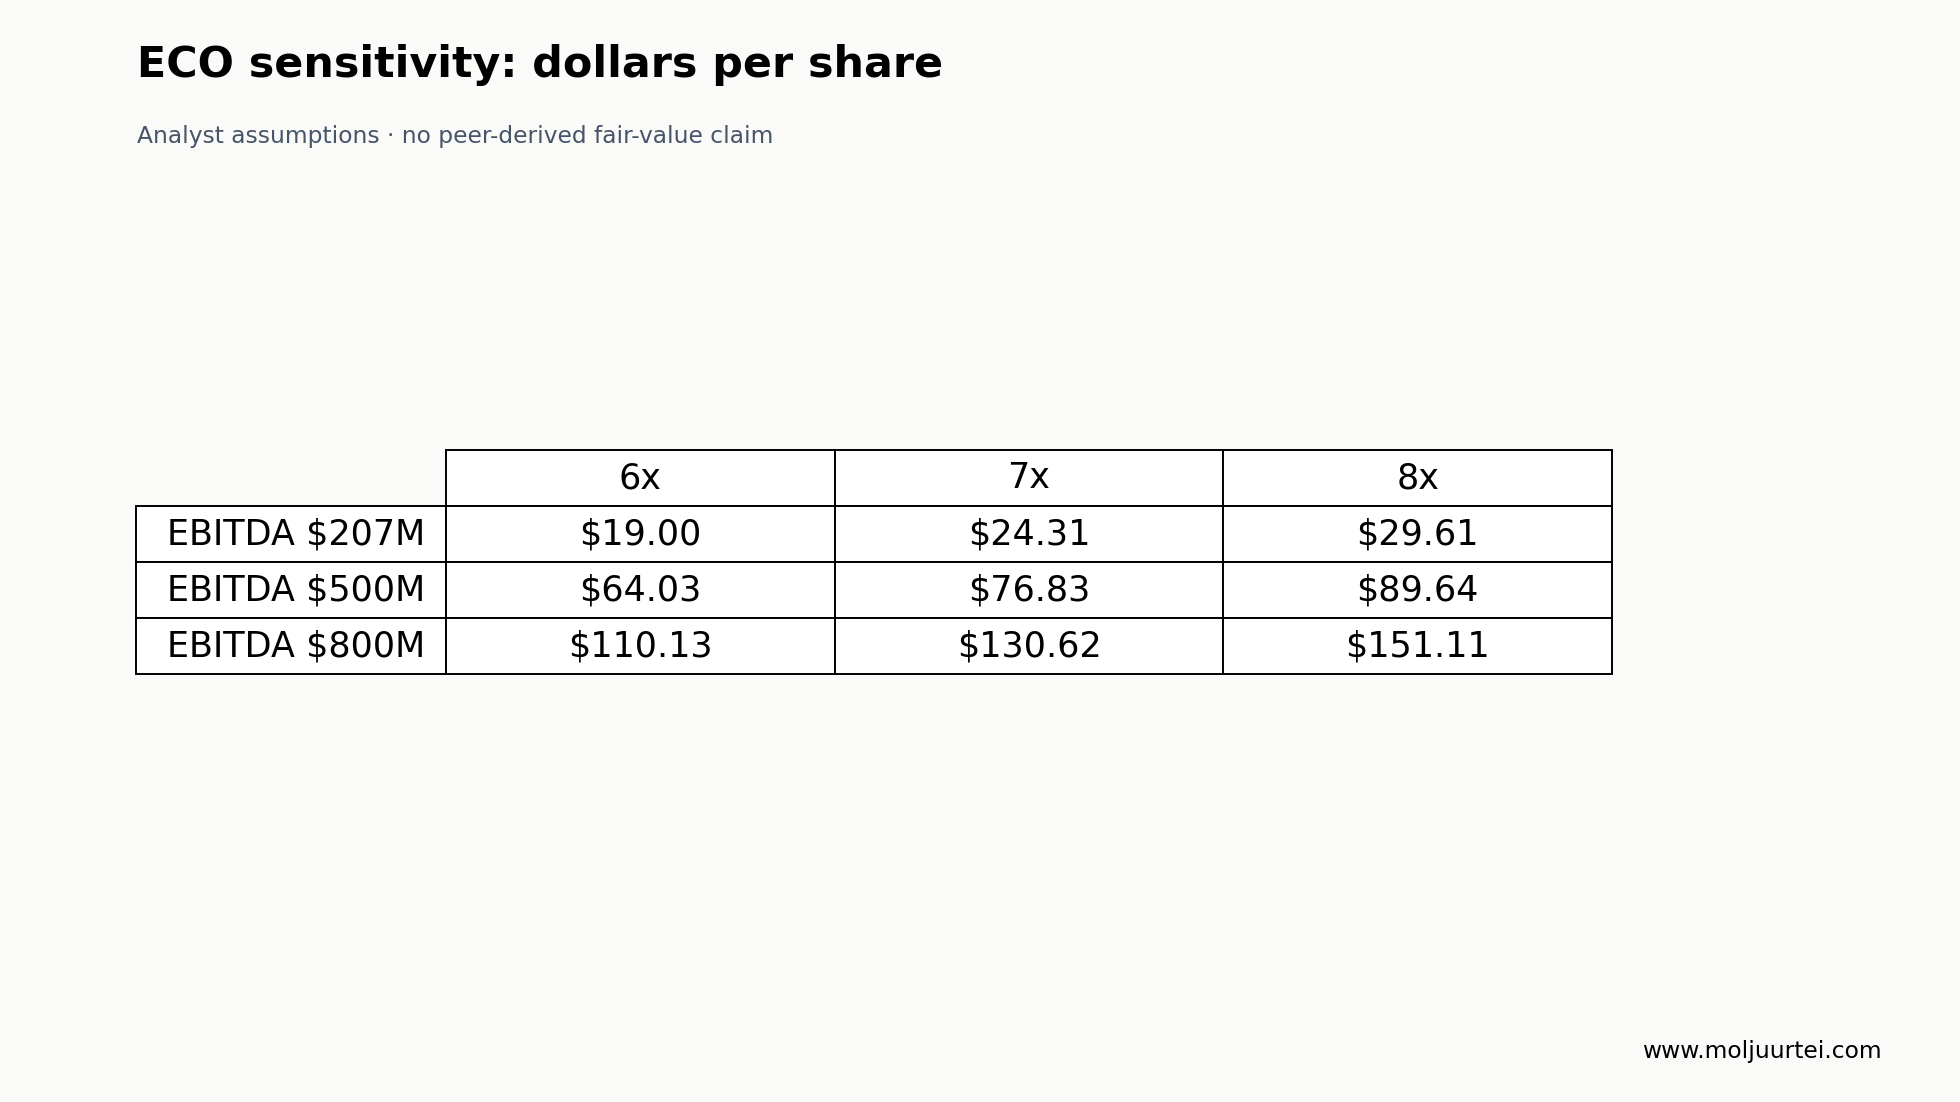
At 7x and those fixed debt assumptions, today’s price requires approximately $506M of annual EBITDA. That is well above the FY2025 reference and well below annualising the exceptional Q2 $251.6M four times. The investment decision is whether the company can sustain that middle territory, distribute cash and avoid overpaying for replacement assets. The 6x–8x table exposes multiple risk instead of presenting 7x as a peer-derived fair value. Future dividends would add to total return, but also change cash and net debt; counting a payout without the balance-sheet effect would double count value.
The structural opportunity is still substantial: constrained usable fleets, longer ore routes and new liquefaction capacity can create years of valuable cash generation. The evidence also demands selectivity. Tanker orders are meaningful but do not arrive overnight; contracted projects are valuable but do not fund themselves; a merger spread compensates for a possible failure. The next purchase should be justified by the specific company’s cash conversion, commitments and downside at the current price, rather than by either a low headline multiple or an assumption that the best part of the cycle must already be over.
Sources and method
IEA September Oil Market Report · ECO Q2 financial statements, August 4 · Frontline September company presentation · Frontline September 11 special dividend · CMBT Q2 financial release · Himalaya September presentation · Himalaya September 16 share count · Golar Q2 release · ZIM Q2 release, August 19 · ZIM revised framework reporting, September 24 · ZIM approval reporting, September 25
Financial disclosures retain their reporting dates; September 25 US closes and September 26 options snapshots are separate. Company forecasts, press reporting and analyst scenarios are identified as such. Price charts use available market history; dividend-exclusive comparisons are not total returns. The August route observation is retained only as dated historical context. The analysis was refreshed September 26, 2026.