Powered Land Deep Dive — Connected power, tenant credit and the delivery test · Updated 26 September 2026
The original 19 September memo challenged an external 83% upside claim for powered-land stocks. This refresh keeps the structural question—who can turn usable power into contracted computing capacity—while updating prices, delivery dates and funding risks. It corrects the distinction between generator queues and data-center load, and between construction cost and equity value.
Thesis
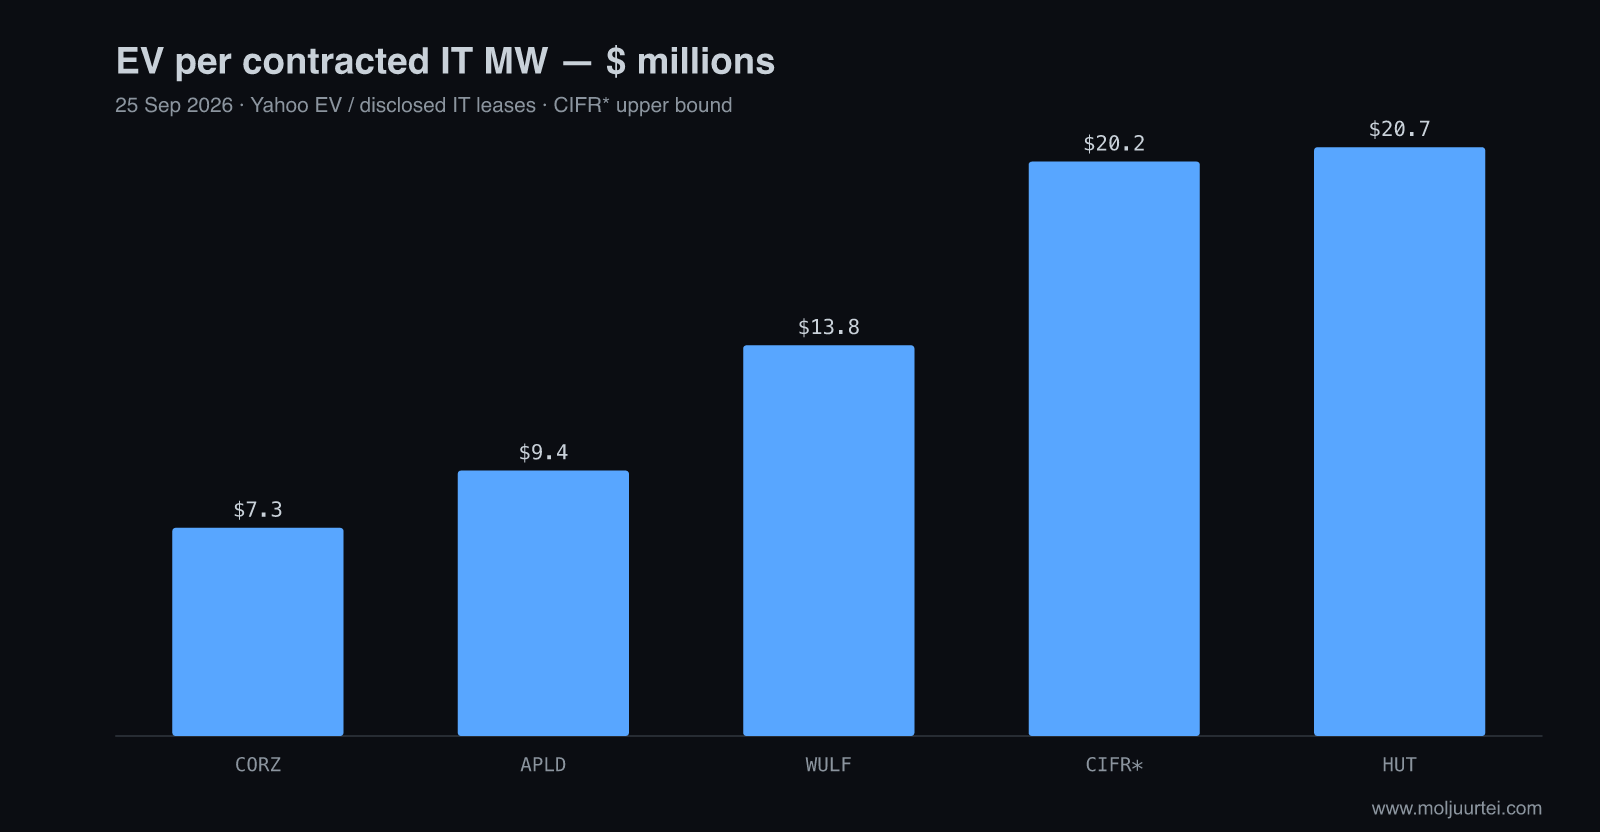
Grid-connected industrial land can shorten the path from an AI infrastructure contract to revenue. The opportunity is in $IREN, $CORZ, $WULF, $CIFR, $APLD and $HUT, but their business models and power denominators differ. At 25 September prices, enterprise value per disclosed contracted IT MW ranges from $7.3M at $CORZ to $20.7M at $HUT. $IREN sells GPU computing rather than bare data-hall leases. Construction cost, company EV, gross site power and contracted IT capacity must not be treated as interchangeable measures.
The starting advantage is existing infrastructure. A connected substation and established industrial use can reduce development work. ERCOT classifications are conditional; they do not guarantee unrestricted power or permit an immediate conversion from mining to AI.
What that lets them sell: long-term triple-net leases at $1.2–2.4 million per critical megawatt per year ($CLSK, $RIOT, $CORZ), or, for $IREN, GPU hours at three-year contract prices up 125% since November. The tenants are Microsoft, $AMD, Anthropic via Fluidstack with Google's guarantee, AWS, CoreWeave and an investment-grade hyperscaler paying $APLD $20 billion.
Why now: the memo’s dated FERC forecast implies a decline in dispatchable nameplate capacity despite substantial wind and solar additions. Berkeley Lab reports that only 13% of the generating and storage capacity in its 2000–2020 application cohort was operating by end-2025. That is a supply-side constraint, not a data-center connection probability. Existing power rights and equipment suppliers such as $INIO and $DPC offer different ways to participate.
The key risk is delivery and financing. A lease is not collected rent. Cipher’s 25 September amendment adds ten years and about $5.2B of contracted revenue at Barber Lake, but resets phased delivery to Q4 2026–Q1 2027 and gives Cipher the first $359.3M of costs above the original budget. TeraWulf’s Justified lease starts delivery in H2 2027, with completion targeted in early 2028; the late-2028 power date belongs to its separate Muskie campus.
This memo sits on three earlier ones. The per-megawatt economics of a signed lease and ERCOT's Batch Zero table are in the $MARA deep dive; the two miners that converted first are in the $RIOT deep dive and the $CLSK deep dive; the customer's side of the pricing is in the $IREN Q4 FY26 earnings analysis. The generation layer, $INIO, has its own single-name dive published alongside this one.
Backdrop — How the Theme Got Here
Start with the physical system. A watt measures the rate of energy use; one MW is one million watts. One MW used for one hour is one MWh of energy. A GW is 1,000 MW. A data center takes electricity and turns it into computing work and heat. AI server racks can require much higher power density than conventional racks, so cooling, backup and electrical equipment must be designed for the actual workload. An energized site has a live electrical connection; a connection agreement alone does not mean every planned MW is available today. Bitcoin equipment can often be curtailed rapidly. A tenant running AI may require much tighter availability, redundancy, fiber and cooling standards. Converting the site therefore requires both a new building investment and agreement on its power obligations. The memo’s illustrative $1–1.5M/MW mining infrastructure and $10–12M/IT-MW AI construction costs describe different equipment and scope; the latter excludes tenants’ computing hardware.
For twenty years the chip was the hard part and the power was a utility bill; in 2025 that inverted. Hyperscalers are expected to spend roughly $725 billion on AI infrastructure in 2026 and more than $1 trillion in 2027, and VanEck's build from the chip makers' own guidance puts the power those chips need at about 11 GW of new US load in 2026 and 18–19 GW in 2027: roughly 20 GW for $NVDA's data-center revenue at about $37 billion per gigawatt, 4–5 GW for $AMD's Meta and OpenAI commitments, 6 GW for $AVGO's custom accelerators. Against that, US data-center capacity was about 50 GW at the end of 2025 and is projected to reach about 80 GW by the end of 2027; Goldman, Morgan Stanley and Bernstein put annual additions between 12 and 19 GW, and Bernstein's count of active North American capacity growth in the twelve months to August was about 13 GW. Three chip companies need most of what the whole country adds, before anyone else plugs anything in. These are external scenario estimates retained from the original memo, not newly issued company guidance, and revenue-to-power ratios vary with product mix, timing and geography.
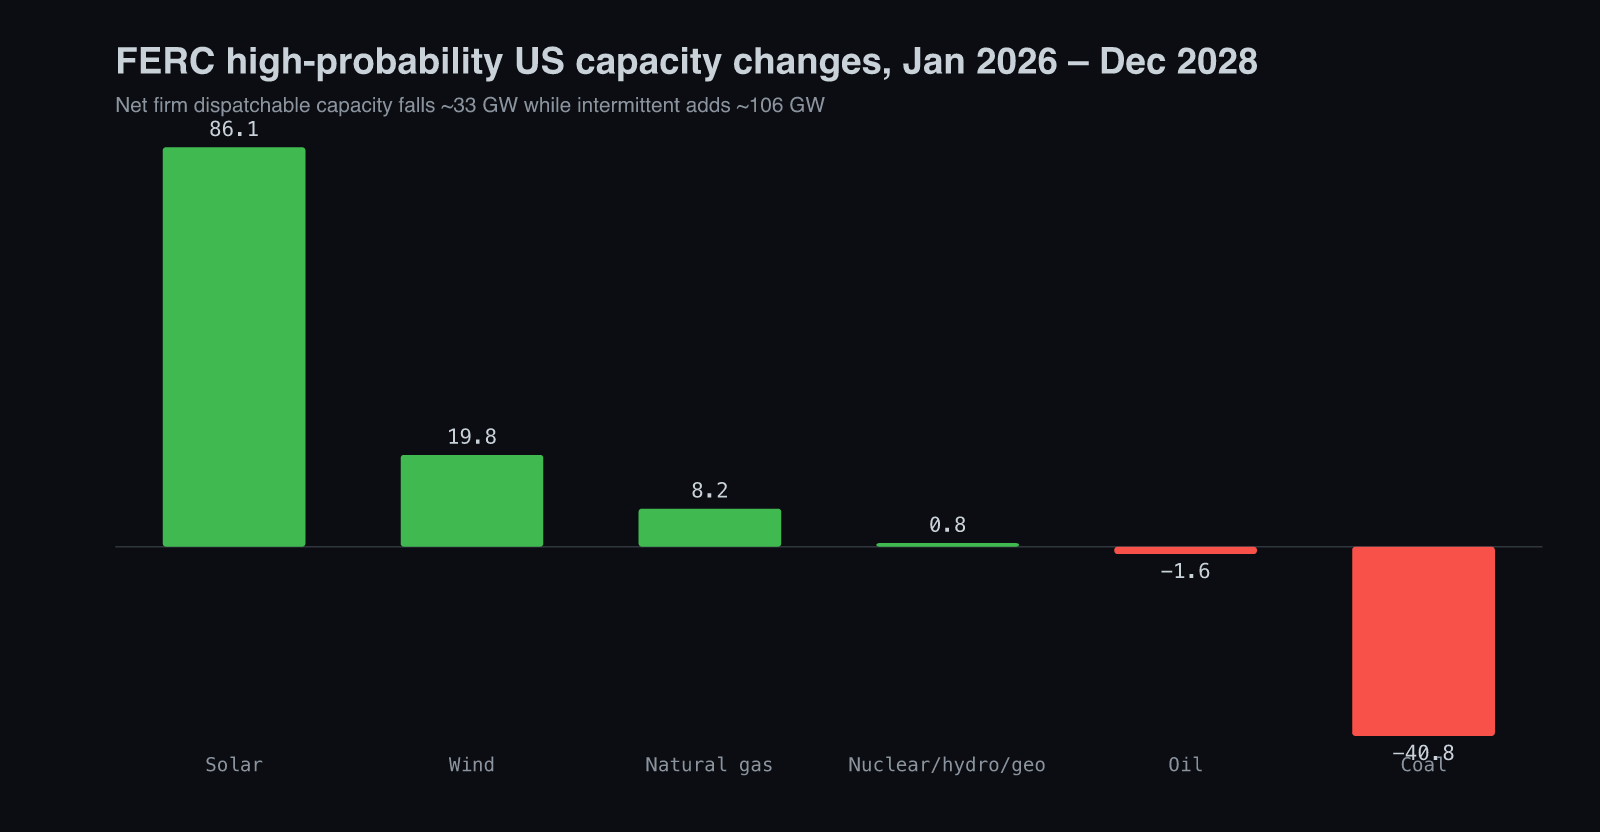
The original memo used FERC’s January 2026–December 2028 high-probability capacity forecast: solar +86.1 GW, wind +19.8 GW, gas +8.2 GW, nuclear/hydro/geothermal +0.8 GW, coal −40.8 GW and oil −1.6 GW. That is about −33.4 GW for the dispatchable categories and +105.9 GW for wind and solar. This is a dated nameplate forecast, not a September update or an estimate of dependable peak capacity. Renewables can supply data centers when combined with the grid, storage, flexible demand and backup; their output profile changes the integration problem. The original comparison between Google’s 90% carbon-free hourly matching and a 99.99% service-availability target was invalid: carbon intensity and uptime measure different things. Likewise, a modeled sevenfold renewable overbuild is a study-specific configuration, not a universal engineering requirement. Original forecast source.
Berkeley Lab’s 2026 Queued Up report measures generation and storage projects, not data-center load applications. At end-2025, roughly 2,060 GW was active: 1,312 GW of generation and 749 GW of storage. Only 13% of the capacity in the 2000–2020 application cohort had entered operation by end-2025; 75% had withdrawn. Completed projects in the reporting regions took a median of over five years. The original 603 GW of new requests, 53 GW connected and 756 GW withdrawn refer to different cohorts moving during one year; dividing annual completions by the queue stock does not estimate a project’s probability of success. The investment inference is narrower: power supply additions face substantial execution delays, so an already connected industrial site may have a head start. Its own load-conversion permissions still require separate diligence.
Mechanism — Why Now & How It Works
The value travels along one chain, but each link adds its own conditions: an energized megawatt becomes a long lease with a credit-worthy tenant, the lease becomes cheap project finance secured against it, and delivered cash flow may support an equity re-rating. The miners' own signatures set the price of the first link. $CLSK let 175 MW at Sandersville to an investment-grade hyperscaler for twenty years at about $330 million a year of triple-net income; $RIOT let 191 MW to a frontier lab for $9.1 billion over twenty years; $CORZ announced approximately 530 MW of 15-year AMD-linked agreements across five sites. Those are rents of $1.2–2.4 million per critical megawatt per year on land that a year earlier earned bitcoin at perhaps $0.6 million. Capitalise twenty-year rent from an investment-grade tenant at 15× and a leased megawatt is worth about $28 million; building the hall costs an illustrative $10–12 million before tenant IT equipment; 80% construction financing would be loan-to-cost, not loan-to-value. When BlackRock, Nvidia, Microsoft and xAI bought Aligned Data Centers for $40 billion, about 5 GW of operating and planned capacity, the mark was roughly $8 million per megawatt; the listed miners were then trading near $3 million. That gap was the trade VanEck wrote up a year ago, and most of it has closed. The $28M is gross rent capitalized at an assumed multiple, not equity value or bankable profit. Debt, operating costs, delivery timing, renewal risk and dilution still have to be deducted or modeled. Aligned’s operating-plus-planned denominator is not directly comparable to contracted critical IT MW.
Tenant credit affects financing terms. A long triple-net lease can support project debt, especially when the tenant or guarantor is investment grade, but the lease is not itself a bond or a loan commitment. Google’s support in $WULF and $CIFR structures and $AMD’s support in $CORZ reduce specified exposures, not every project risk. The original $MARA management illustration was a 10% yield on construction cost for a hyperscaler, about 15% for a neocloud and more for enterprise customers. Higher promised yield can compensate for greater credit or execution risk. Financing depends on contract scope, construction milestones, collateral and lender terms; no single 80% leverage assumption applies to the entire basket.
The second mechanism is the one the miners do not control: what powers the hall when the grid cannot. SemiAnalysis's tracker counts 75 GW of firm behind-the-meter equipment orders for AI compute, 20 GW of them in the June quarter alone, and describes the shift inside them from turbines to engines: turbine slots at $GEV and Siemens sold out past 2030 because utilities compete for them, reciprocating engines did not, so the order book moved to the twenty-two manufacturers with multi-hundred-megawatt data-center orders, up from twelve a year ago (SemiAnalysis, Sept 10). OpenAI's 1.4 GW Shackelford County campus is planned around more than five hundred of $INIO's 4.25 MW Jenbacher J624s; Microsoft has signed more than 5 GW of behind-the-meter nameplate this year; Google is deploying 930 MW of aeroderivative turbines and 900 MW of $BE fuel cells. On-site generation can reduce dependence on grid imports, but fuel supply, air permits, redundancy, maintenance and any grid connection remain constraints. Announced orders do not establish operating capacity or a universal 2027 completion date.
ERCOT’s 9 September verification notice is the current decision-relevant rule: conditional Batch Zero projects must complete verification before inclusion is final. Responses are generally due ten business days after each request; failure can exclude a project. IREN’s 8 September release confirms conditional base-load treatment for its 2 GW Sweetwater hub and targets 300 MW gross delivery at Sweetwater 1 in Q4 2027. Existing connection status has value, but it does not guarantee an unconditional right to serve any load. The original memo’s specific $50,000/MW security, 80% forfeiture and universal thirty-minute disconnection claims have not been established by the primary documents checked here and are not used as confirmed investment inputs. ERCOT’s published planning timetable is still an evolving process, not a firm earnings catalyst.
Basket & Positioning
The ranking starts with the business: secured and usable power, customer credit and the path from contracted capacity to operating cash flow. Price trend is a timing input. The table uses company-disclosed IT lease capacity where available; pipeline power is neither signed rent nor delivered capacity. EV uses Yahoo’s 25 September snapshot and may include leases and parent-level assets, so EV/MW is a rough comparison rather than a project valuation. Undeveloped land, differing tenant guarantees and unfinished construction explain part of the spread.
Table terminology: IT; EV; ARR; Batch Zero; MW; Q4; Q1; GW.
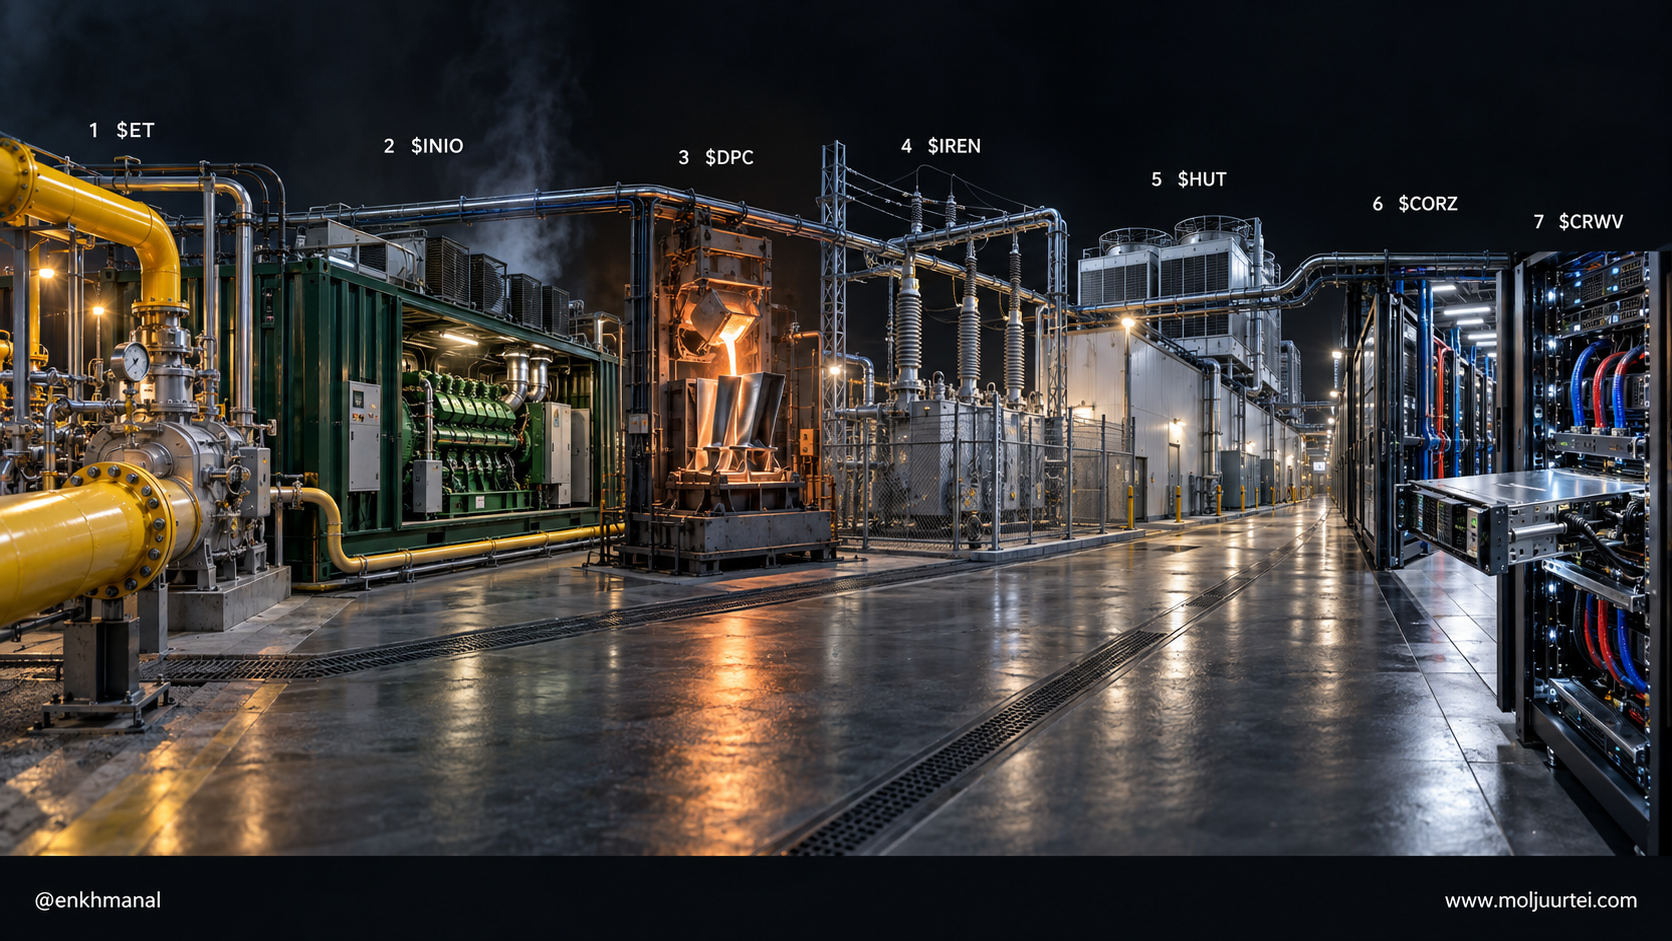
The refreshed ranking keeps $IREN, $HUT and $APLD as the central business candidates, but the old statement that all three have favorable price trends no longer holds. $HUT remains above its 50- and 200-day averages. $IREN is above the 50-day but below the 200-day; $APLD is below both. The growth case can remain intact before a chart confirms it, but entries now carry weaker momentum evidence. $CORZ offers substantial delivered capacity at the lowest EV per contracted MW here; $WULF’s Justified delivery is earlier than the original memo incorrectly stated; and $CIFR’s longer lease must be weighed against revised delivery and cost sharing. $INIO is the engine-supply expression; $DPC is the slower turbine-component expansion. These are research rankings, not a statement of the owner’s holdings or position sizes.
Core Candidates — $IREN, $HUT, $APLD
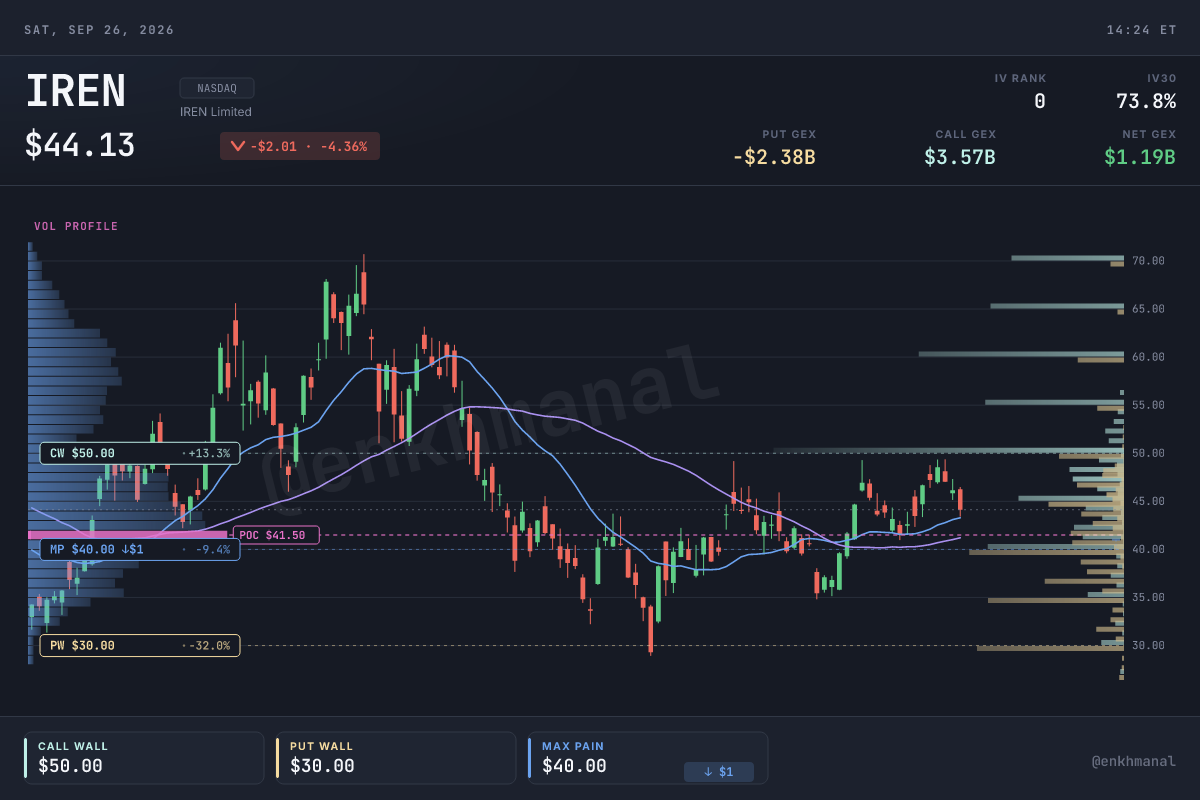
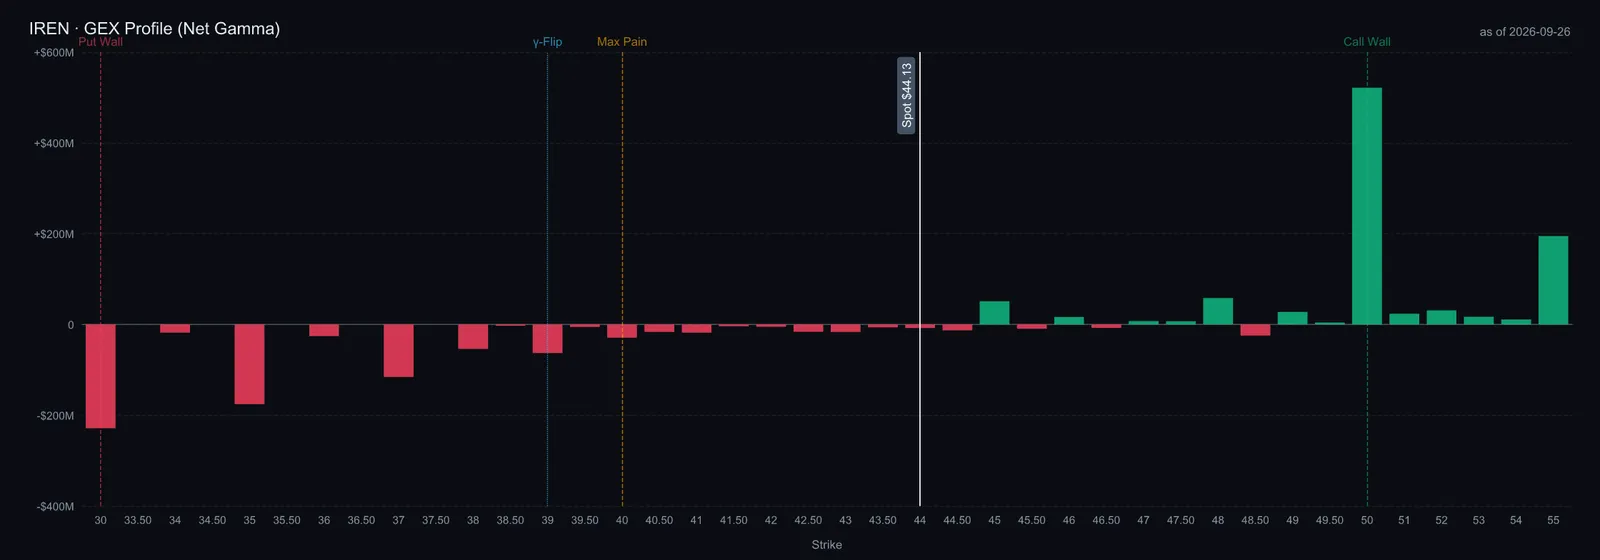
$IREN is the one that is not a landlord. It bought GPUs to run on its own 5 GW-plus of secured grid connections, and on the August 27 call reported $4 billion of contracted annualised revenue for 2026 capacity with about $1 billion operating, three-year contract pricing up about 125% since November to more than $20 million per IT megawatt, customer prepayments funding 45–55% of GPU capex, Microsoft's Horizon 1 delivered and Horizons 2–4 due in the December quarter, and a 2027 capex guide of $25–30 billion against about $19 billion of funding raised. Its 2 GW Sweetwater hub has conditional ERCOT base-load status with 300 MW under construction for late 2027. At the 25 September close, $IREN was $44.13, versus its 50-day average of $41.21 and 200-day average of $45.59. Provider EV is $19.33B. Funding, GPU obsolescence and customer credit remain the principal risks; the $4B is contracted annualized capacity revenue, not revenue already earned.
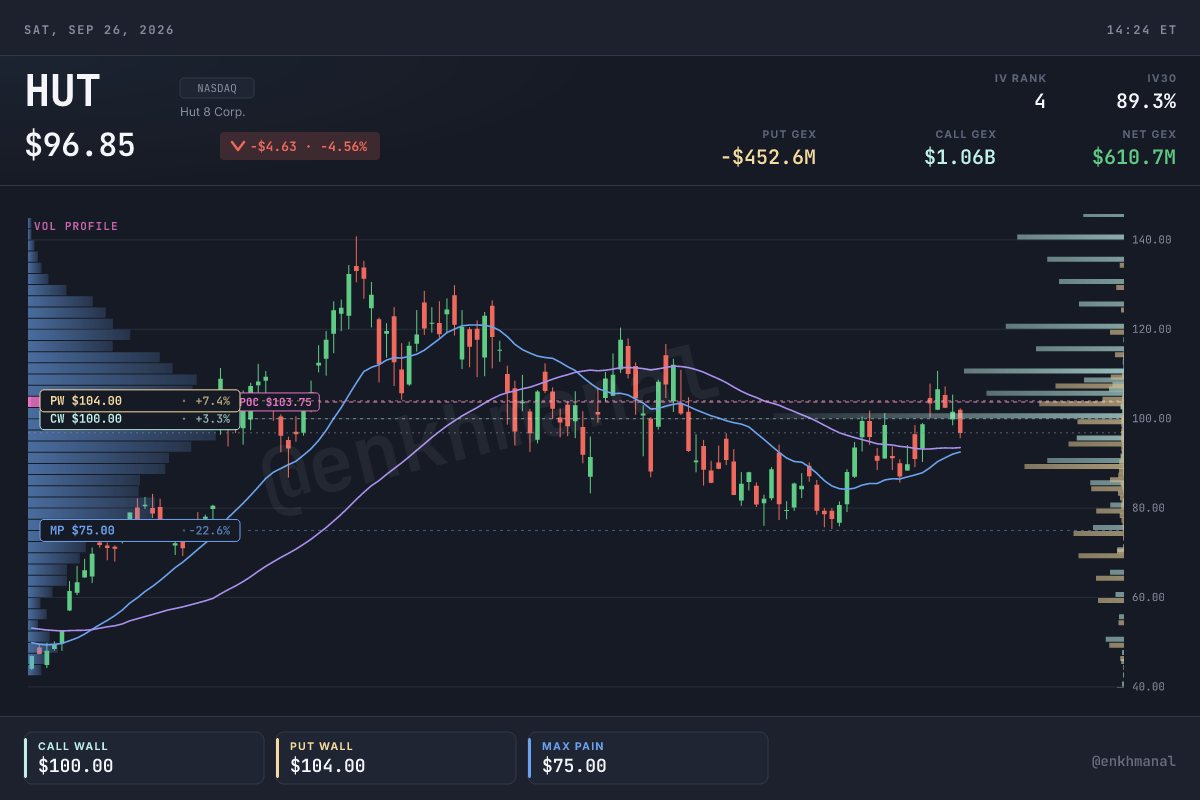
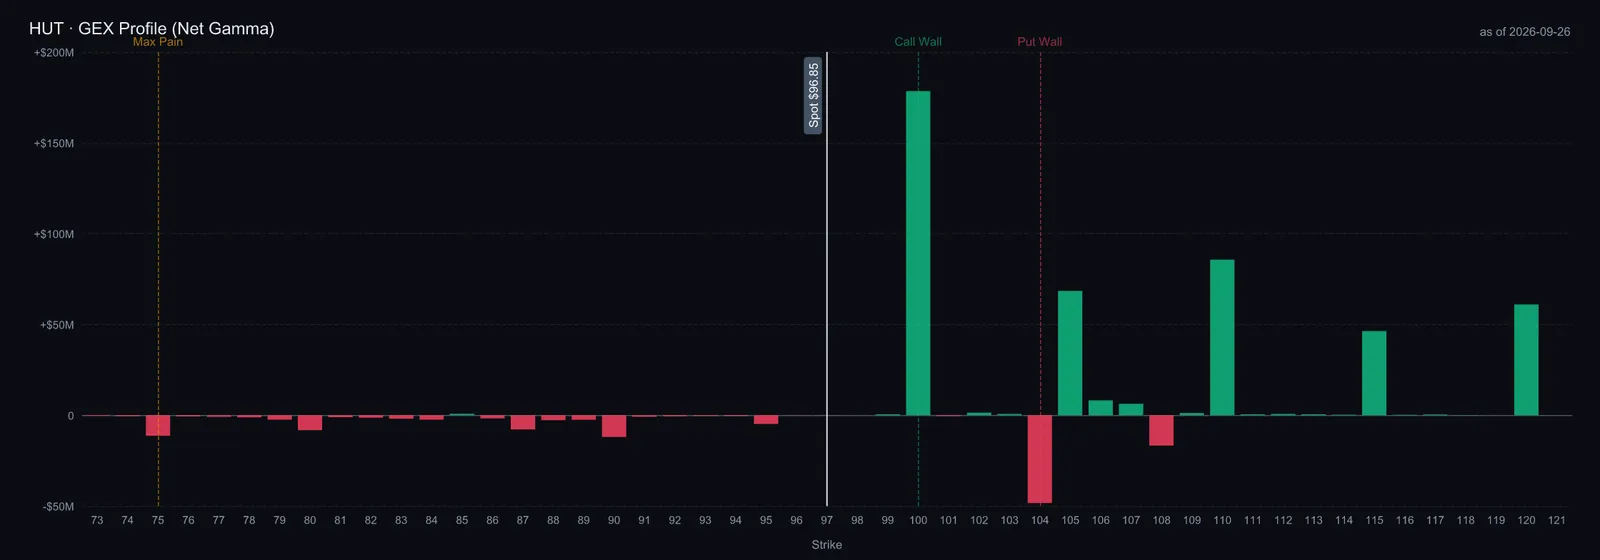
$HUT is the developer. On the August 4 call it reported the second Beacon Point lease, 352 MW of IT capacity for about $9.8 billion of base-term value, which fully commercialises a 1 GW campus, and about 949 MW of total contracted AI capacity worth roughly $26.6 billion including River Bend's investment-grade anchor; the pipeline is 8.7 GW with eleven sites under diligence averaging more than 650 MW. Initial data-hall delivery is targeted for Q2 2027 at River Bend and Q3 2027 at Beacon Point. At the 25 September close, $HUT was $96.82, versus its 50-day average of $93.53 and 200-day average of $79.09. Provider EV is $19.68B, or $20.7M per disclosed contracted IT MW.
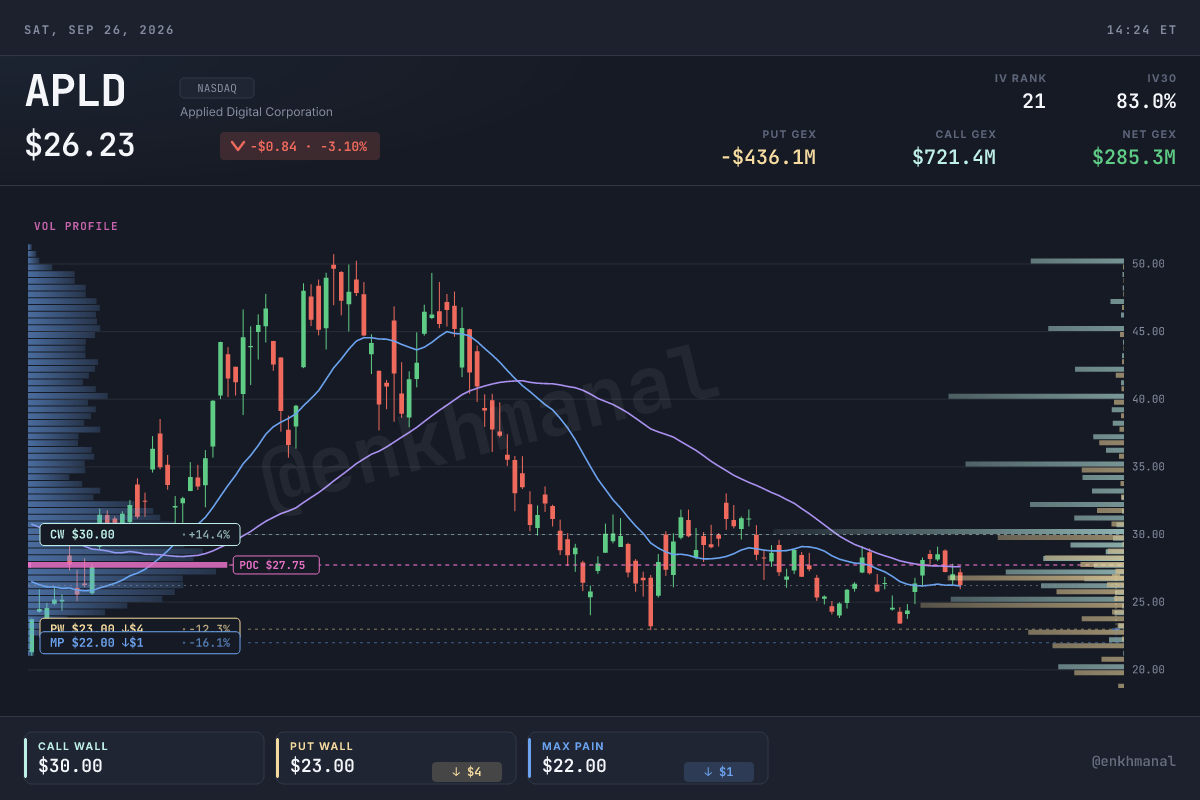
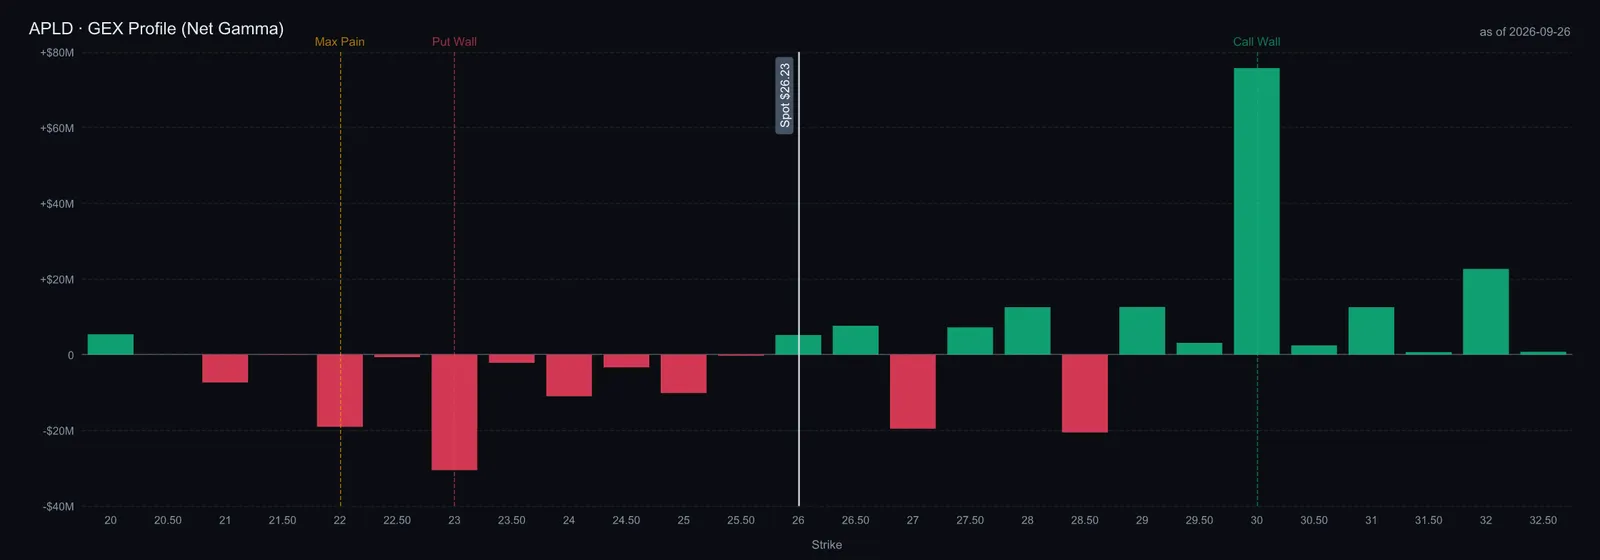
$APLD has the most contracted megawatts. On the July 27 call it reported leases on five campuses, 1.41 GW of contracted critical IT and about $36 billion of contracted lease value, roughly $20 billion of it from one investment-grade hyperscaler across Delta Forge 1 and 2 and Polaris Forge 3, 100 MW delivered in the year, and line of sight to more than 5 GW on existing campuses through 2032 with Base Electron adding generation. At the 25 September close, $APLD was $26.25, versus its 50-day average of $27.61 and 200-day average of $32.22. Provider EV is $13.19B, or $9.4M per disclosed contracted IT MW. The July results also disclose 175 MW live after the second building’s first phase became ready for service. A below-average share price is a timing warning, not evidence that the signed leases disappeared; tenant concentration and funding must still be monitored.
The Watches — $CORZ, $WULF, $CIFR
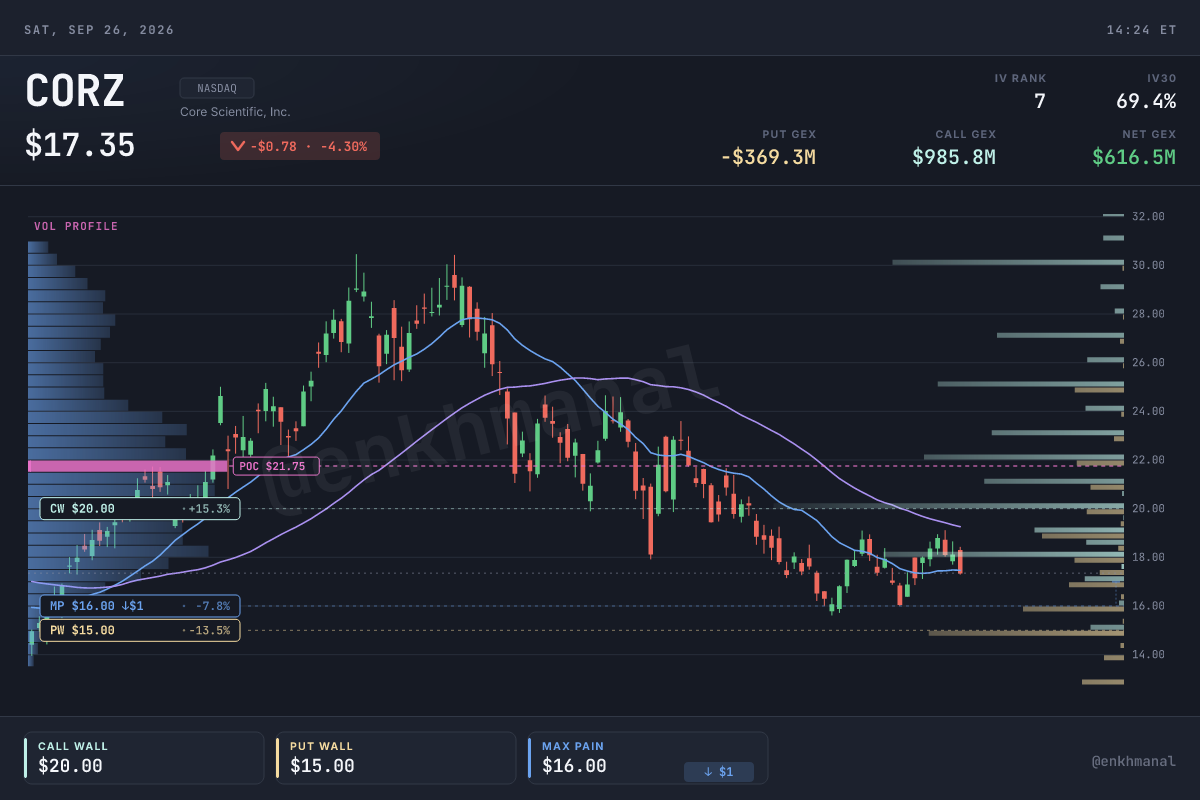
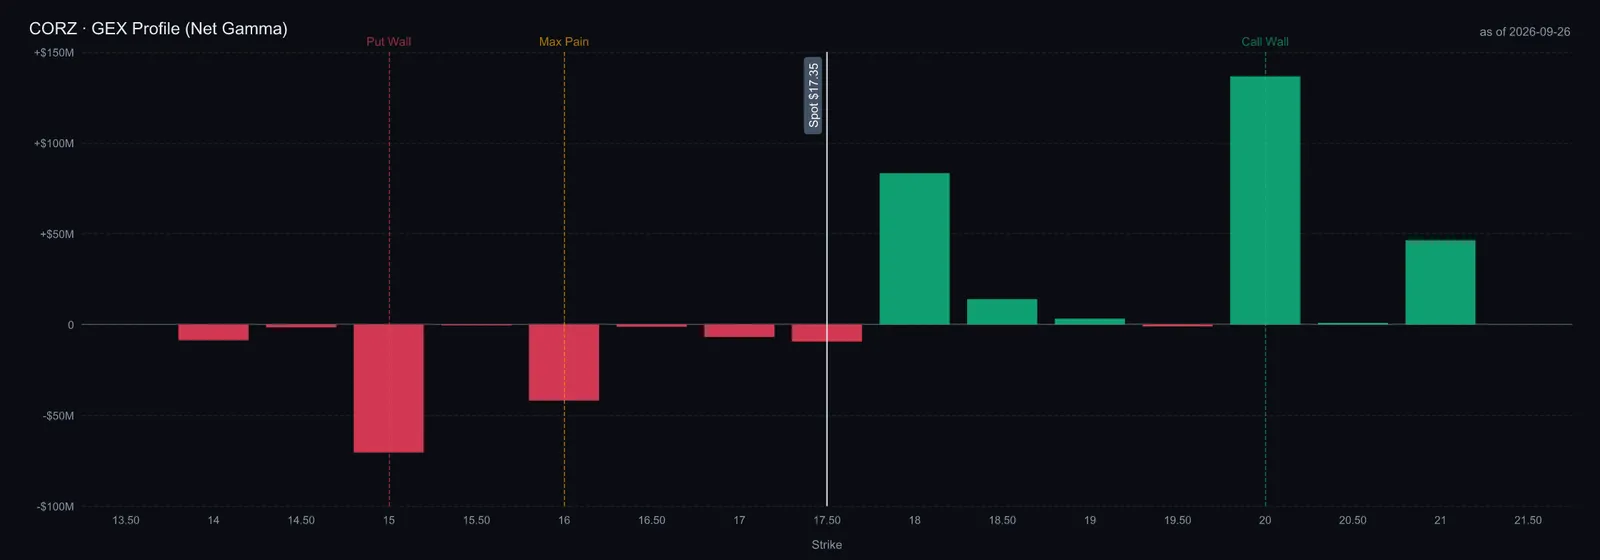
$CORZ is the most delivered and the cheapest, while its weak trend is a timing concern. On the July 28 call it reported 590 MW contracted to CoreWeave, a 530 MW agreement with $AMD across five sites (380 MW triple-net to $AMD directly, 150 MW to a neocloud with $AMD's full credit support for fifteen years), 437 MW already billing ahead of schedule, more than $24 billion of base contracted revenue on about 1 GW of billable capacity, and an $AMD reservation right on up to 2 GW more. That is substantial operating evidence. At the 25 September close, $CORZ was $17.34, versus its 50-day average of $19.26 and 200-day average of $19.80. Provider EV is $8.21B, or $7.3M per disclosed contracted IT MW. On 25 September it appointed former CyrusOne and NTT sales executive Jay Elms as chief commercial officer; this expands commercial leadership but is not a new lease or a delivery milestone.
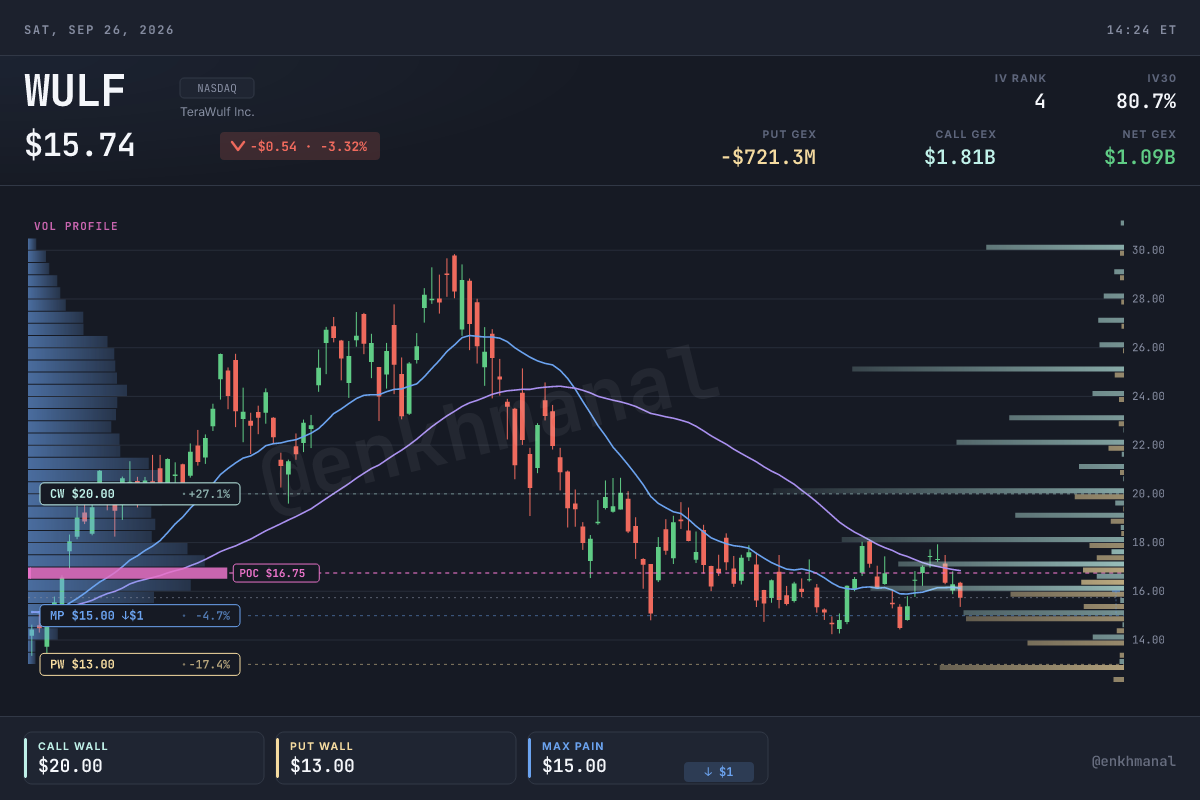
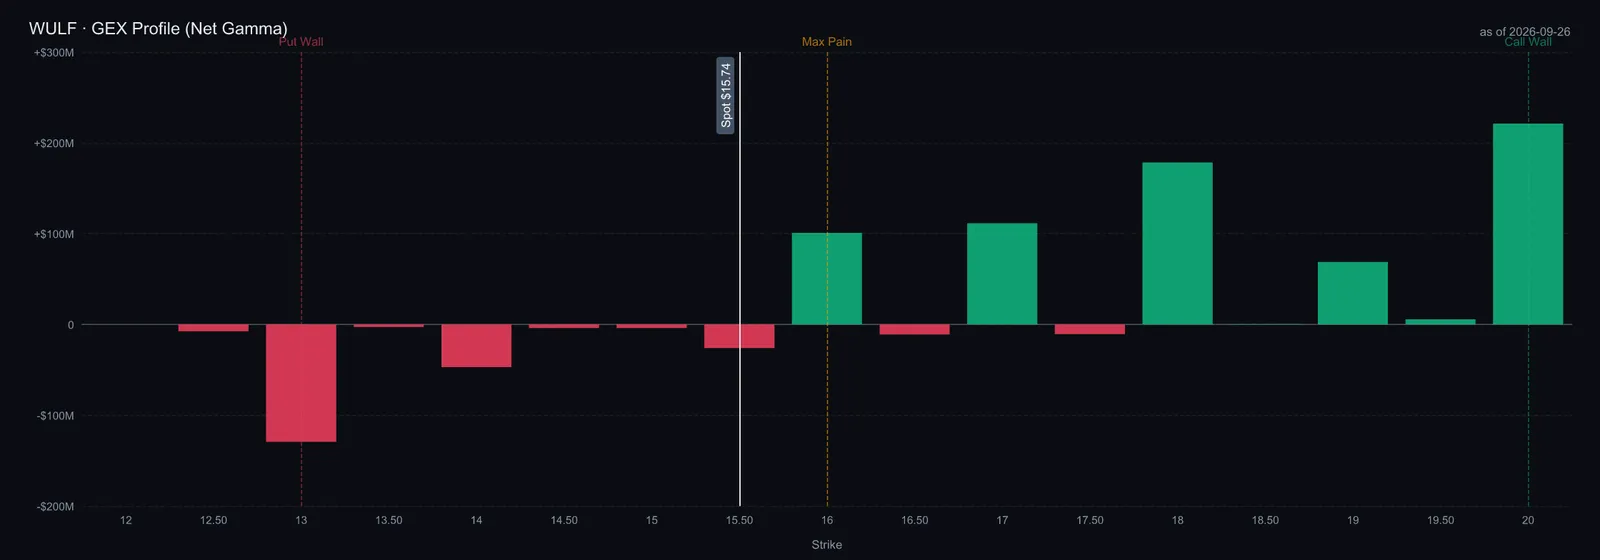
$WULF’s two Kentucky campuses must be separated. Its August results show 102 MW revenue-generating at Lake Mariner after early-July delivery of CB-3; another 336 MW was under construction, with CB-4 phased delivery in H2 2026 and CB-5 from early 2027. The $19B, 20-year Anthropic lease covers about 401 MW of IT at Justified in Hawesville, with initial delivery in H2 2027 and completion in early 2028. The Kentucky PSC subsequently approved 482 MW of power service via Big Rivers and Kenergy; TeraWulf bears project-specific power and infrastructure costs. The separate Muskie campus in Grayson has up to 1 GW contracted from Kentucky Power, with initial service in Q4 2028. The original memo wrongly assigned that later date to Anthropic. Google’s credit support for Fluidstack addresses specified Lake Mariner lease obligations; the old claim that 91% of all contracted revenue comes from one tenant is not retained after the Anthropic lease. At $15.74, WULF is below the $16.85 50-day and $18.06 200-day averages; EV is $10.47B, about $13.8M per 761 MW of the memo’s disclosed lease base.
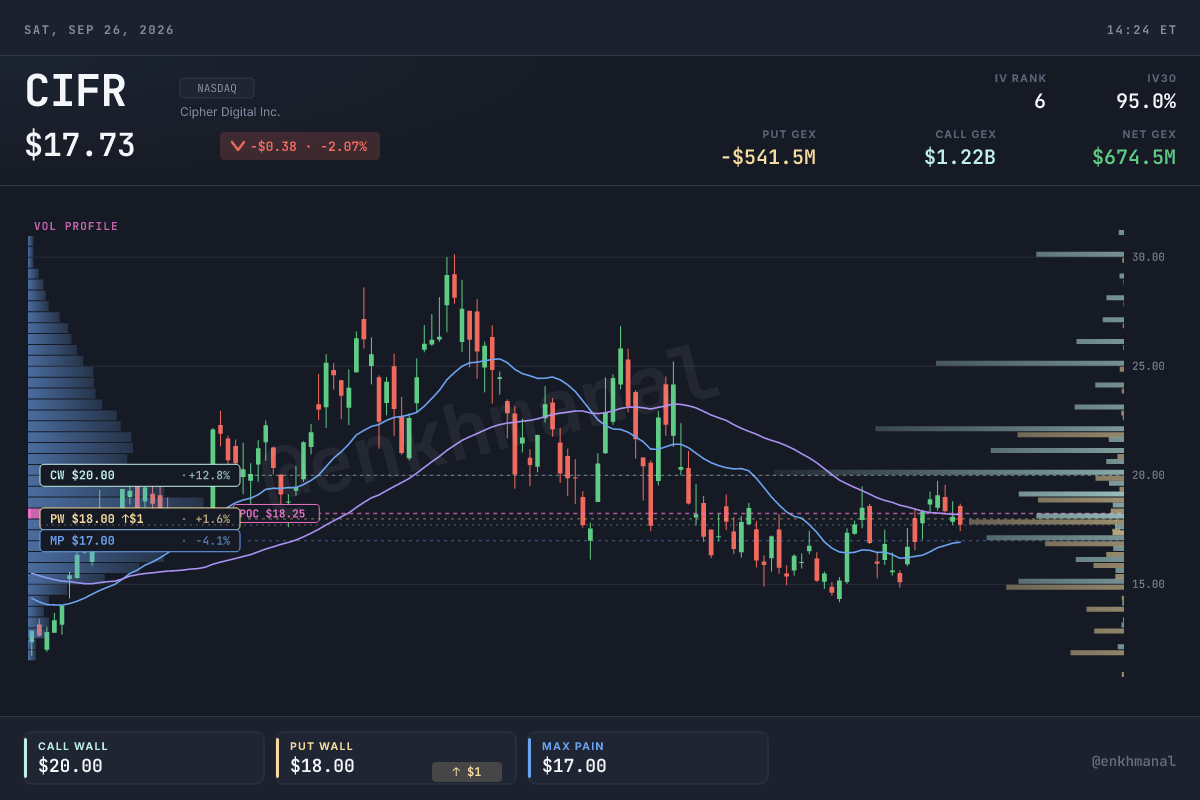
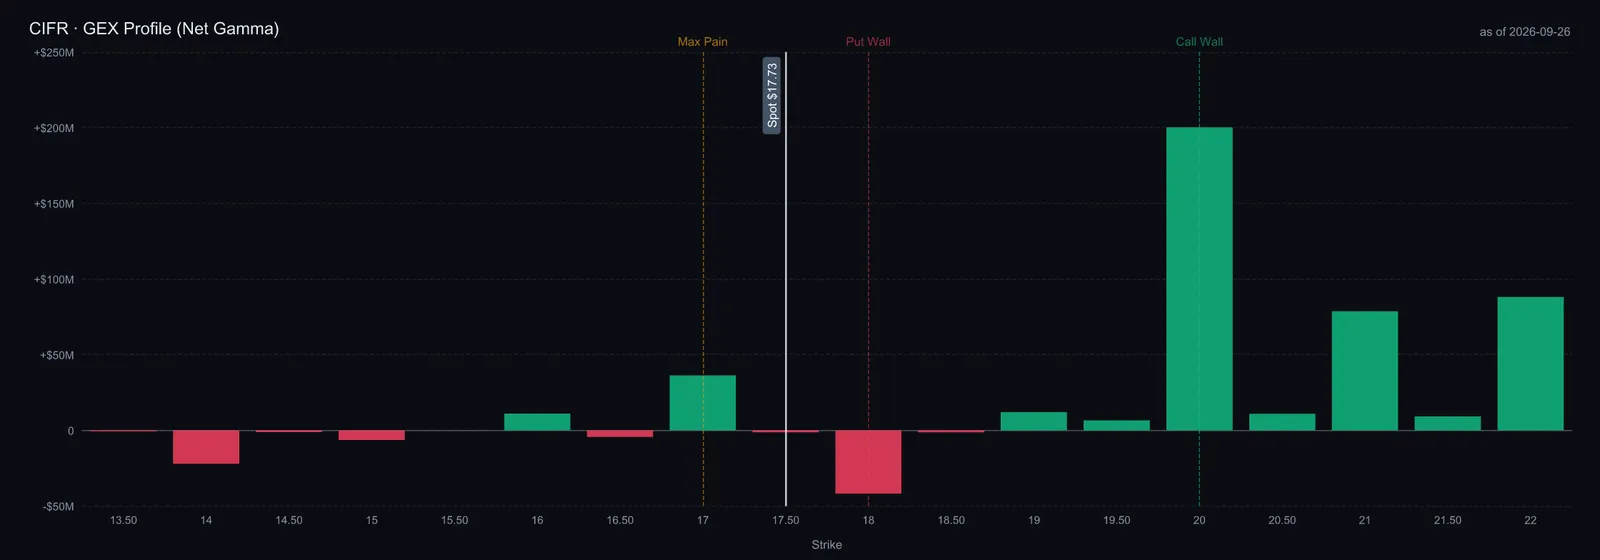
$CIFR’s 25 September update supersedes the October-only rent-start assumption. Barber Lake’s duration rises from ten to twenty years, and site contracted revenue rises from $3.8B to over $9B, including roughly $5.2B for the additional term. Halls are now scheduled for phased delivery from Q4 2026 through Q1 2027; rent begins hall by hall, with first rent expected in Q4. Cipher bears the first $359.3M above the initial budget, while the tenant reimburses 50% of costs beyond that threshold through additional rent across the twenty-year term. Longer backlog therefore comes with extra capital exposure and a changed delivery schedule, not an immediate $5.2B cash inflow. The August portfolio disclosure remains 5.3 GW across eleven sites and includes the 900 MW Apollo opportunity. At $17.73 the shares are below the $18.21 50-day and $18.36 200-day averages. EV of $12.14B divided by the memo’s minimum 600 MW disclosed lease denominator gives an upper-bound $20.2M/MW; undisclosed lease capacity prevents a precise comparable. Company amendment.
Peers — The Generation Layer and the Challengers
If behind-the-meter gas is the answer to the queue, the generators are the next queue, and two newly listed names sit on it. $INIO makes the 4.25 MW Jenbacher J624 that the OpenAI Shackelford campus, Oracle's VoltaGrid fleet and the 1.1 GW mega-campus order plan to use; its June 30 10-Q shows a $6.6 billion equipment backlog, $2.3 billion of second-quarter intake, data-center revenue of $232 million in the quarter, and the company is sold out through 2027 with more than 15 GW of committed business while it triples capacity to 10 GW by 2030. Using the original $0.97 EBITDA-per-share base as a dated scenario input, its refreshed EV is about 22.4× that base times the current 750M shares with 2.7× net leverage and a sponsor lock-up expiring around December 1; the full underwriting is in the companion dive, and it is the buy on this layer. $DPC, Doncasters, casts the nickel-superalloy hot-section blades and vanes for $GEV, Siemens Energy, Ansaldo and Doosan, and said on its August 11 call that industrial gas turbines are 39% of revenue, growing 42%, and that it is in "allocation mode" until a doubled German plant reaches full rate in 2029; it is net cash after a $700 million primary IPO and has refreshed EV of about $5.87B, or 31.7× the original $1.24 EBITDA-per-share base times current shares. Doncasters is the higher-quality balance sheet and the more distant kicker: 58% of it is aerospace and turbochargers, and the incremental $200 million a year from its four OEM partnerships ramps from 2029. It is a watch. These are retained memo bases, not freshly issued company guidance. INIO at $19.12 and DPC at $41.03 both trade below their 50-day averages. Neither has 200 trading days of listed history, so no 200-day average is reported.
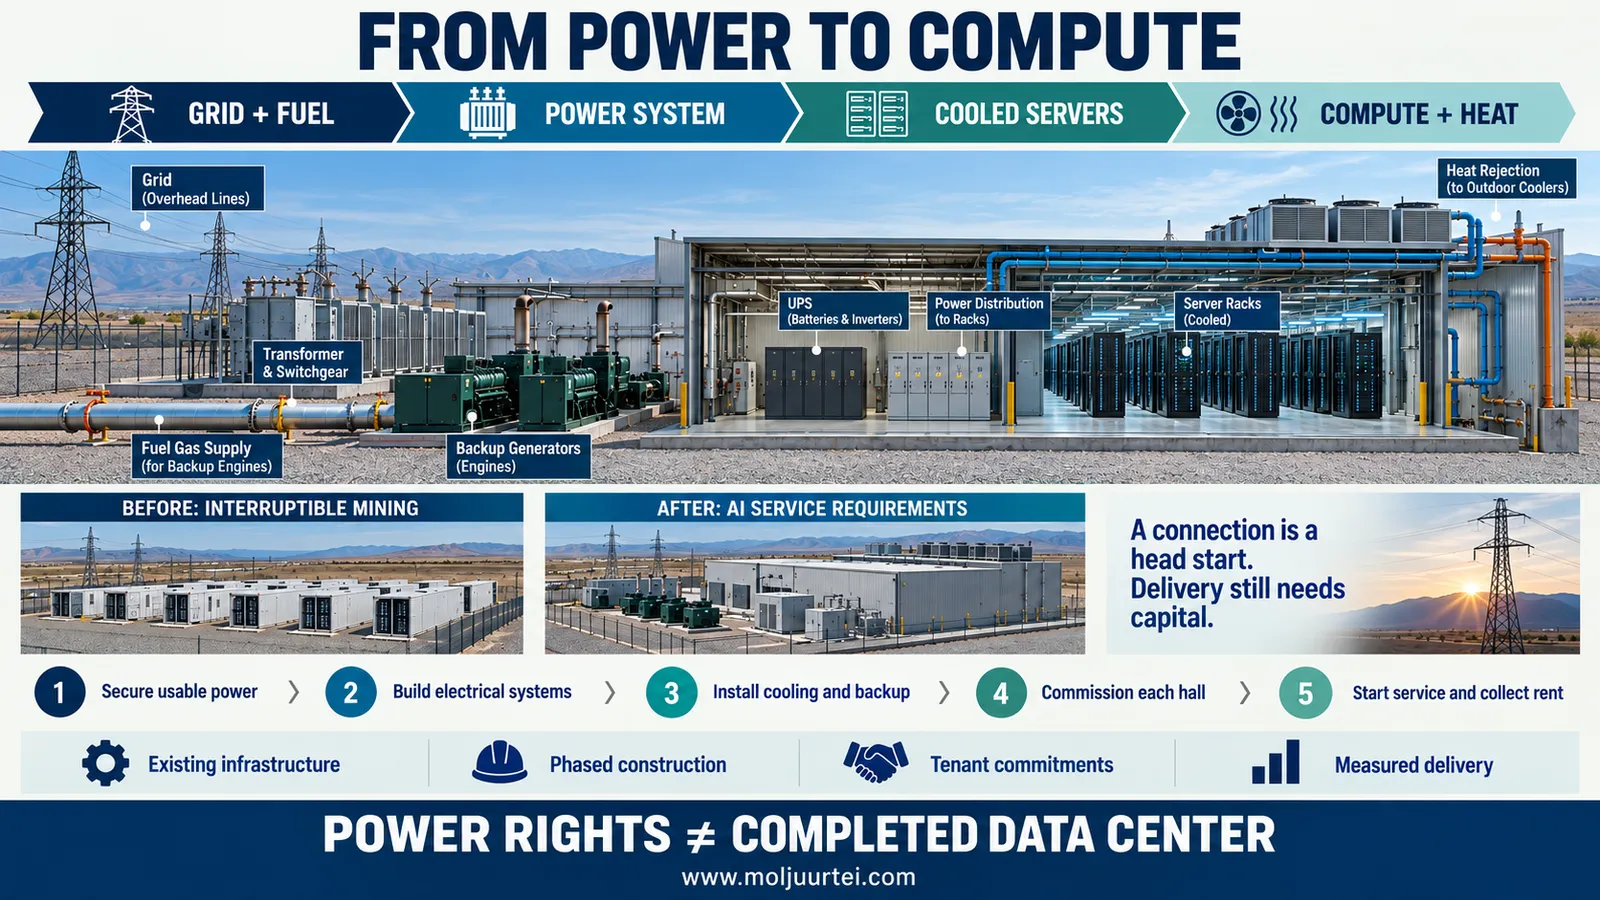
The alternatives solve different parts of the bottleneck. $GEV's turbine backlog offers exposure to new generation; its provider EV/TTM EBITDA is 63.0x. $BE's solid-oxide fuel cells offer another on-site power route, subject to fuel supply, permits and operating costs; the same provider multiple is 203.5x. $CRWV buys data-center capacity and finances computing equipment: $51.61B reported debt against $7.59B trailing revenue, with EV $94.38B. Its September convertible offering and ATM program make funding and dilution part of the underwriting. Its 17 September release also reports short-duration compute contracts at about $40M annualized revenue per MW, a different product from a landlord's rent. $DLR is a mature landlord benchmark at 27.1x provider EV/TTM EBITDA and $6.76B trailing revenue. These trailing provider metrics are not comparable to INIO/DPC's retained adjusted forward bases. High multiples alone do not invalidate acceleration, but the necessary growth and capital costs must be modeled.
Two things about the engine layer matter for the landlords specifically. The first is who else makes the machine: Caterpillar is lifting large-engine output to nearly three times 2024 levels and has a 2 GW order at the Monarch campus, Wärtsilä's US data-center book passed 1.6 GW, Enchanted Rock sells 0.5 MW gensets by the hundred to Anthropic and Meta; the supply of engines is expanding faster than the supply of substations, which is why the engine makers are a buy on growth and the landlords are a buy on scarcity, and the two are not the same trade. The second is the maintenance a fleet of them implies. The original source compares an existing 38-unit engine plant with much larger proposed fleets; the air permits now on file in West Virginia and Texas describe fleets of 500 to 900, each engine needing an intermediate service every 10,000 hours and an overhaul at 30,000, which creates frequent fleet-wide maintenance requirements, with actual frequency depending on runtime and the service schedule. A landlord who sells 99.99% availability on top of that fleet has taken on an industrial operating business it has never run, and experienced service providers, VoltaGrid and the oilfield power fleets, can be essential counterparties. That is the operating risk under the yield-on-cost ladder, and the reason the service agreement behind an engine fleet is worth reading before the lease in front of it.
Thematic Angle — The Implicit $NVDA Short and the Geographic Rotation
VanEck's sharpest line is the one the basket does not need to be true, so we state it and its limit. $NVDA's calendar-2027 data-center revenue implies about 11 GW of US capacity energized at roughly $37 billion per gigawatt; every gigawatt customers cannot energize is about $37 billion of revenue, or 6% of the total, and a 3 GW shortfall at the low end of the 15–25 GW range would be revenue roughly 18% lower than the guidance implies (Matthew Sigel, Sept 18). The offset is that chips are not geographically fixed the way substations are: a GPU that cannot be plugged in in Texas ships to a campus in the Gulf, or into the Chinese mix the export rules allow, and the powered-land landlords are paid whether the chip on the rack is a Blackwell or a Rubin. That asymmetry, land that cannot move against chips that can, is the whole reason the constrained asset earns the rent. It is not a reason to short the chip maker; it is a reason to be paid in the currency the shortage is denominated in. This is an external sensitivity argument, not a company-issued forecast or a recommendation to short NVDA. Geographic substitution also depends on the applicable export rules and customer requirements.
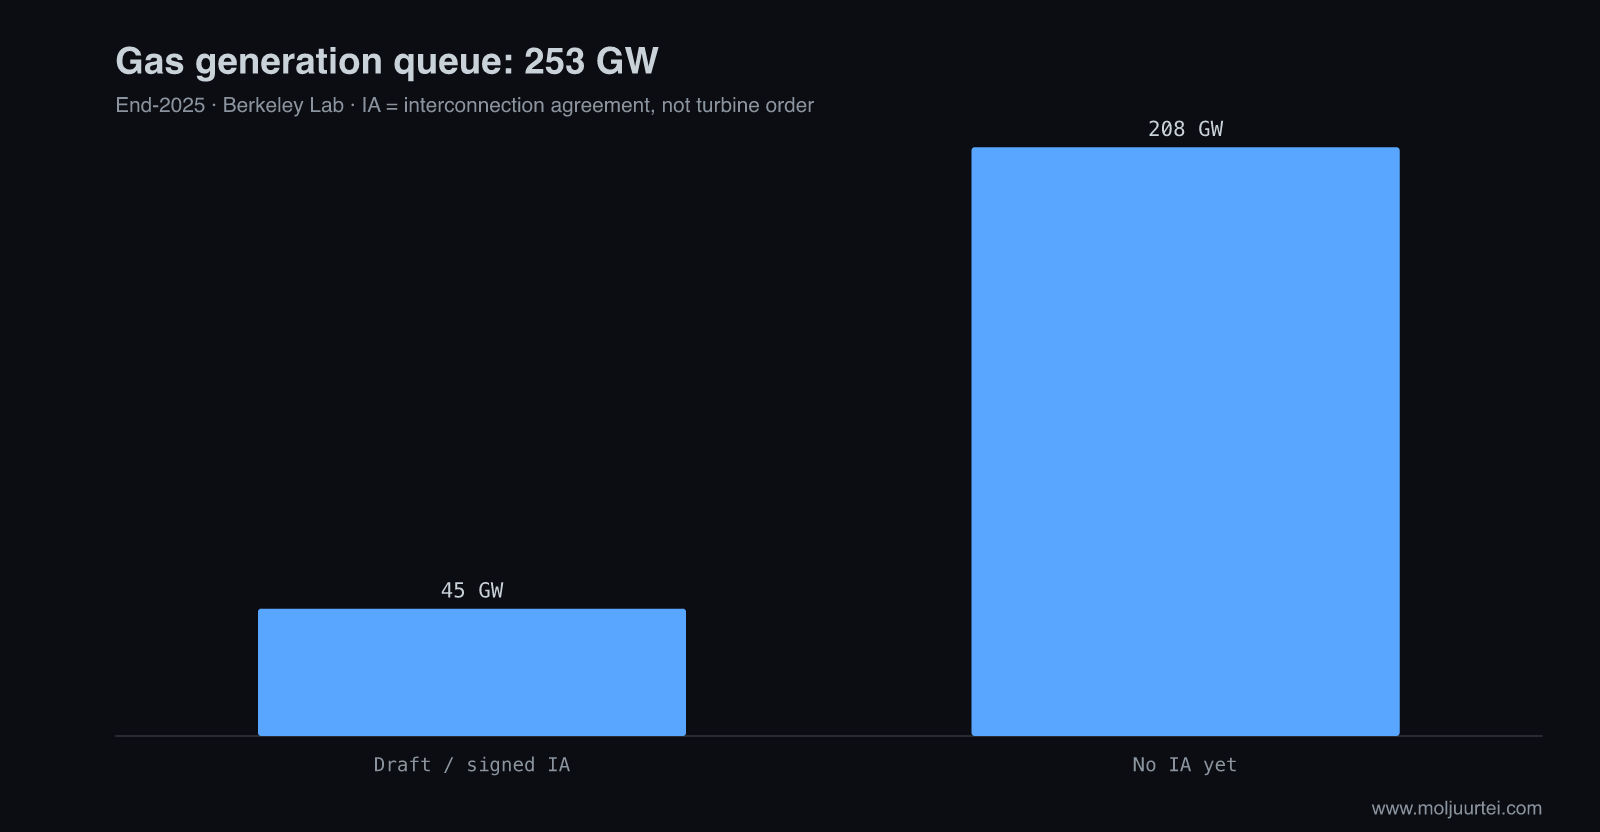
The generation queue also reveals a shift in technology mix. Berkeley Lab reports active gas capacity of 253 GW at end-2025, up 86%; solar fell 19%, storage 16% and wind 19%. About 45 GW of gas had a draft or executed interconnection agreement, roughly 18% of the gas queue. That statistic says nothing about whether a turbine has been ordered. The original regional graphic mixed generator-queue totals with data-center load classifications and mislabeled interconnection agreements as turbine contracts. The corrected chart below uses a single national generation-queue denominator. Regional advantages still depend on transmission, fuel, permits, land and customer latency needs, not merely the size of a queue.
The scale of what has already been signed is the other half of the angle. Bernstein counts seventeen deals worth more than $110 billion over two years contracting about 6 GW of power to AI tenants, and projects the AI revenue across its miner coverage growing ninefold, from $1.2 billion in 2026 to $10.7 billion by 2030; H.C. Wainwright's tally on September 14 was more than $160 billion of AI colocation deals signed by bitcoin miners to date. Note the tense: almost all of it is future, and VanEck itself flagged in June that the industry had delivered about a quarter of the AI capacity it had leased, with execution rather than signing becoming the next premium. That is the arithmetic behind ranking on delivery. A fully delivered gigawatt at $1.9 million per MW-year can generate $1.9 billion of annual rent, but phased hall deliveries and contract terms determine when revenue and cash actually begin, but the market must still price financing, delivery and collection risk.
Latest Earnings — The Filed Numbers Behind the Megawatts
$CORZ is the name where the pivot is furthest along in the filings, so it is the one whose statements illustrate one possible transition path. Revenue was $640 million in 2022, $502 million in 2023, $511 million in 2024 and $319 million in 2025 as the company shrank its mining fleet to make room for colocation, and gross margin ran 1.3%, 24.6%, 23.7% and 11.9% over those years; the first half of 2026 annualises to about $560 million of revenue at a 35.8% gross margin. The quarterly series is where the business changes shape: revenue of $79.5 million in the March 2025 quarter and $78.6 million in June 2025 at gross margins of 10.3% and 6.4%, then $115.2 million in March 2026 and $164.2 million in June 2026 at gross margins of 26.1% and 42.7%, with adjusted EBITDA of $41.1 million in the June quarter against $28.5 million a year earlier. Two years of falling revenue and one year of rising margin is what a landlord replacing a miner looks like on paper, and it is the sequence every name in the basket is somewhere along.
Table terminology: FY26.
Table terminology: Q1; Q2; EBITDA.
The mix is the memo in one row: colocation was 13% of revenue in the June 2025 quarter and 83% of revenue a year later, self-mining went from 79% of revenue to 13%, so colocation produced more than all of the $85.6 million of year-on-year growth while mining gave back $40.9 million. Cash tells the same story the deposits told at $INIO. Adjusted EBITDA was $41.1 million in the June quarter and $50.0 million for the half, against a GAAP net loss of $1.50 billion for the half, $1.08 billion of which was the non-cash mark on warrants and contingent value rights as the share price rose; operating cash flow was $249.9 million in the March quarter alone on $4.4 million of adjusted EBITDA, because customers prepaid, and deferred revenue stood at $654 million on the June balance sheet. Capital expenditure was $954 million in the half against $205 million a year earlier, so free cash flow was deeply negative and the difference is the $4.4 billion of debt on the balance sheet. That is the shape of every landlord in this basket in 2026: the tenant's deposits fund the working capital, the lenders fund the halls, while the income statement increasingly recognizes rent as each hall starts service.
Management & Track Record
Table terminology: ARR.
These management teams are expanding into much larger AI facilities than their historical mining operations. Delivered capacity matters, but so do the engineering and operating partners behind it. CORZ’s 437 MW billing, WULF’s 102 MW revenue-generating capacity and APLD’s 175 MW live capacity are distinct dated disclosures, not measures of identical project scope. CORZ’s new chief commercial officer adds data-center customer experience. The updated share-price trends are mixed, so a strong past delivery record should not be described as automatic stock-market leadership. The next test is whether each team meets its revised schedule within the funded budget.
Risks & What Breaks It
The thesis weakens with an unfunded cost increase, delivery delay, tenant payment problem or loss of usable power rights. It strengthens when Barber Lake begins collecting rent under its revised Q4 schedule, Microsoft accepts IREN’s next Horizon phases, WULF commissions its next halls and ERCOT verifies the relevant projects. These milestones matter more than assumed November earnings dates; no unconfirmed reporting date is treated as fixed.
Valuation & House View
At 25 September prices, the five comparable lease operators span $7.3M–$20.7M of EV per disclosed contracted IT MW, a 2.8x range. The ratio includes corporate debt and assets, but omits remaining construction capex and differences in guarantees, delivery and gross-versus-IT power. It is not directly comparable with Aligned's operating-plus-planned capacity or a construction-cost quote. The following table retains the original per-share operating bases and exit multiples, updates only the entry price, and computes the two-year CAGR needed for a 15% annual share-price return. Formula: sqrt(price × 1.15² / (base per share × exit multiple)) − 1. Because it ignores net debt and funding dilution, it is a sensitivity screen, not an enterprise valuation or evidence that one leveraged company is cheap. CIFR's old rent base is explicitly retained and does not annualize the newly extended second decade.
Table terminology: CAGR.
The screen shows how strongly the result depends on the chosen metric and exit multiple. A negative required growth rate for a landlord does not mean delivered rent is already guaranteed or that debt can be ignored. INIO’s engine backlog and DPC’s later capacity expansion require different timing assumptions. GEV and BE need large earnings growth under the selected lower multiples, but the screen alone cannot reject their structural opportunities. The next valuation step is a funded cash-flow model for each project, with delivery dates, customer credit, remaining capex, debt and diluted shares made explicit.
The original $IREN scenarios remain $82/$60/$28 with 30%/45%/25% weights, giving $58.60 weighted future value, or +32.8% from $44.125. They are illustrative end-2027 outcomes, not present value or a newly rebuilt diluted-share model. The central shortlist remains IREN, HUT and APLD, with INIO for engine supply; current momentum and funding conditions should determine the entry plan. CORZ, WULF and CIFR remain active delivery watches. The earlier equal-weight construction was an illustration, not an instruction about the owner’s portfolio. Monitor revised Barber Lake rent commencement, Horizon acceptance and WULF commissioning; do not replace these with unconfirmed earnings dates or a generic generator-queue completion rate.