Penguin Solutions: the capacity tier of the inference stack, and what the guide already says
An AI model must remember earlier context while generating its next answer. Its KV cache stores intermediate keys and values from that context, avoiding some repeated computation. Keeping everything in the fastest memory beside the GPU is expensive and capacity-limited. Penguin Solutions ($PENG) sells memory modules, expansion systems and the integration needed to put reusable context in additional memory tiers. The investment question is whether that role can outlast today’s DRAM pricing upswing.
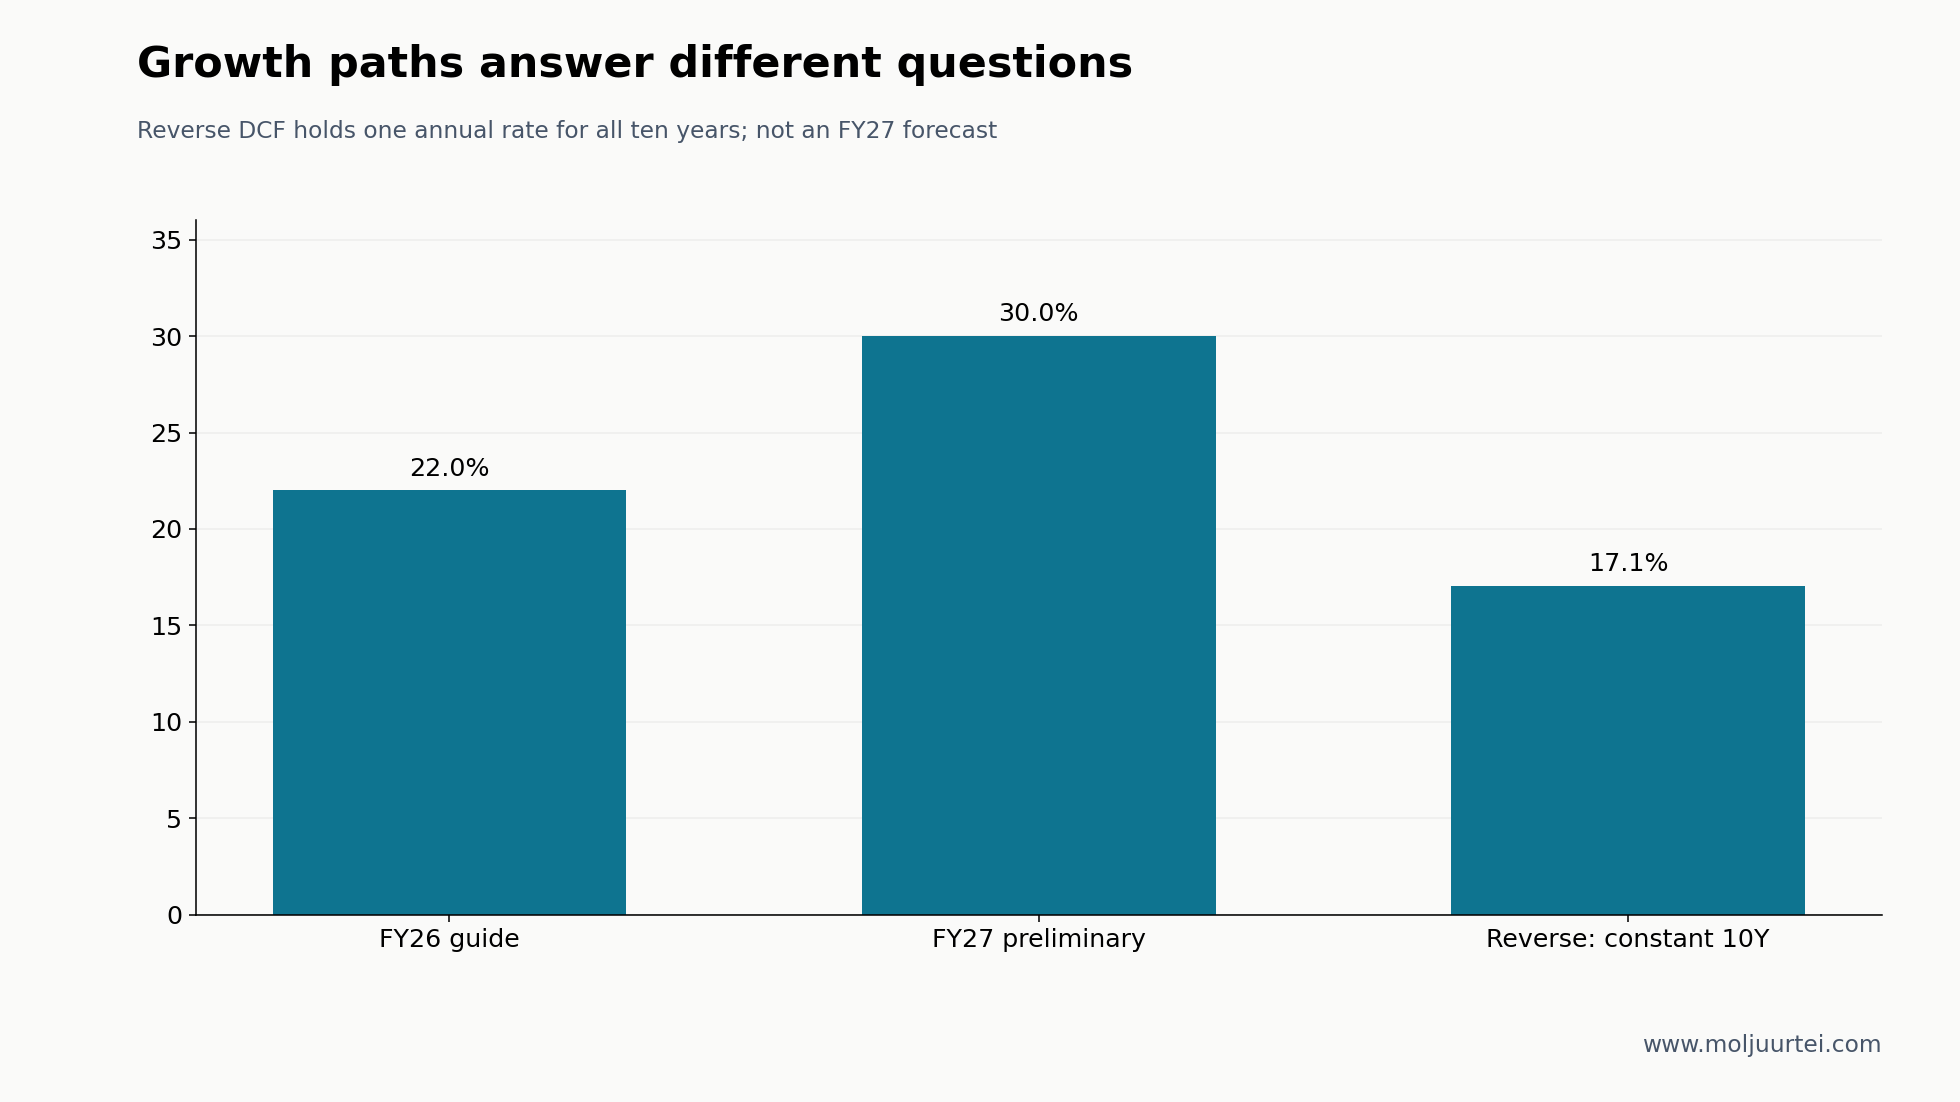
The September 25 close is $56.22. July’s FY26 sales outlook remains 22% ±2%; approximately 30% FY27 sales and adjusted-EPS growth is still a preliminary planning view. The refreshed ten-year model gives $74.91 by perpetuity and $202.05 at a 35.0× peer exit. Those are different assumptions about distant cash flows, not interchangeable price targets.
What Changed
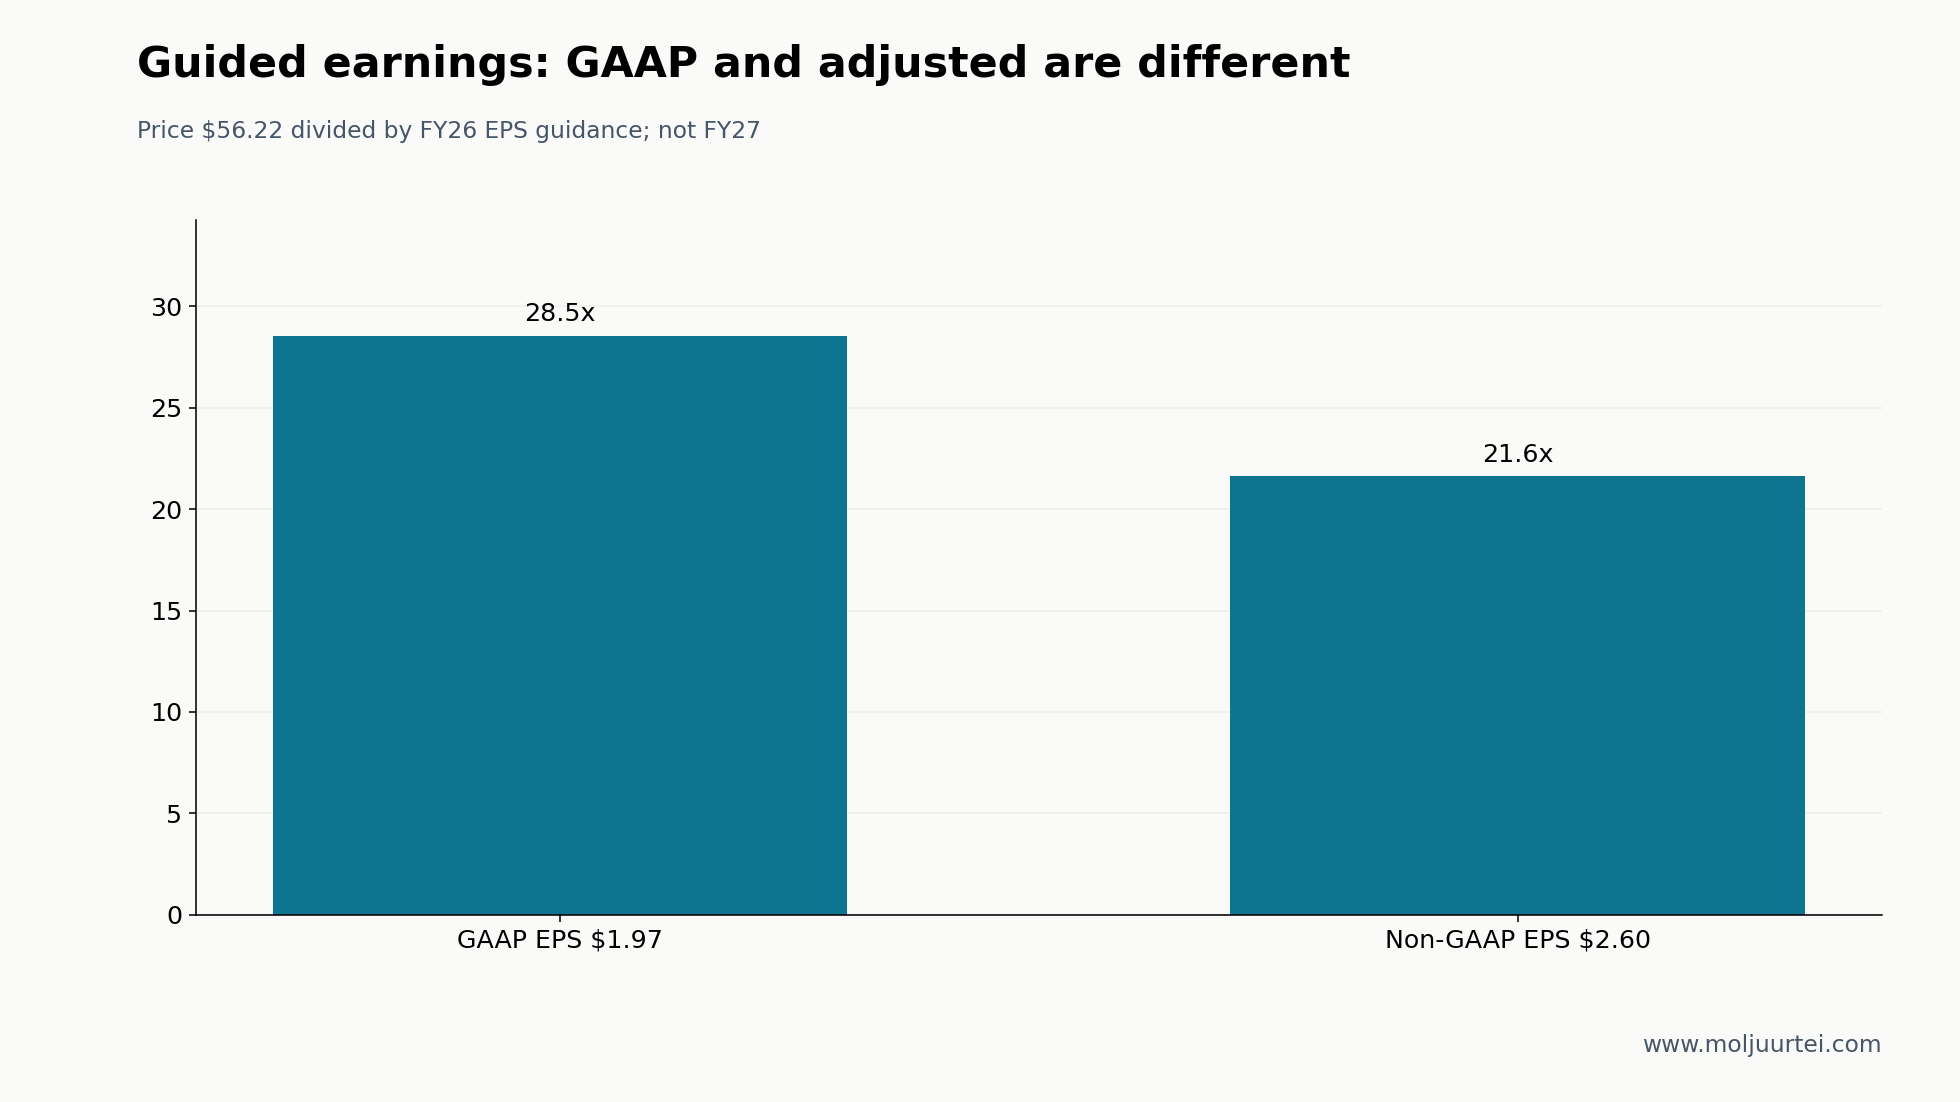
The latest reported quarter remains Q3 FY26, ended May 29 and released July 7: sales $478.713M, +47.6% year on year and +39.6% sequentially. GAAP operating income was $50.863M and diluted EPS $0.68. Full-year guidance rose for the second time to sales growth 22% ±2%, GAAP EPS $1.97 ±$0.05 and non-GAAP EPS $2.60 ±$0.05. Integrated Memory’s FY26 growth outlook was 90–95%. Q3 results.
The next report is now dated: October 6 at 4:30 p.m. Eastern, covering Q4 and the fiscal year ended August 28. It should test the implied Q4 sales midpoint of about $505.2M and clarify the preliminary FY27 view. July’s call contemplated approximately 30% growth in both sales and non-GAAP EPS. Its roughly 62M Q4 non-GAAP diluted-share assumption preceded the July 17 refinancing; that later transaction cannot explain a statement made ten days earlier. Earnings schedule.
September 9 added a commercial proof point: Lektra selected Penguin’s full-stack platform for distributed AI data centers, combining reference architecture, NVIDIA-based compute, integration and managed support. Lektra described eight already-deployed sites and facilities generally at 20MW or less. That is Lektra’s footprint, not eight newly delivered Penguin contracts. No contract value or revenue contribution was disclosed. Lektra announcement.
The July financing closed at $750M, after an initial $650M pricing and a $100M option exercise. It refinanced older debt, funded hedges and left corporate liquidity; it was not simply $750M of fresh cash for inventory. Hedging and CFO turnover may have affected trading, but the evidence does not establish that they alone caused the drawdown. Financing close.
Thesis
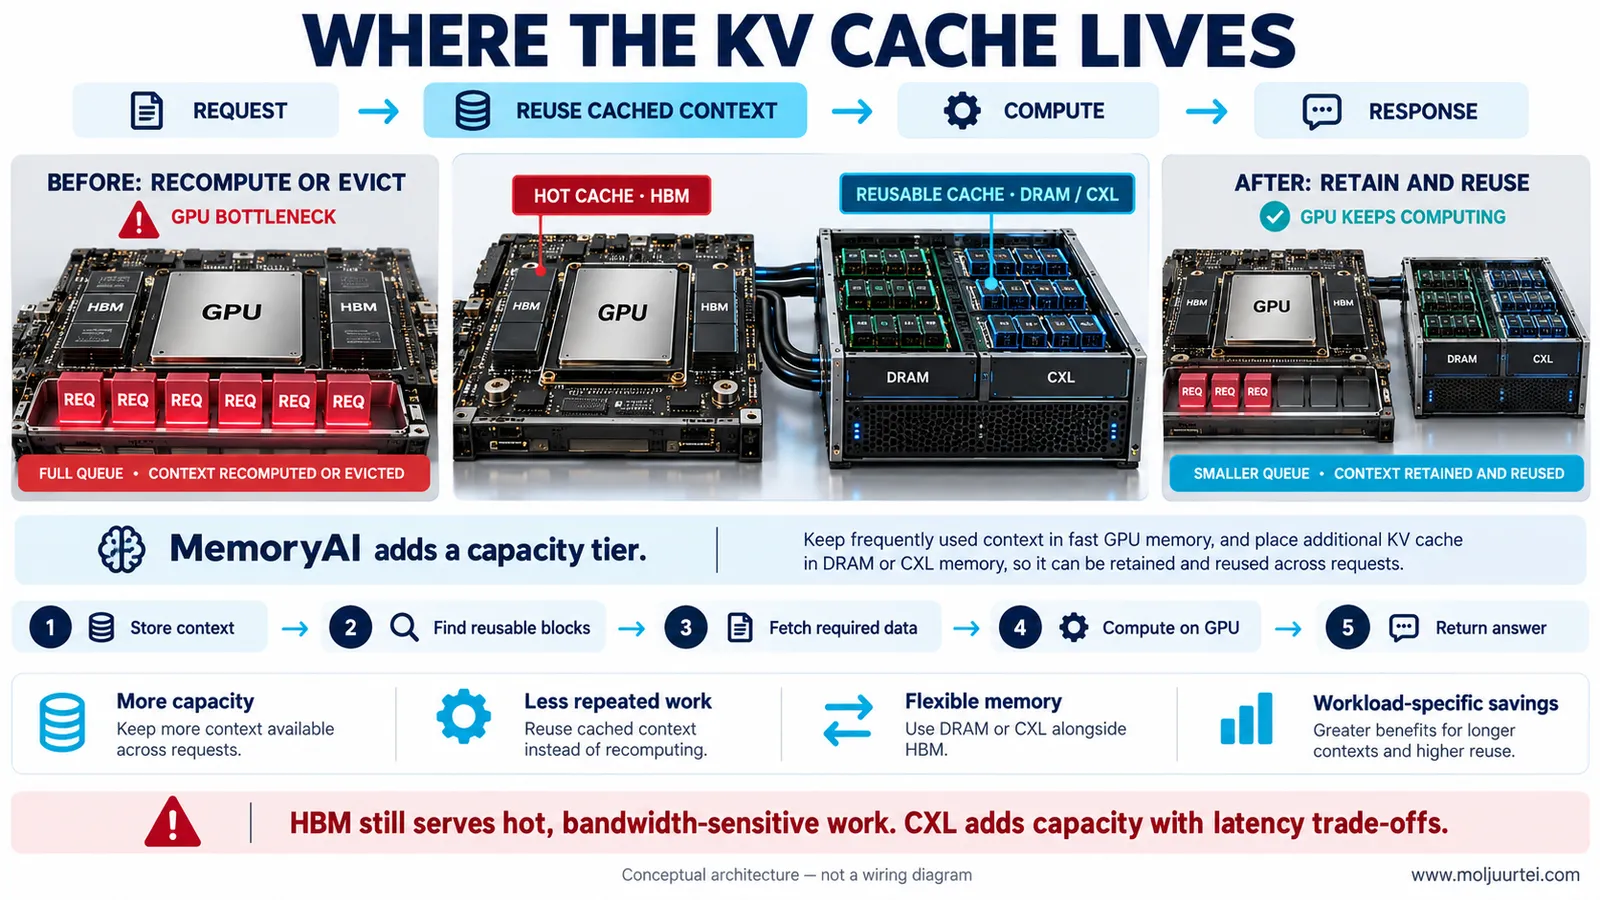
Inference infrastructure is being divided into memory tiers with different costs, capacities and access speeds. Long contexts and concurrent users enlarge the KV cache. Frequently accessed, bandwidth-sensitive cache can still need HBM; less active or reusable blocks can be retained elsewhere if the software manages movement and latency. SMART Modular’s CXL cards and MemoryAI server address that additional capacity. Management’s claim of four to five times HBM’s cost-effectiveness describes its targeted use case, not universal equivalence to HBM.
A second, larger engine today is conventional server memory. AI infrastructure needs ordinary DRAM as well as specialized accelerator memory. A module maker can grow dollar sales by passing higher chip costs through, even while gross-margin percentage falls. The thesis therefore has two clocks: the near-term DRAM cycle and the longer-term adoption of qualified memory systems and software. CXL is a growing minority of memory revenue, so the current 111% segment growth cannot be credited entirely to CXL.
The opportunity is for Penguin to earn more from qualification, integration and recurring operations as AI deployments broaden beyond hyperscalers. The disconfirming evidence would be customers failing to expand, margins falling faster than sales grow, or cash tied in inventory failing to return when pricing normalizes. A lower stock price alone proves neither the opportunity nor the explanation for it.
Business & Backdrop
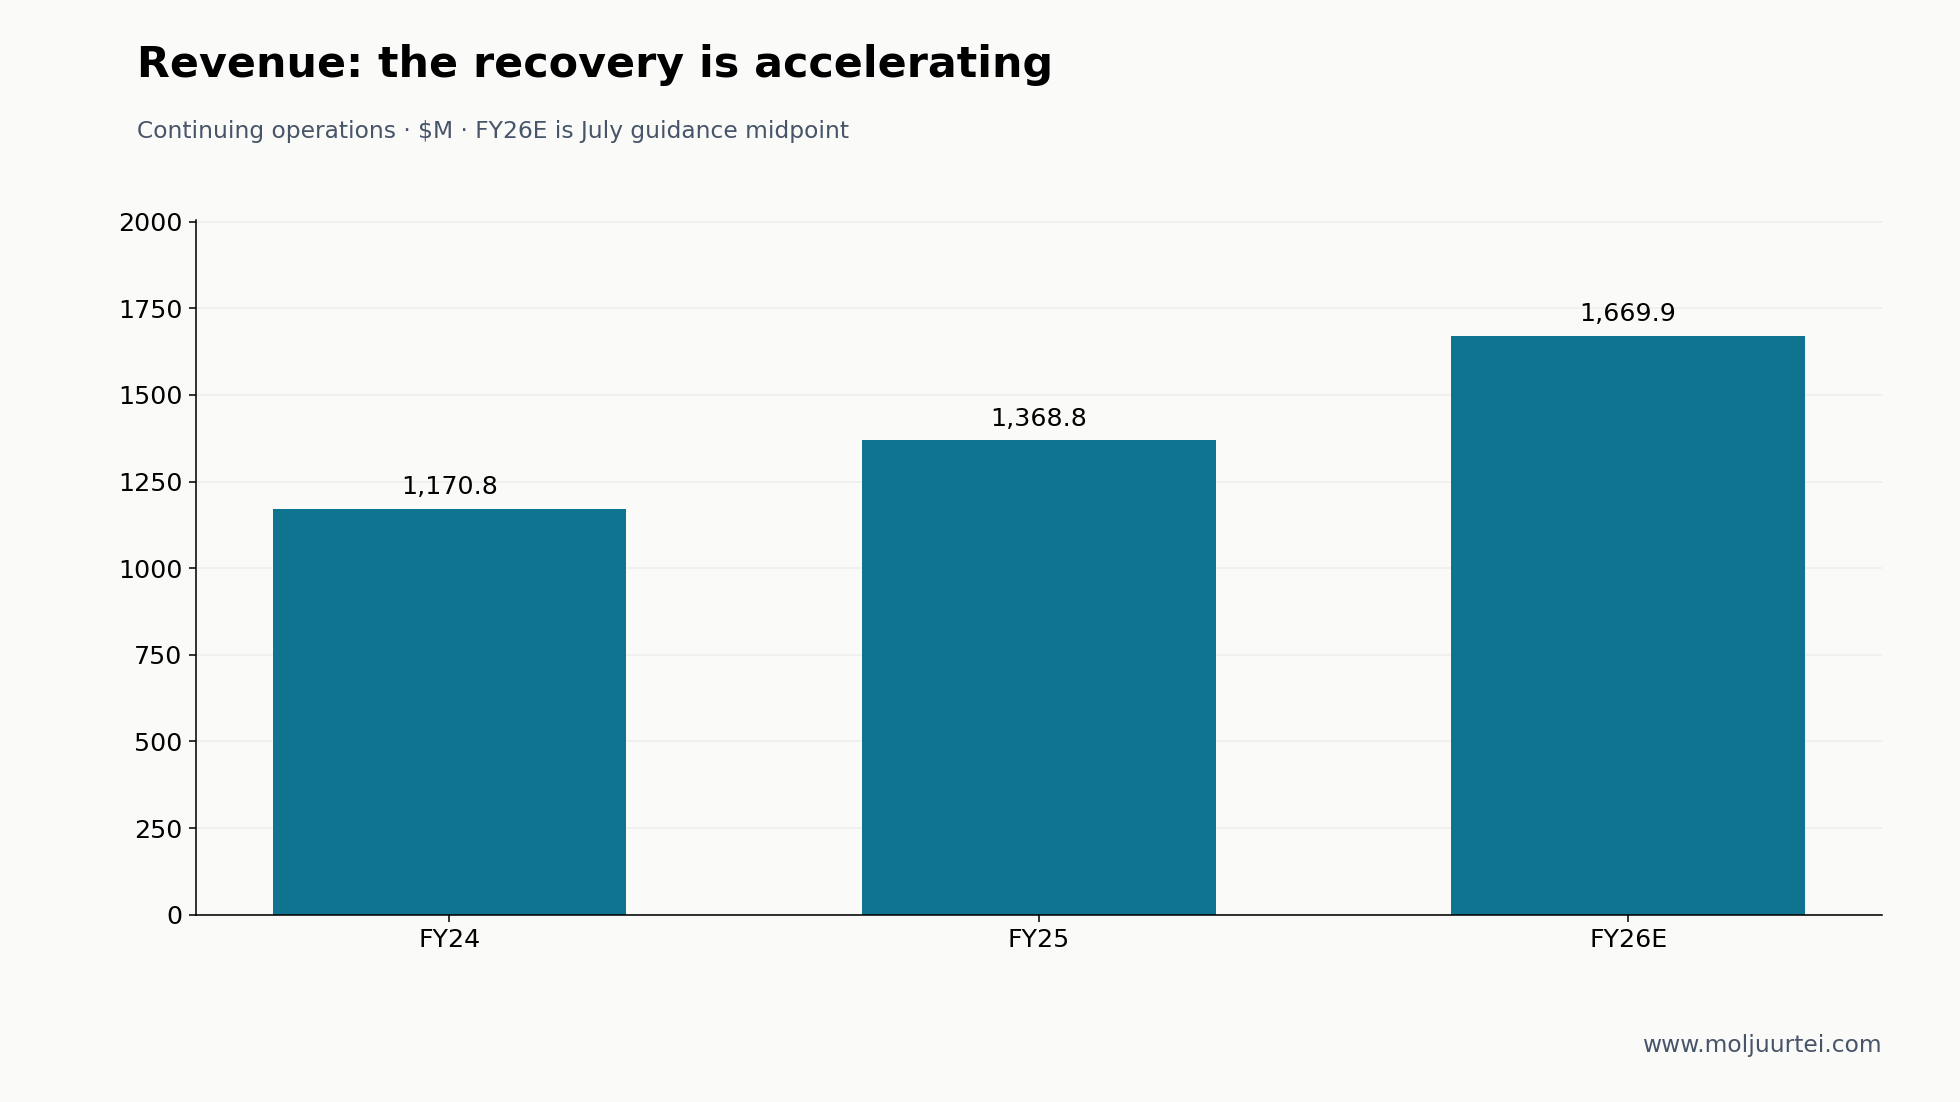
Three businesses share the balance sheet. Advanced Computing designs, builds and manages AI/HPC systems and includes Stratus fault-tolerant computing; hyperscale hardware and Penguin Edge have been wound down. Integrated Memory is SMART Modular’s specialty DRAM and flash modules, now including CXL products. Optimized LED is Cree LED, with an outsourced, capital-light manufacturing model. FY25 sales were approximately $1,369M: $648M computing, $464M memory and $256M LED; segment operating income was roughly $115M, $44M and $9M before corporate expenses.
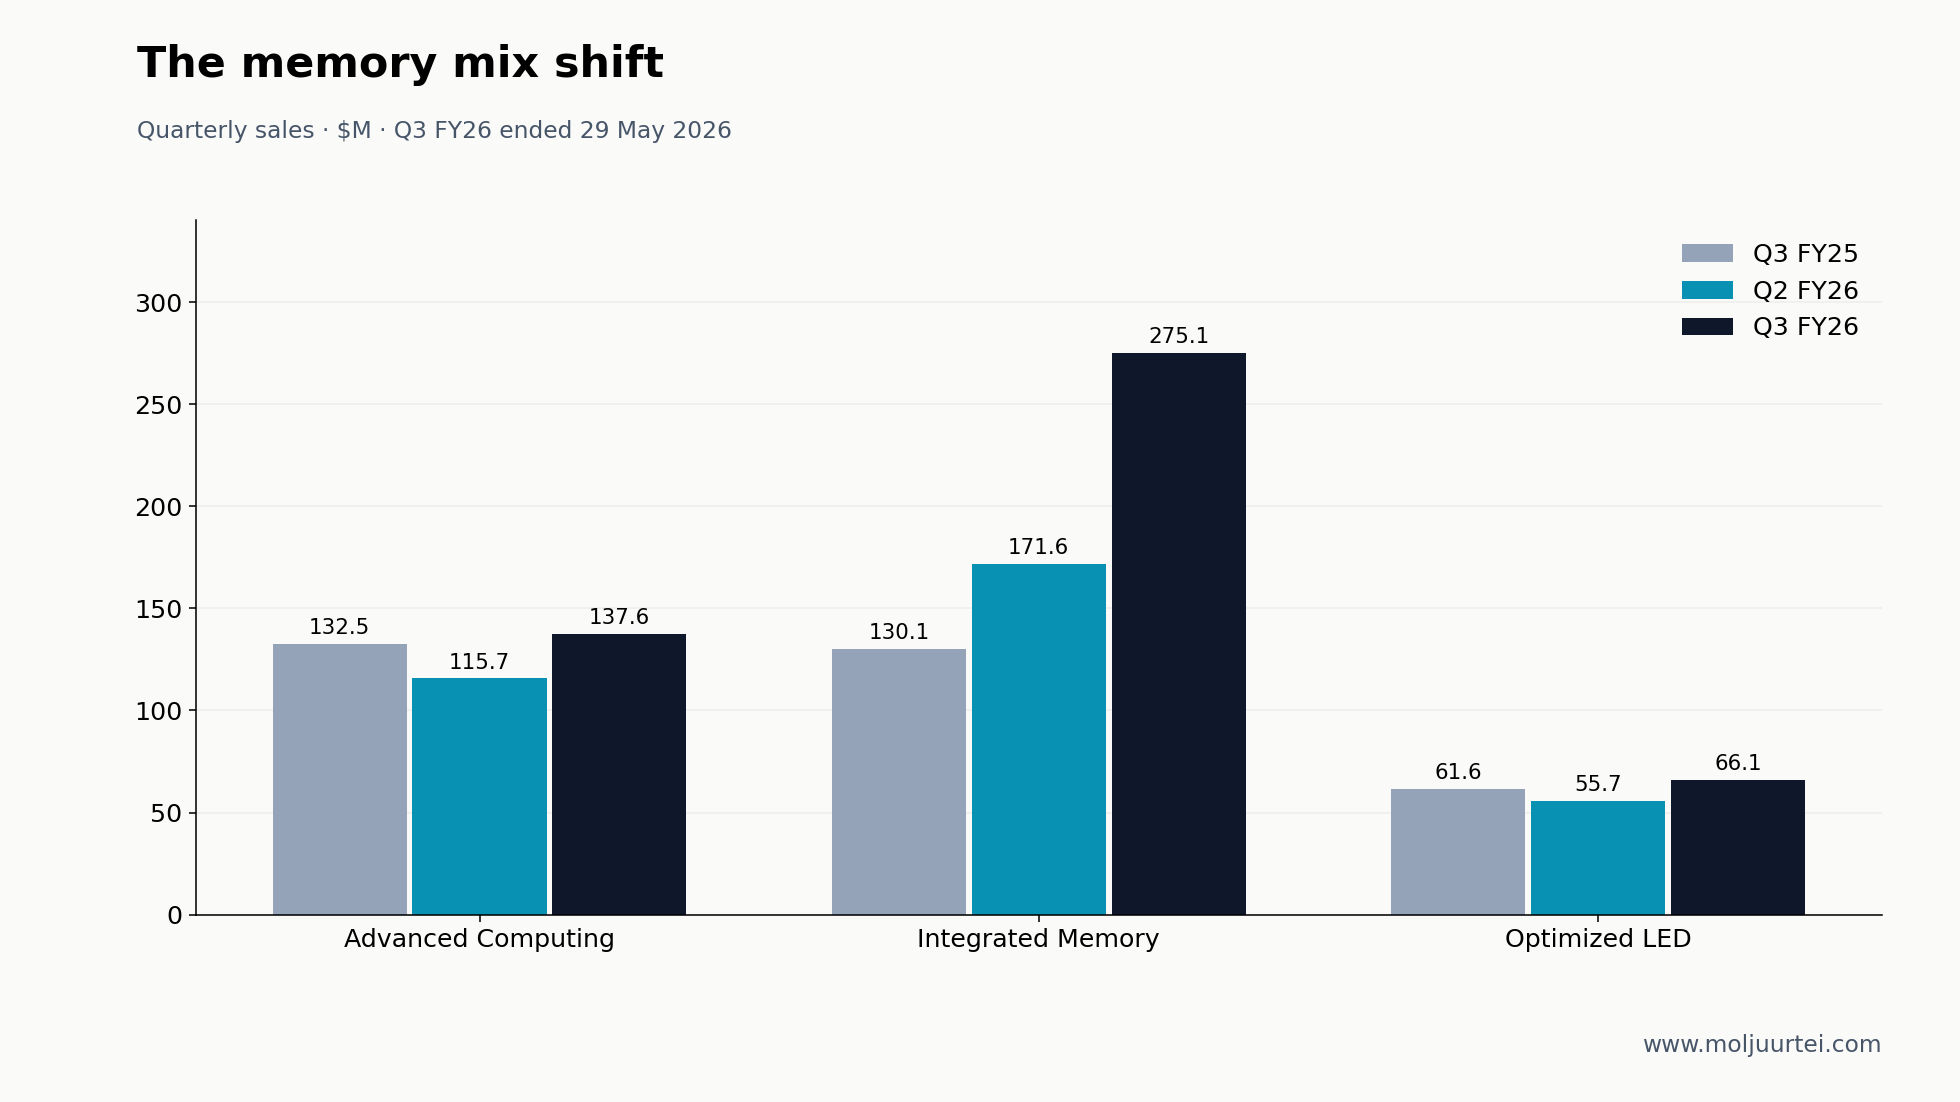
Q3 FY26 memory sales reached $275.067M, 57.5% of total sales and +111.4% year on year. Computing was $137.583M and LED $66.063M. Management’s AI-driven grouping—memory plus non-hyperscale AI infrastructure—represented 74% of sales and grew 104%; this is its business classification, not an independently measured AI-only revenue line. Enterprise computing sales cycles can take 12–18 months. LED was guided to decline about 5% for FY26.
The company changed its name from SMART Global Holdings and ticker SGH on October 15, 2024, and redomiciled from the Cayman Islands to Delaware on June 30, 2025. The Brazil memory business was divested and appears in discontinued operations; older whole-company series are not a clean organic-growth comparison. SK Telecom invested $200M through convertible preferred shares in December 2024, with roughly 6.1M common shares at a $32.81 conversion price and board rights. This is not an SK hynix equity stake: SK hynix is a development partner under the CES 2025 trilateral agreement, without disclosed related revenue.
Technology & Moat
HBM sits close to the accelerator because wide, fast data paths matter. Its packaging, power and capacity are costly constraints, but a particular stack height should not be called a permanent physical ceiling. Offloading reusable KV blocks can relieve capacity pressure and avoid repeated prefix computation; it also creates data-transfer and latency costs. The relevant architecture is a hierarchy, not a claim that all inference cache is bandwidth-insensitive or that one new memory product replaces HBM.
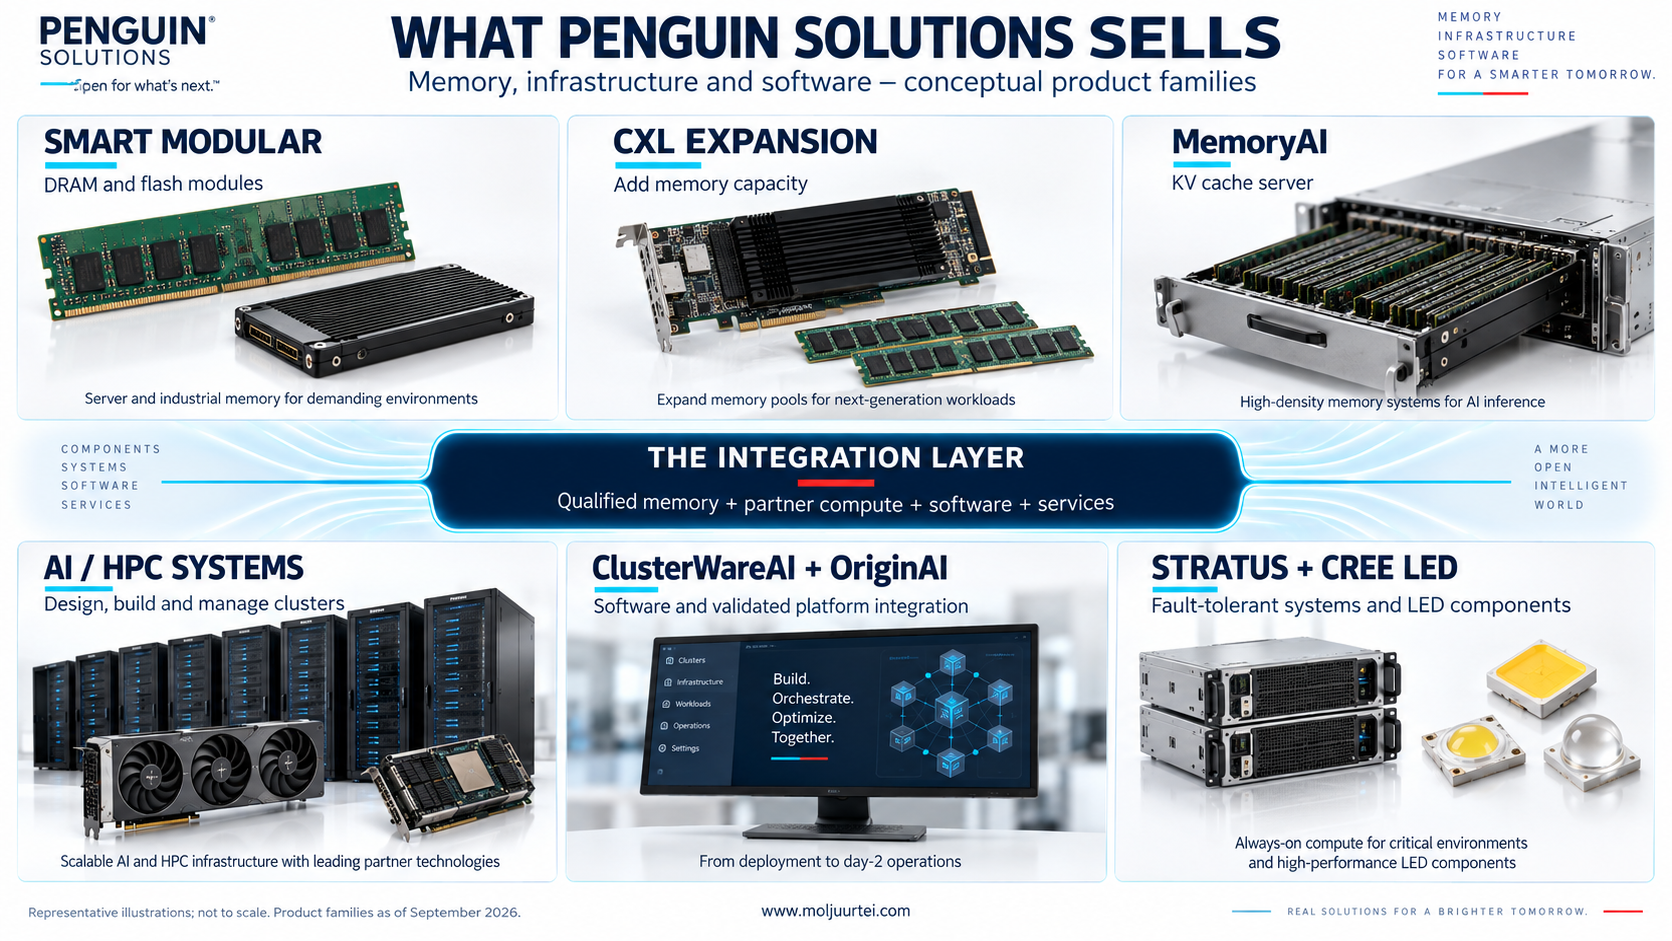
Four- and eight-DIMM DDR5 CXL expansion cards entered Dell’s server configurator in March 2025. MemoryAI, introduced at GTC 2026, targets reusable KV cache. Penguin reported up to 2× inference performance and up to 8× improvement in time to first token in its evaluated workloads. These are vendor benchmarks, not universal production gains. A tier-one financial customer bought the system in Q2 and expanded in Q3 alongside software and Dell compute, a more useful adoption signal than the maximum benchmark alone.
The moat is qualification and integration rather than ownership of DRAM fabrication. SMART sources chips from the industry’s major suppliers, qualifies modules for demanding equipment and uses long-standing OEM channels. ClusterWareAI and OriginAI combine partner hardware, operating software and services. The customer buys a working system. That advantage can create repeat business, but standards such as CXL also let competing suppliers participate.
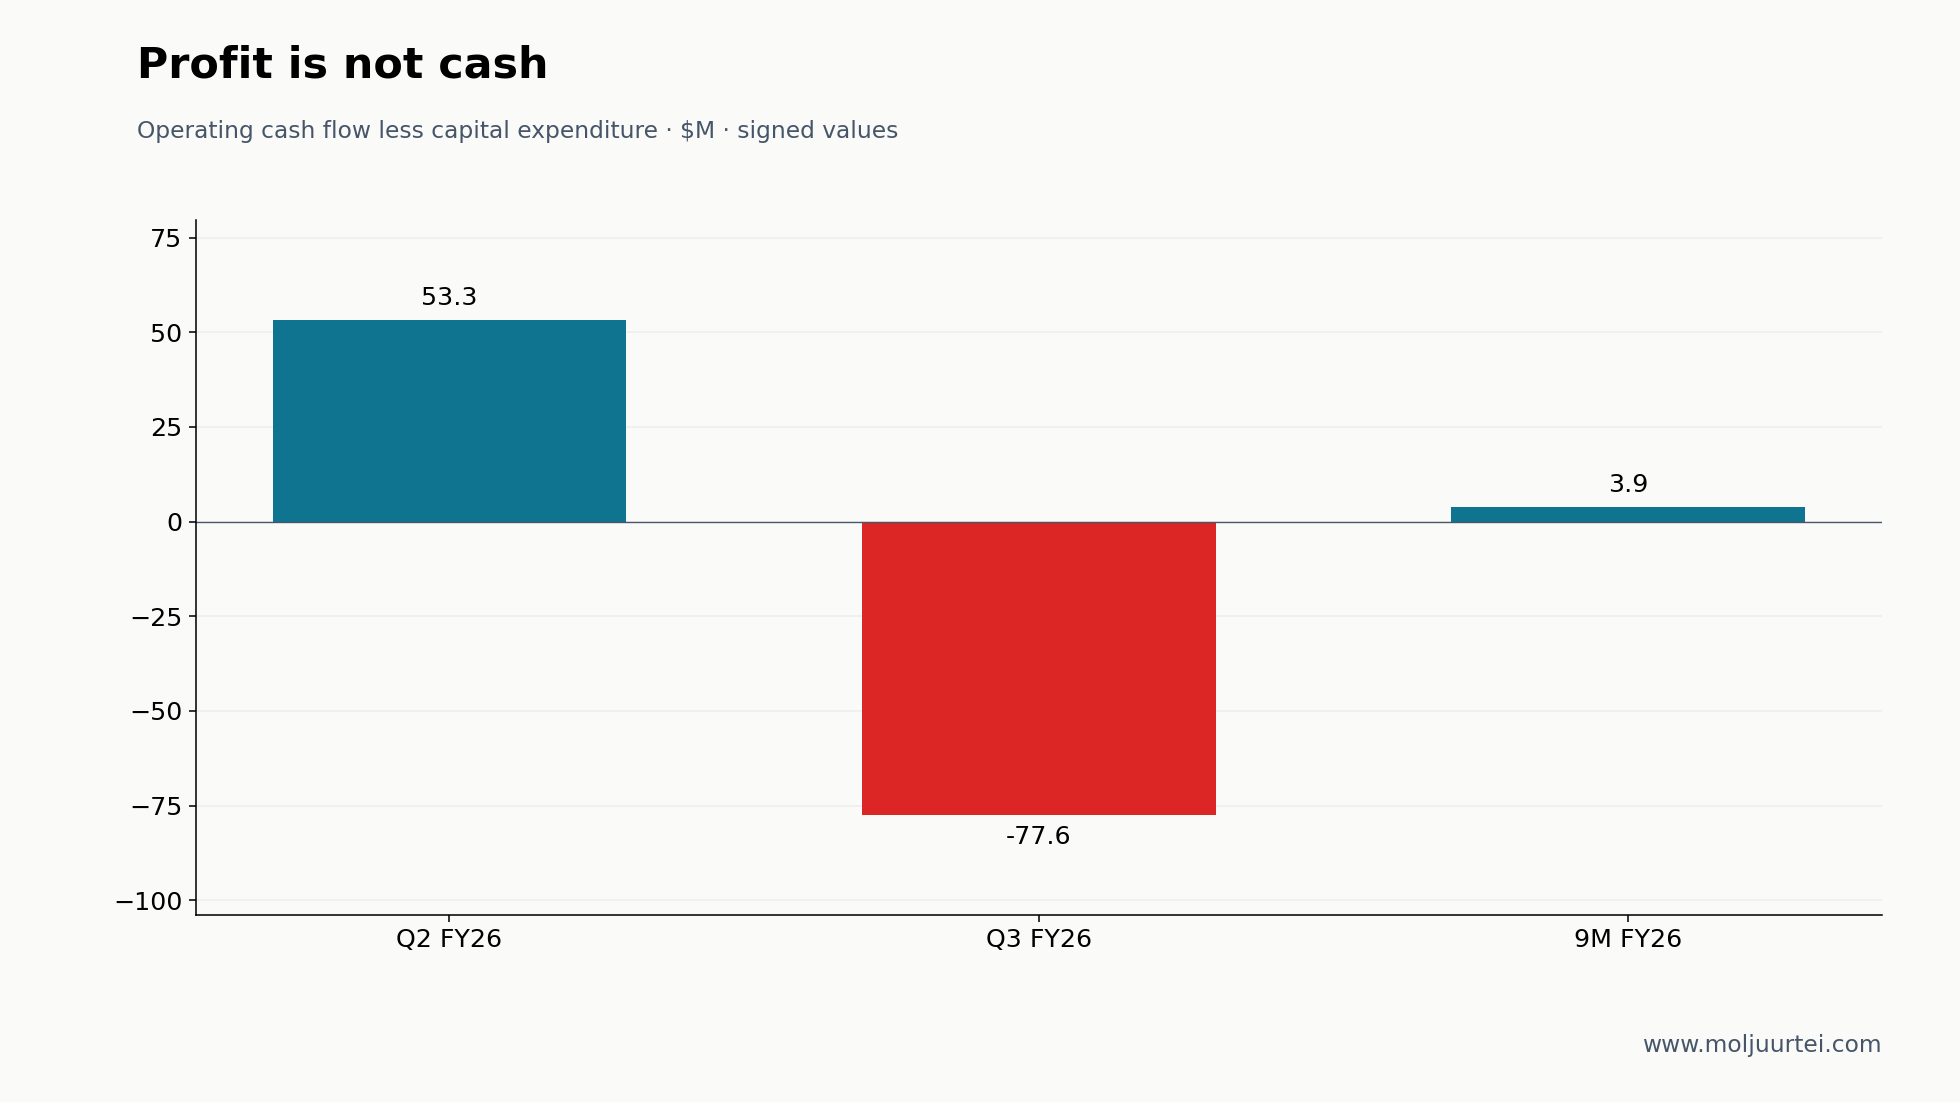
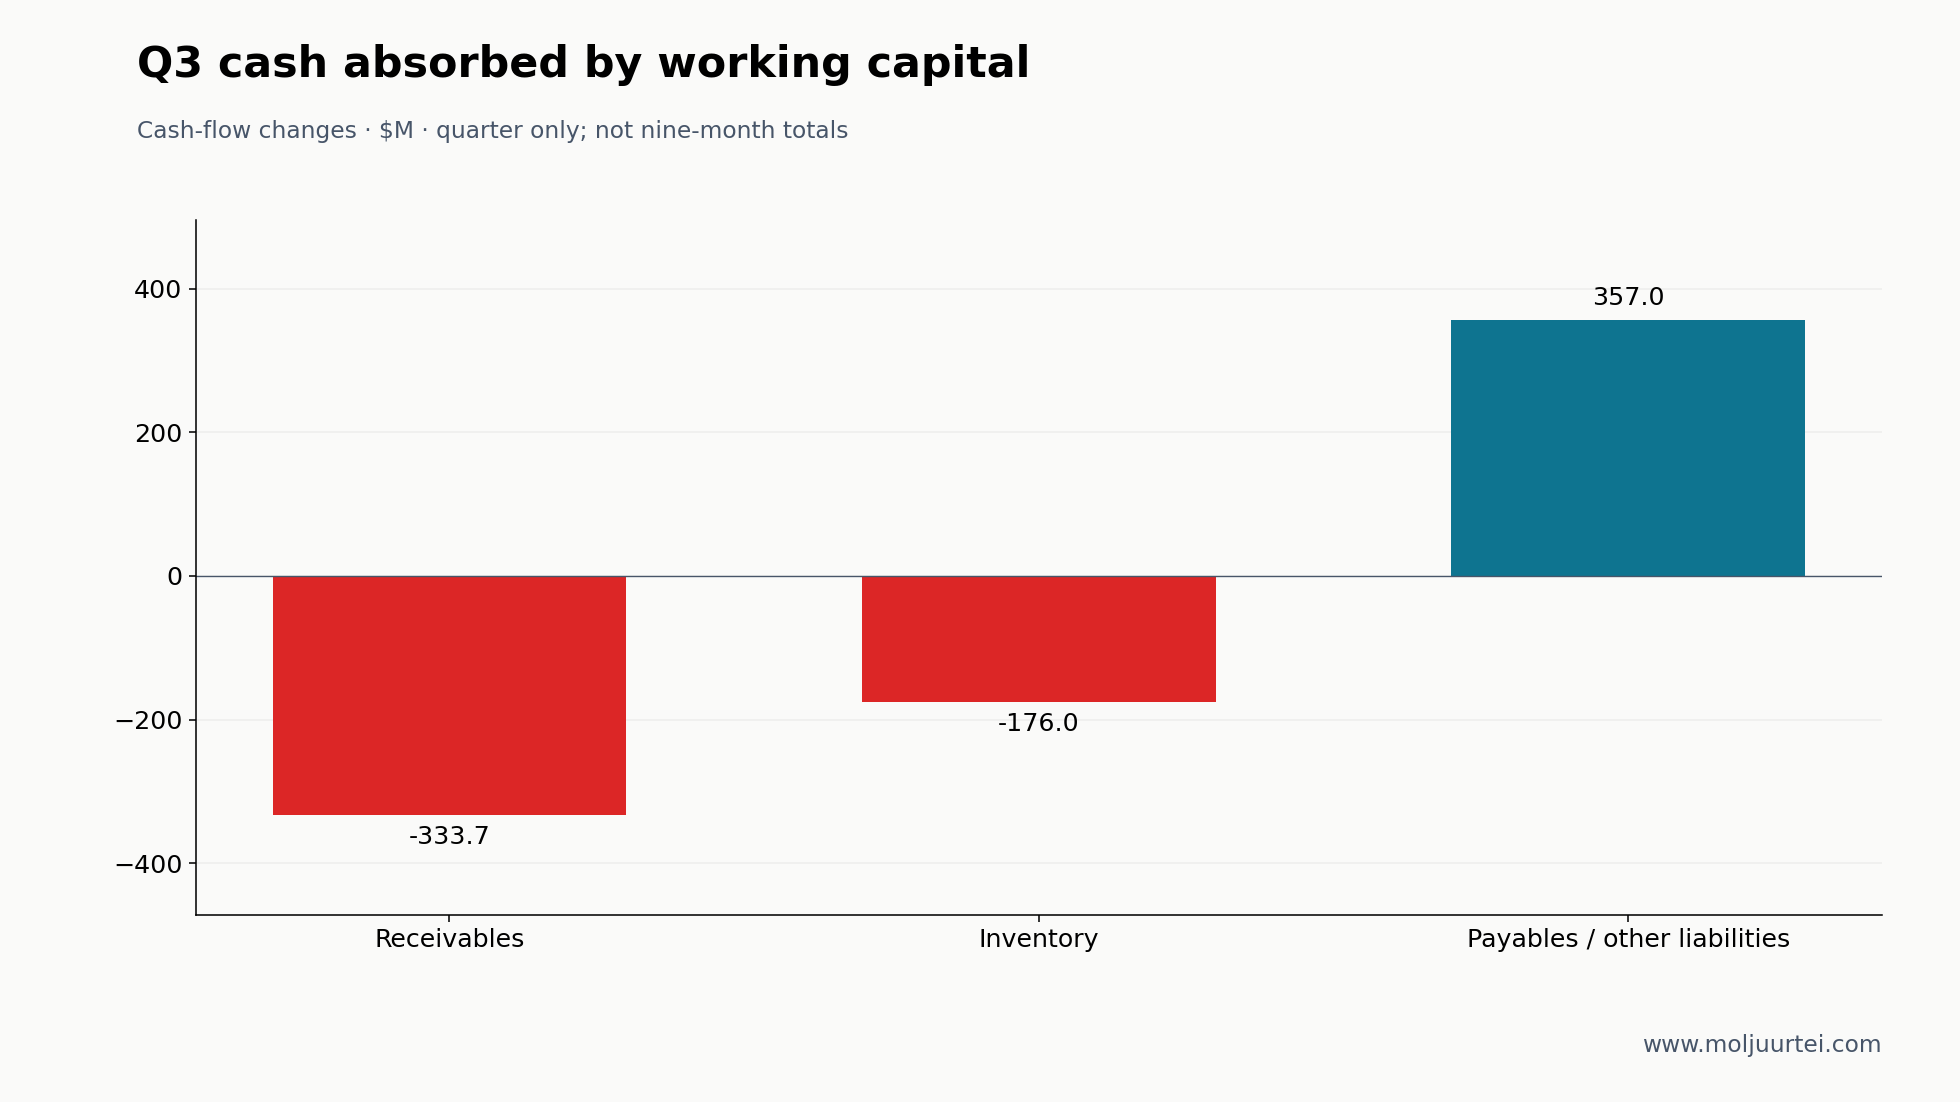
The limit is visible in the balance sheet. Inventory was $498.318M at May 29 versus $255.182M at the previous fiscal year-end. Higher memory costs and purchases for anticipated demand explain part of the build. Historical DRAM contract-price jumps are context, not a current September price quote. The business needs that inventory to sell and the receivables to be collected; higher nominal sales are not sufficient.
Roadmap & R&D
The next product steps are CXL expansion toward pooled memory, the Photonic Memory Appliance developed with Celestial AI, and broader ClusterWareAI operations. Optical transport aims to expand memory reach and bandwidth beyond the accelerator package; it is distinct from the CXL cards shipping today. The previously discussed late-2026 to early-2027 first-shipment window remains a milestone to verify, not booked revenue. A delay with intact customer qualification is an execution issue; repeated delays with no paying adoption would weaken the thesis.
FY25 R&D was about $79.8M, 5.8% of sales. The model carries the guided operating-expense mix into later years; it does not assume semiconductor-fab investment. This is a partner-heavy systems strategy. June’s ClusterWareAI update added conversational operations and automated remediation with human oversight. The durable test is recurring customer use and expansion: across Q3 FY25–Q2 FY26 memory added 16 customers, five of whom expanded; infrastructure added 13, seven expanded, and Q3 FY26 added four more infrastructure customers.
The Setup
October 6 is the next checkpoint: the FY26 finish, a full FY27 outlook, gross-margin mix, inventory conversion and the post-refinancing capital structure. The first three FY26 quarters total $1,164.783M of sales; the July midpoint implies about $505.2M in Q4. The preliminary 30% sales view would take FY27 to about $2,170.9M. Neither figure is an already-reported result.
The new notes convert initially at $116.70 and mature August 1, 2031. Capped calls are intended to offset incremental dilution or cash above principal up to $175.05, subject to their terms and counterparty performance. They do not erase the $750M principal. The exchange of $135.5M of 2029 notes and $160M of 2030 notes involved roughly $298.1M cash plus approximately 8.7M newly issued common shares. That immediate issuance matters more to today’s share base than treating all new notes as already converted. Transaction terms.
Historical ownership filings showed large positions from BlackRock, FMR, Invesco, Nova Scotia, Vanguard and State Street, plus SK Telecom’s convertible preferred. The old percentages were measured on different filing dates and share bases and predated the July issuance; they should not be presented as a current September cap table or added together. Earlier parsed Form 4s showed modest open-market insider selling, but an old quarterly chart is not evidence of the latest insider activity. No fresh insider conviction signal is assumed here.
Management & Track Record
Kash Shaikh is CEO, succeeding Mark Adams, who led the rebranding and SK Telecom transaction. Nate Olmstead stepped down as CFO on July 8; Aaron Johnson became interim CFO. Earlier CFO Ken Rizvi had left for Synaptics. The reporting transition deserves scrutiny without assuming wrongdoing or that a permanent successor has already arrived. The October call should establish continuity in the outlook and capital-allocation explanation.
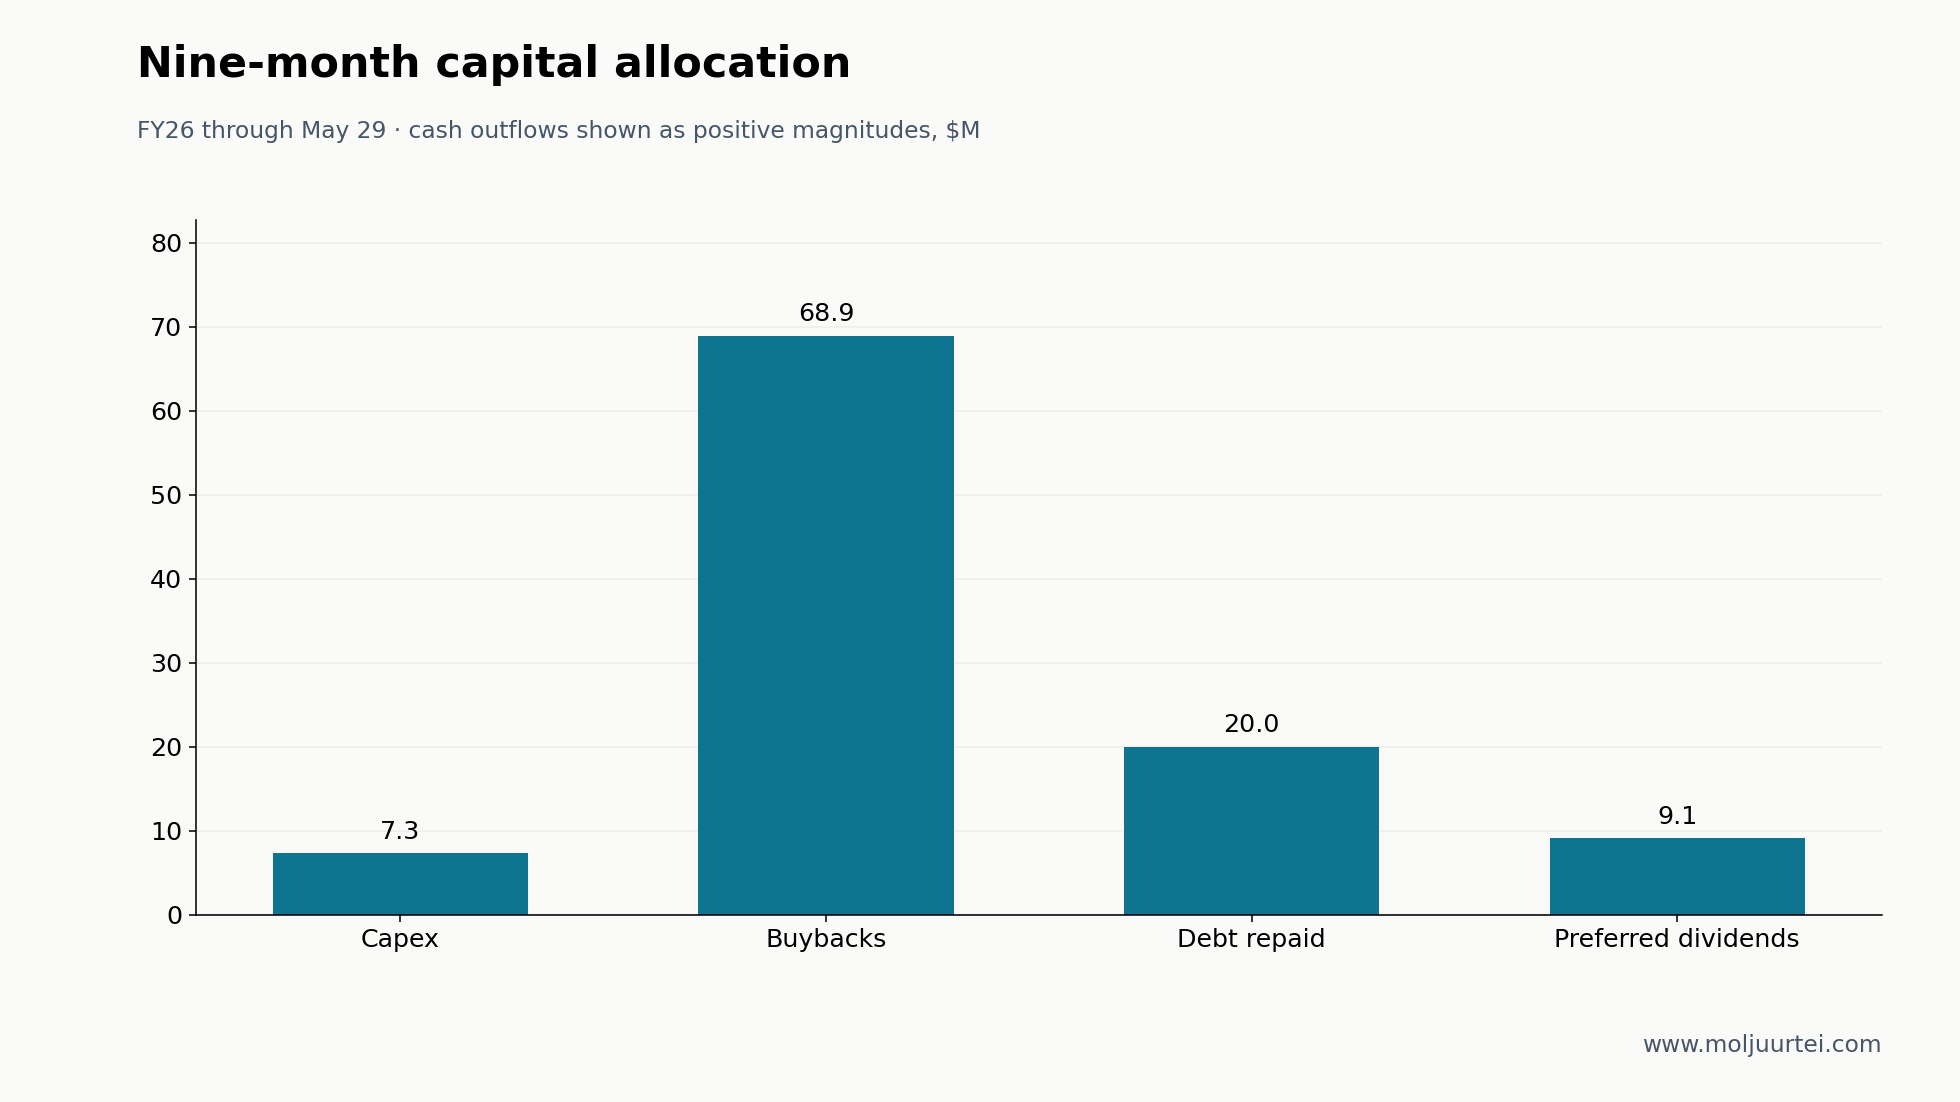
The operating record includes a FY25 finish above the high end and two FY26 guidance increases. Non-GAAP tax guidance declined to 20% as income mix changed; this is not a guaranteed cash-tax rate for every future year. Actual nine-month FY26 cash uses included $68.886M of common-share repurchases, $20M of debt repayment, $9.1M of preferred dividends and $7.297M of capex. The later refinancing must be judged together with its cash costs, new common shares and maturity extension, not just its zero coupon.
Risks
Price Setup
The September 25 close of $56.22 is 30.9% below the July 9 high of $81.39. It is above the 20-day average of $50.96 and 50-day average of $53.42, just below the 100-day average of $56.85; the 200-day average is $38.86. These describe the price path, not intrinsic value. At July’s EPS outlook, the price is 28.5× GAAP EPS of $1.97 and 21.6× non-GAAP EPS of $2.60.
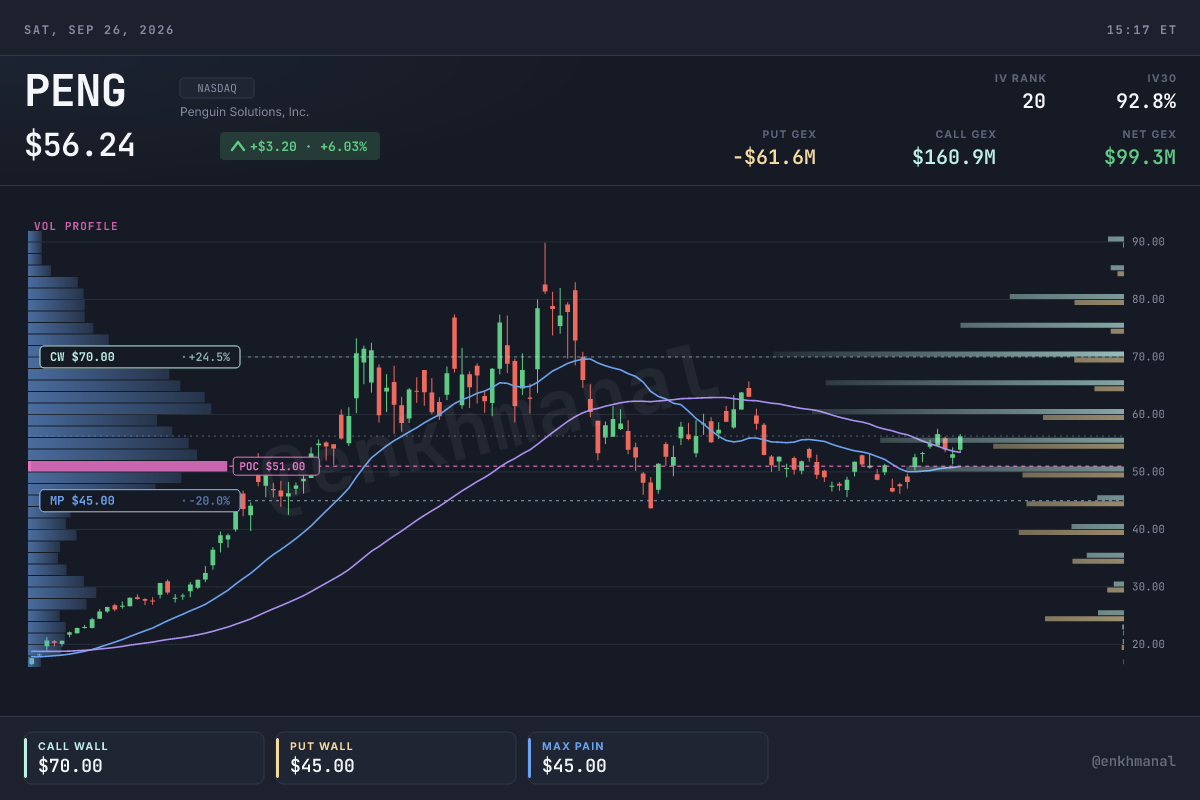
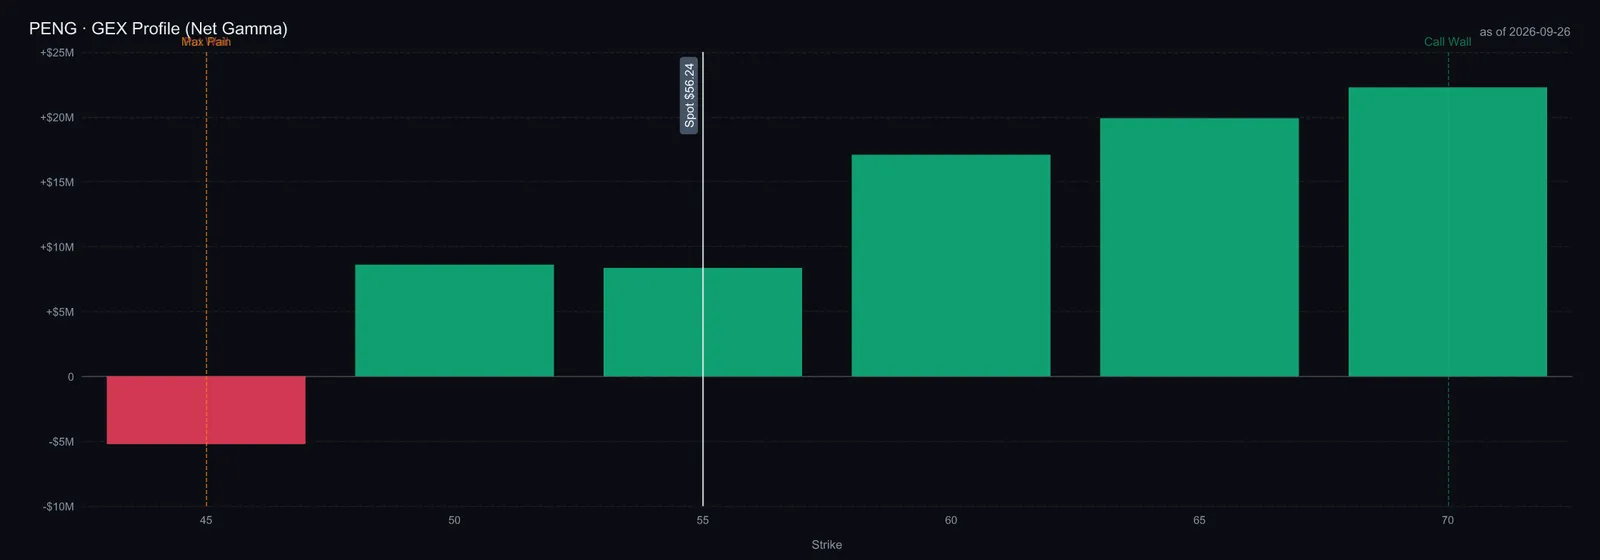
The September 26 options snapshot spans 11 expirations near $56.24: estimated net gamma +$99.3M, call wall $70, put wall and max pain $45, put/call open-interest ratio 0.72. The spot-sweep gamma flip is unavailable; the $50 strike-profile sign change is a different calculation and must not be labelled that flip. Dealer positions are inferred under model assumptions, not observed. Walls can move and do not pin the stock into earnings.
The IV snapshot is 92.8%, with rank 19.5 over 140 stored days. A square-root-of-time 30-day one-standard-deviation illustration is roughly ±26.6%, or ±$14.96; it is not a forecast range or guaranteed probability band. Rank is limited to that stored history, and the old September 4 term-structure chart has been retired rather than relabelled as current.
Valuation
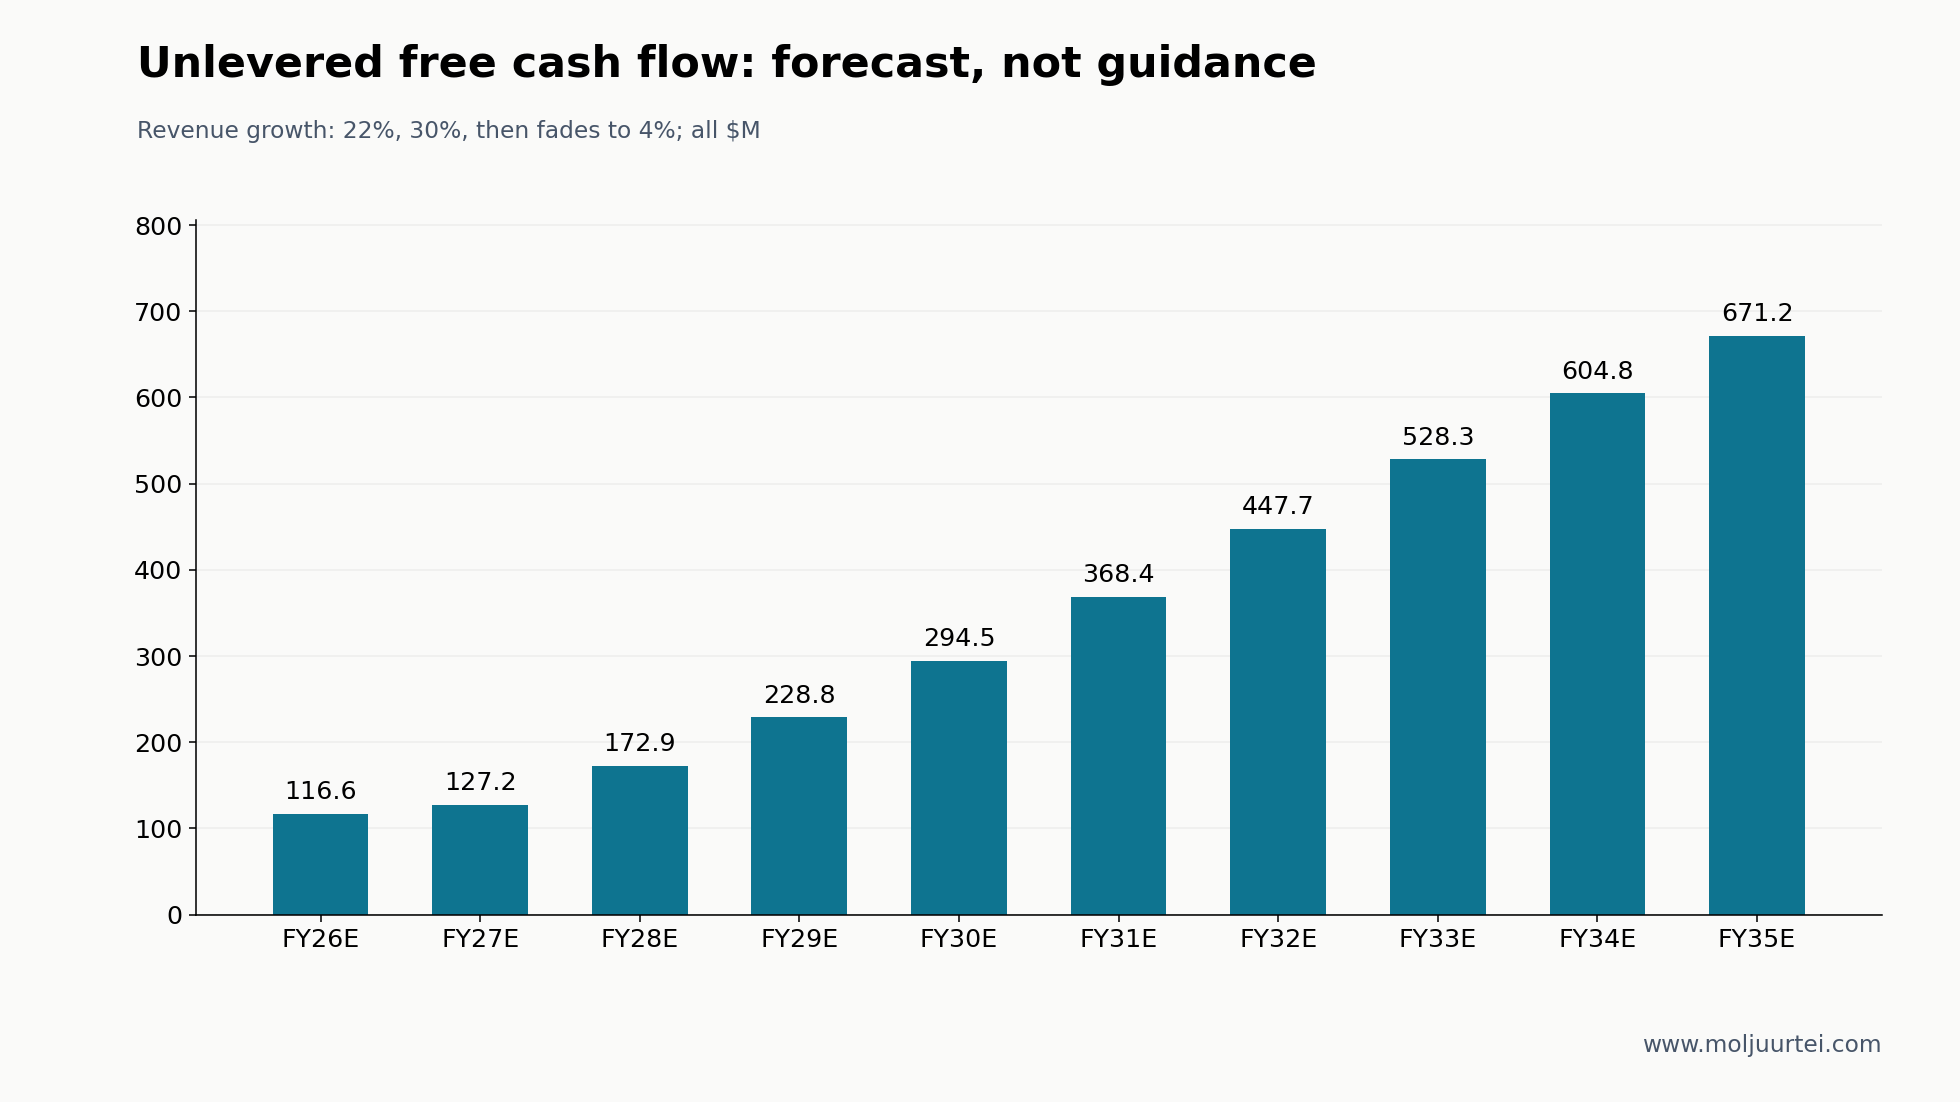
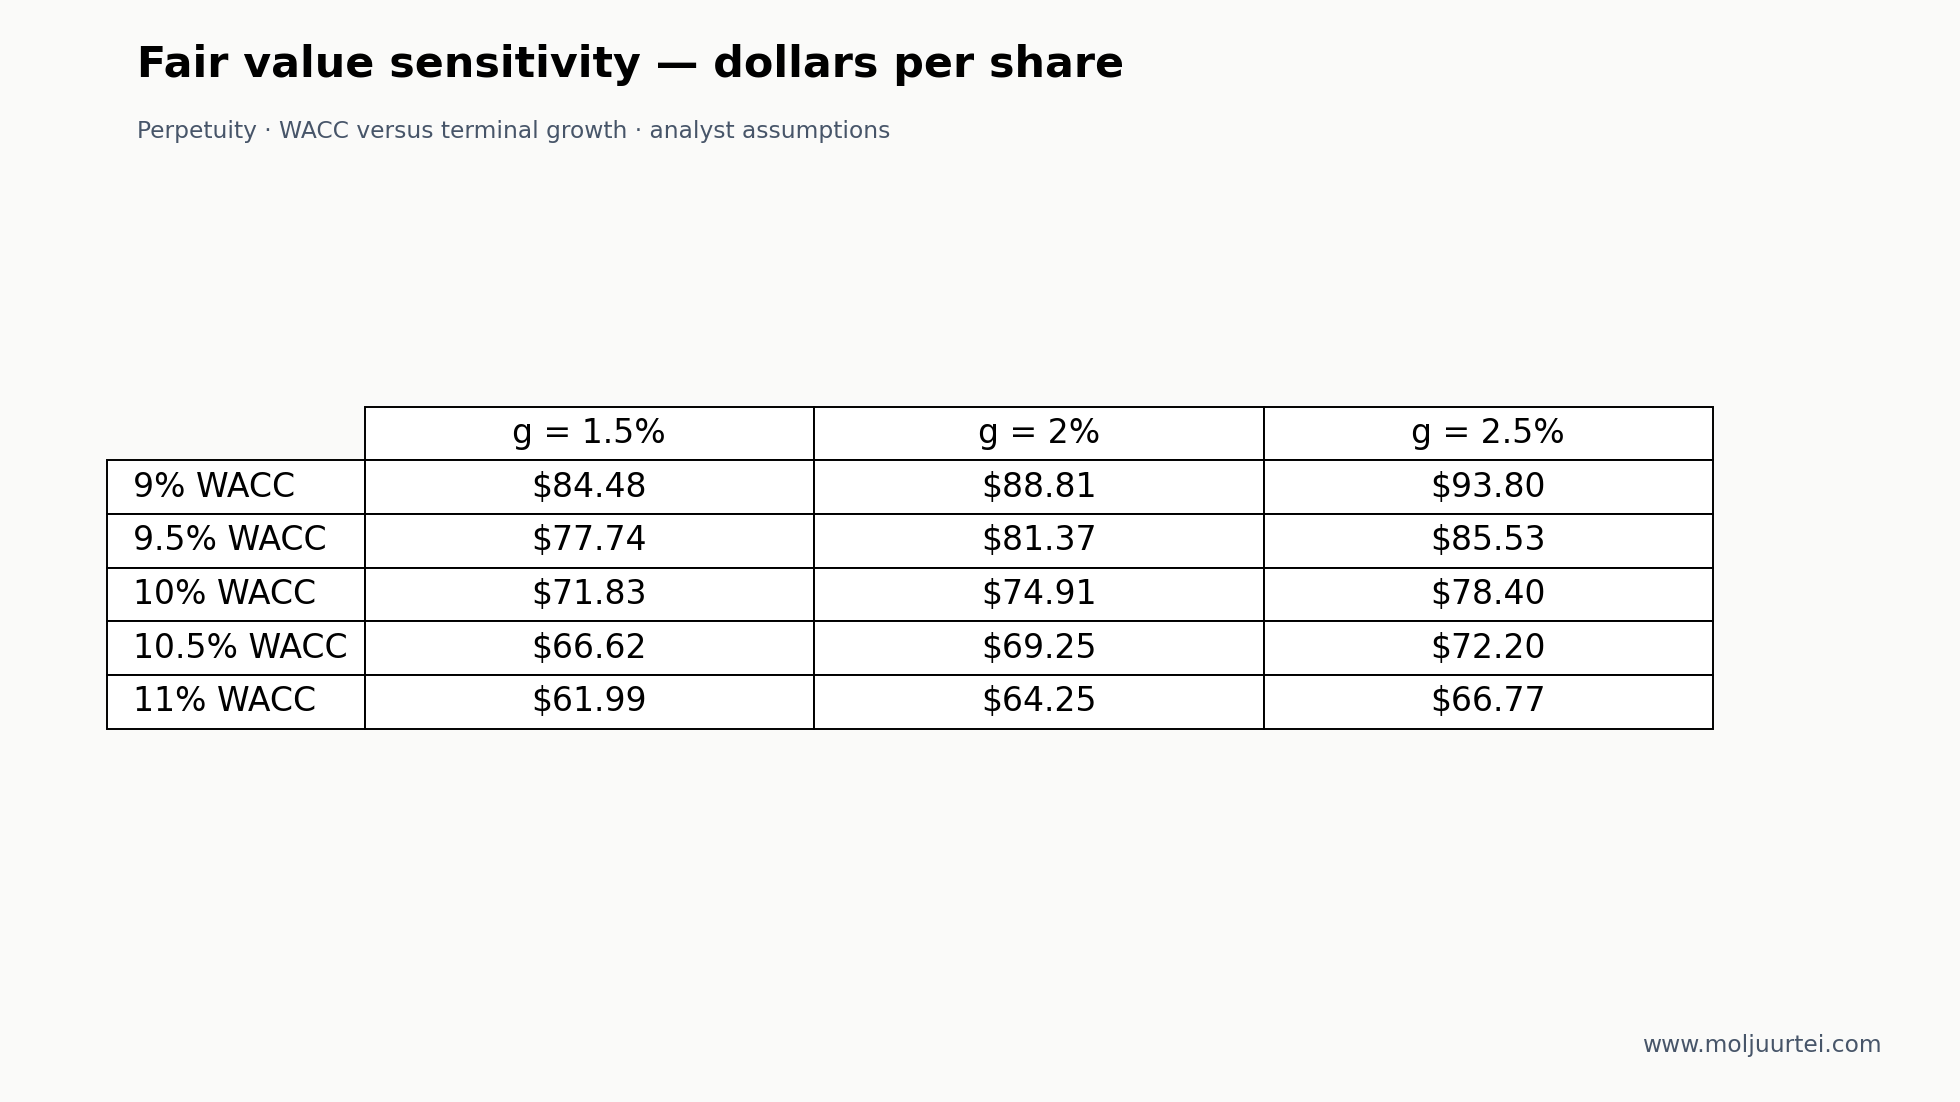
The refreshed article uses the workbench’s pure calculation engine on a local copy of the saved assumptions; it does not overwrite the owner’s saved Model-pane state. Ten explicit years begin with FY26 revenue growth 22%, then FY27 30%, fading to 4% by FY35. The first year uses guided GAAP gross margin 26.5% and operating expense $303M, implying operating profit $139.5M. Later gross margin stays 26.5%, SG&A is 12.9% of revenue, and the guided-year R&D/other-expense mix carries forward.
Incremental working capital consumes 21.6% of added revenue, anchored to prior annual balance sheets. Capex is 0.7% of revenue; D&A is approximately 4.9%, the filed three-year ratio. Stock compensation remains charged in GAAP expenses; depreciation and amortization are non-cash and added back in the FCF calculation. That large D&A/capex gap is a material judgment: acquisition amortization and asset-light operations can explain it, but it is not free perpetual reinvestment. A 20% cash-tax proxy follows non-GAAP guidance and is an estimate, not reported future cash tax. WACC 10% and terminal growth 2% are analyst assumptions.
The equity bridge is provisional until the October filing. May common shares were 51.24M; July’s approximately 8.7M exchange shares and approximately 6.1M preferred-conversion shares give about 66.04M before awards and other dilution. The model uses 68M throughout, not the old declining 59M path. It treats the preferred as converted, so it does not also deduct its $200M principal. The new $750M notes remain debt; adding all their underlying shares as well would double-count them.
The model deducts $85M of net claims: approximately $70M pro-forma net debt plus about $15M noncontrolling interest. The debt estimate rolls May cash/debt through the announced note exchanges, credit repayment, offering expenses and approximately $49M of capped-call cost, including an estimated proportional cost for the exercised option. It is not a September balance sheet: unreported Q4 operating cash flow, subsequent borrowing and exact carrying-value adjustments remain unknown. Each additional $100M of net claims reduces value by about $1.47 per share at 68M shares. The data vendor’s $2.88B market cap uses a stale roughly 51.24M share count and is not used as the post-deal equity value.
With those inputs, perpetuity value is $74.91, +33.2% to $56.22; bear $37.15 and bull $127.00. The matched integrator group, repriced to September 25 on its existing filed annual denominators, has a 35.0× median EV/EBITDA. Using it on FY35 EBITDA produces $202.05, bear $102.76 and bull $318.09. The two methods differ 2.7× because they capitalize different terminal economics. They are not averaged. The 35× case is an aggressive distant-exit sensitivity, not the central investment claim.
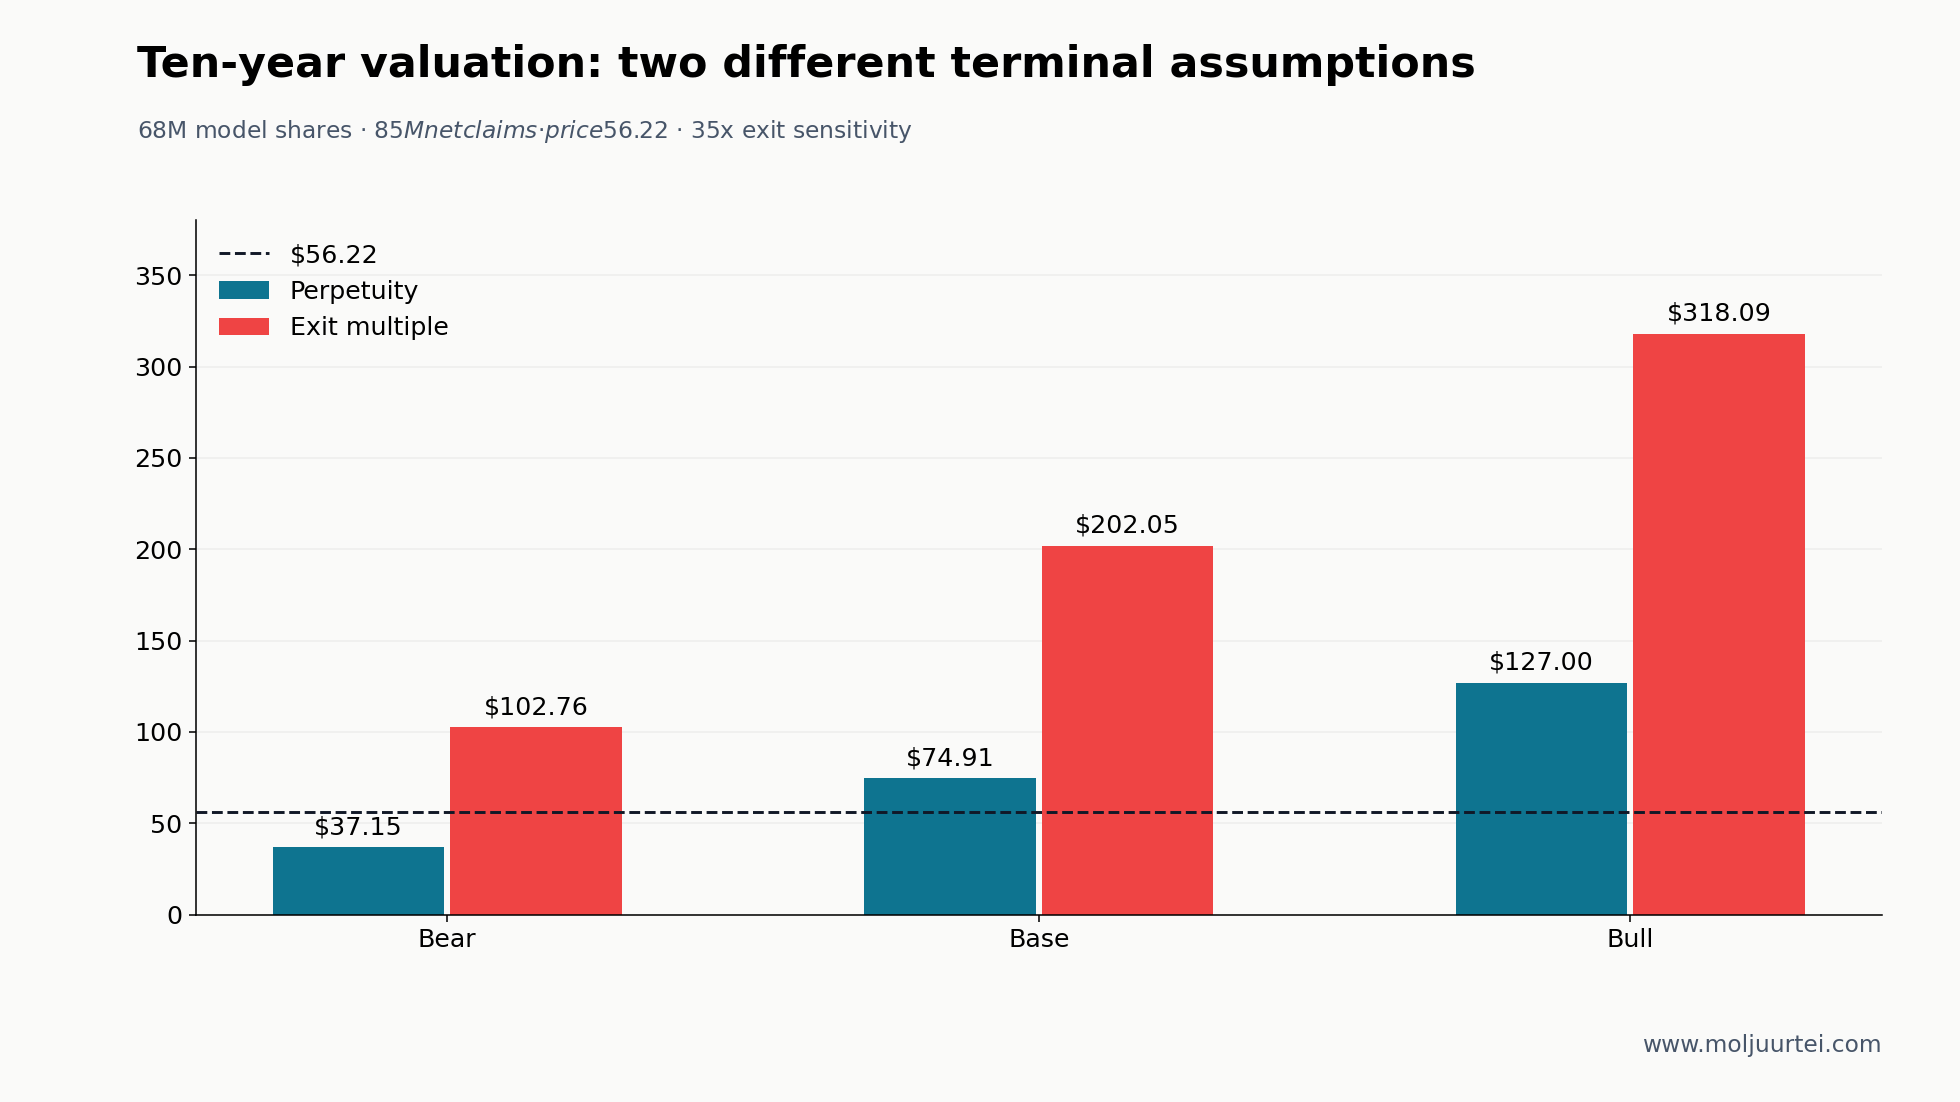
The audit returns 10 passes, two warnings and no failures. The warnings are the 2.7× terminal-method gap and the large re-rating in the 35× exit. The audit’s mechanical own-multiple comparison still uses filed FY25 weighted shares; on this article’s consistent 68M equity base and $85M net claims, current EV is about $3,908M and guided-year EV/EBITDA about 17.7×. Thus 35× still assumes roughly twice the current model-basis multiple. Peer capital structures remain filed annual snapshots, not fully rebuilt September balance sheets.
Reverse DCF at $56.22 solves to approximately 17.1% annual revenue growth held constant for all ten years, with the other assumptions fixed. It does not mean the market expects 17.1% specifically in FY27; the guided-then-fading base path is different. Solving the discount rate on the base perpetuity path gives about 11.9%, a model-implied return parameter rather than a promised shareholder return. WACC 9–11% and terminal growth 1.5–2.5% give $61.99–$93.80. This is a valuation sensitivity, not a statistical confidence interval.
The conclusion rests on adoption and cash conversion before it rests on a multiple. Penguin has evidence of expanding customers, a raised near-term outlook and a role in memory-tiered inference. Waiting for October buys clarity on the balance sheet and FY27 but may cost price if execution confirms the view. Acting sooner accepts preliminary guidance, working-capital exposure and a provisional dilution bridge. The thesis breaks if the customer expansion and cash-generation mechanism fail, not merely because a product shipment moves by one quarter.
The Cash-Flow Build
All forecast values below are generated from the same refreshed calculation. Dollars in millions unless marked. The 68M share line is a fully diluted valuation assumption, not FY26 GAAP weighted-average EPS guidance of 59M.
Table terminology: EBITDA; FCF.
Table terminology: SG&A; WACC.
FY26 gross margin and total operating expense remain pinned to the same management guidance in all cases; case margin and SG&A changes apply to later years. Working capital 21.6%, tax 20%, capex 0.7%, 68M shares and $85M net claims are shared assumptions. No probability weighting is assigned.
The Peer Basis
Prices are September 25 closes; the denominator and capital structure are each company’s filed annual data held in the September 7 workbench snapshot. EV = updated price × filed diluted shares + filed net debt. These are price-refreshed annual-basis multiples, not current TTM or forward consensus multiples. Different fiscal year-ends and later balance-sheet changes limit comparability.
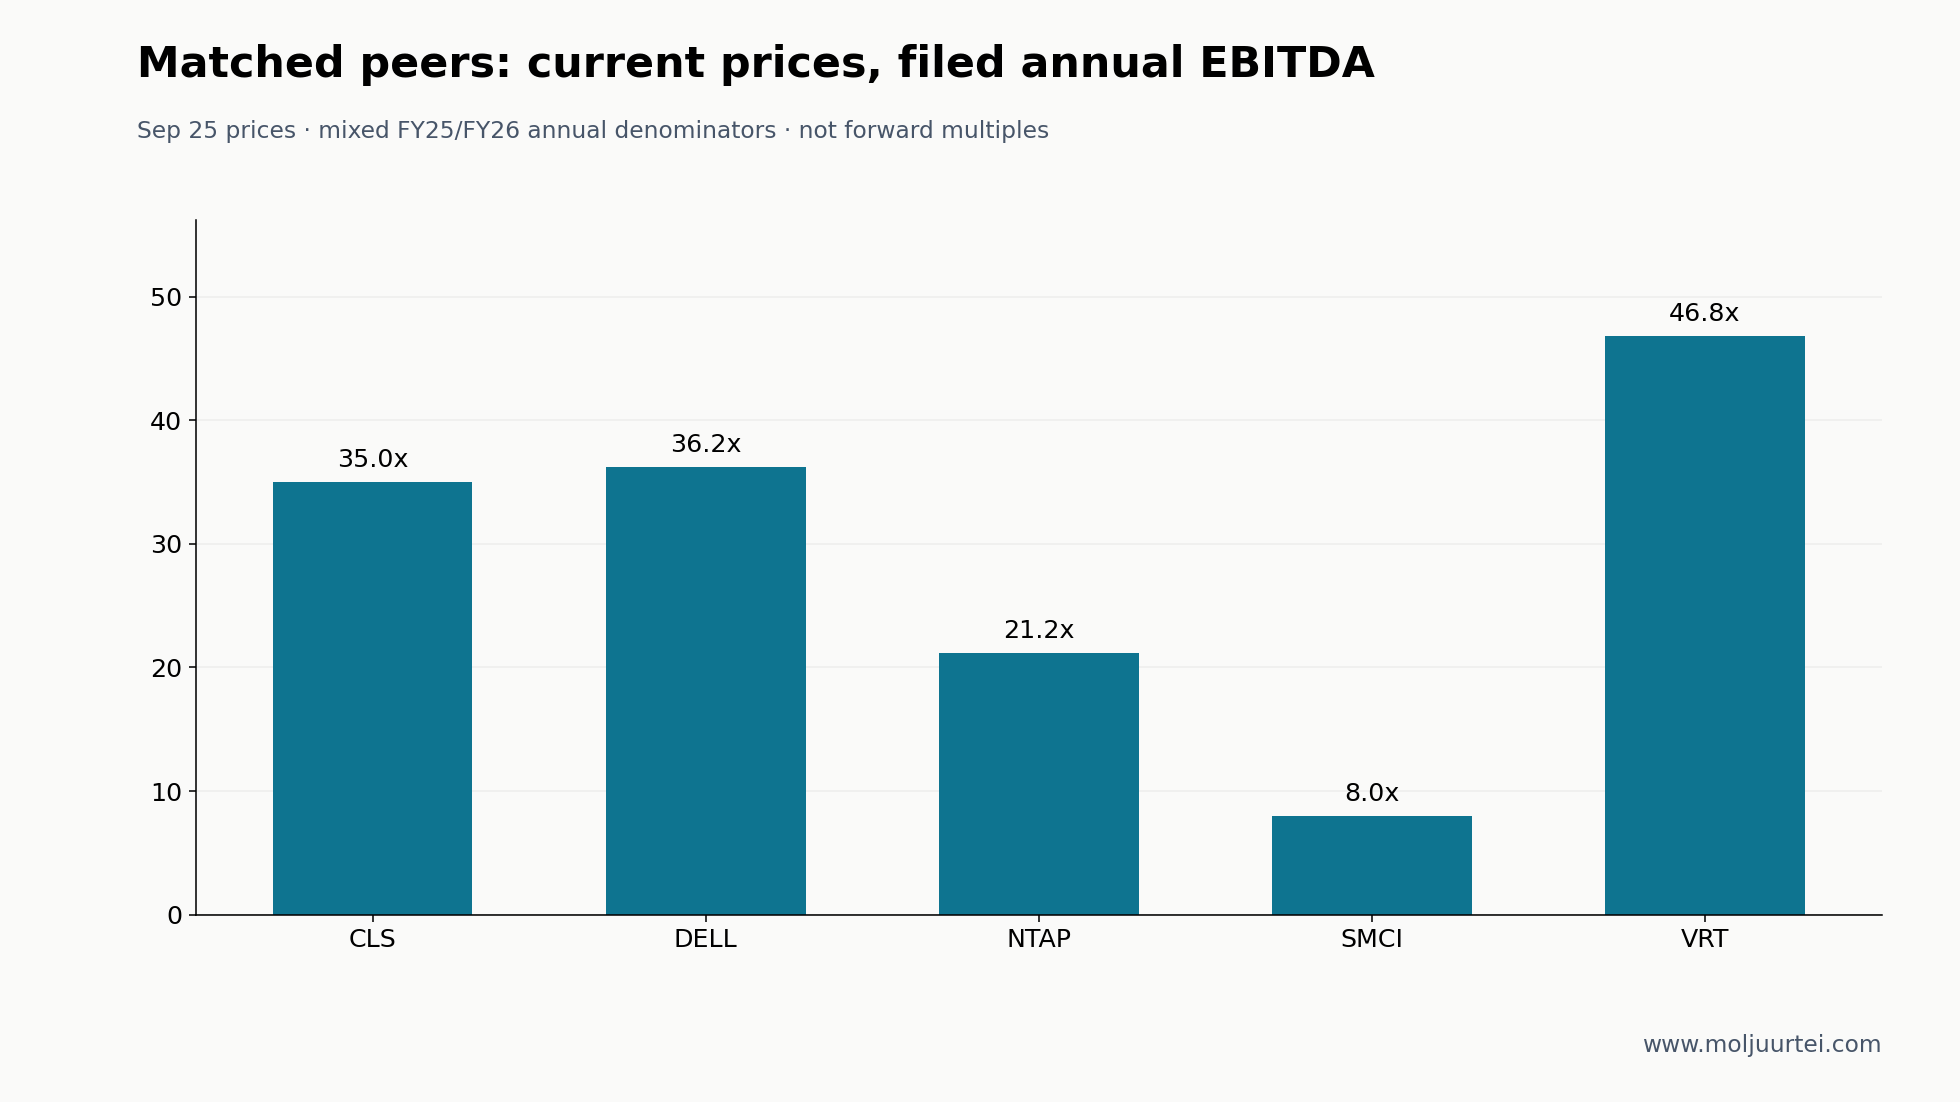
HPE remains excluded because its filed operating income was negative; ALAB and MRVL share the memory/interconnect demand driver but not the integrator margin structure. Without VRT the eligible median is 28.1× and the exit sensitivity $167.42. At Penguin’s own approximately 17.7× guided-year multiple on this model’s capital base, it is $115.03. The saved Model pane separately held a 13.25× exit setting on September 8; this article does not silently replace that user setting.
Sources & Refresh Notes
Primary sources: Q3 FY26 release and statements; July 14 financing terms; July 17 closing; September 9 Lektra announcement; October 6 earnings schedule. The retained workbench contains FY25 annual filings, the July earnings-call guidance and product research. Price and options data were refreshed September 26 using the September 25 market close; this memo is not an intraday quote.