

NVMI — Seeing inside the stack, from measurement to cash
$NVMI is Nova Ltd, based in Rehovot, Israel. It makes instruments that measure chip structures and materials between manufacturing steps, before another layer hides them. This August 25 research asks whether more measurement per wafer can sustain growth. Q2 revenue was $255.0M with a 29.4% GAAP net margin. Prices, options, peer comparisons and scenarios are historical August observations; the November 3 update distinguishes completed events from the still-pending Q3 release.
November 3 update — What has and has not happened
The September 8 Citi conference is now historical. Its announcement established participation, not a verified resolution of China risk. Nova announced a new up-to-$200M repurchase authorization on September 2; authorization does not establish completed purchases. On November 2 it confirmed Investor Day for March 9, 2027.
The Q3 release is scheduled for November 5 before the Nasdaq open, with an 8:30 a.m. Eastern call. As of this November 3 update, Q3 results have not been reported. The $277–287M revenue and $2.70–2.85 non-GAAP EPS figures remain guidance. Tests still open: order quality after pull-forward, China exposure, customer concentration and whether earnings convert to collected cash. The August share price and options levels are not current.
Why layered chips need different measurements
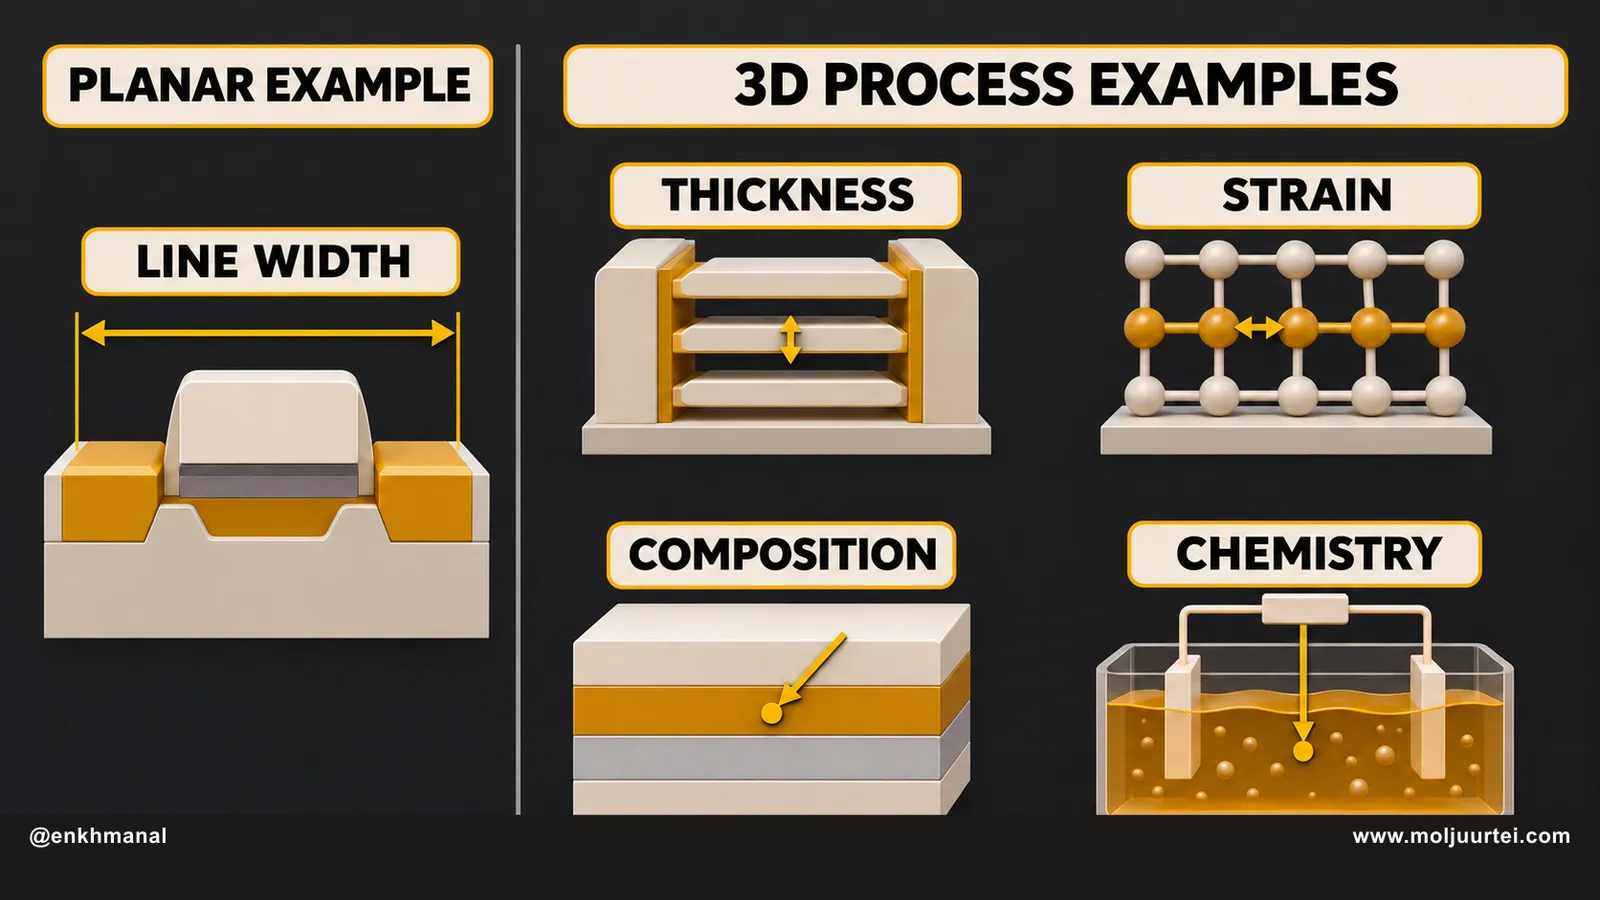
A transistor is a tiny switch controlling electrical current. Many transistors and their connections are fabricated together on a circular silicon wafer. Factories add, pattern and remove thin material films in repeated steps. A metrology tool measures dimensions, thickness, composition or mechanical strain so the factory can adjust the process before adding more value. Looking down from above can answer some shape questions, but cannot alone reveal every property of a buried layer.
Three-dimensional architectures add hidden surfaces and interfaces. Gate-all-around transistors use stacked horizontal nanosheets; factories need to control each sheet and surrounding materials. Tall memory structures can contain holes with depth-to-width ratios over 100:1. Copper-to-copper hybrid bonding requires tightly controlled flatness and surface condition before joining. Problems detected after bonding can be difficult or uneconomic to rework. These transitions require several complementary measurement methods, not just a sharper camera.
More complex structures can add measurement steps and move checks between processing stages. Demand can therefore rise with process complexity as well as wafer volume. The opportunity is more measurement content per wafer, not a claim that wafer starts no longer matter.
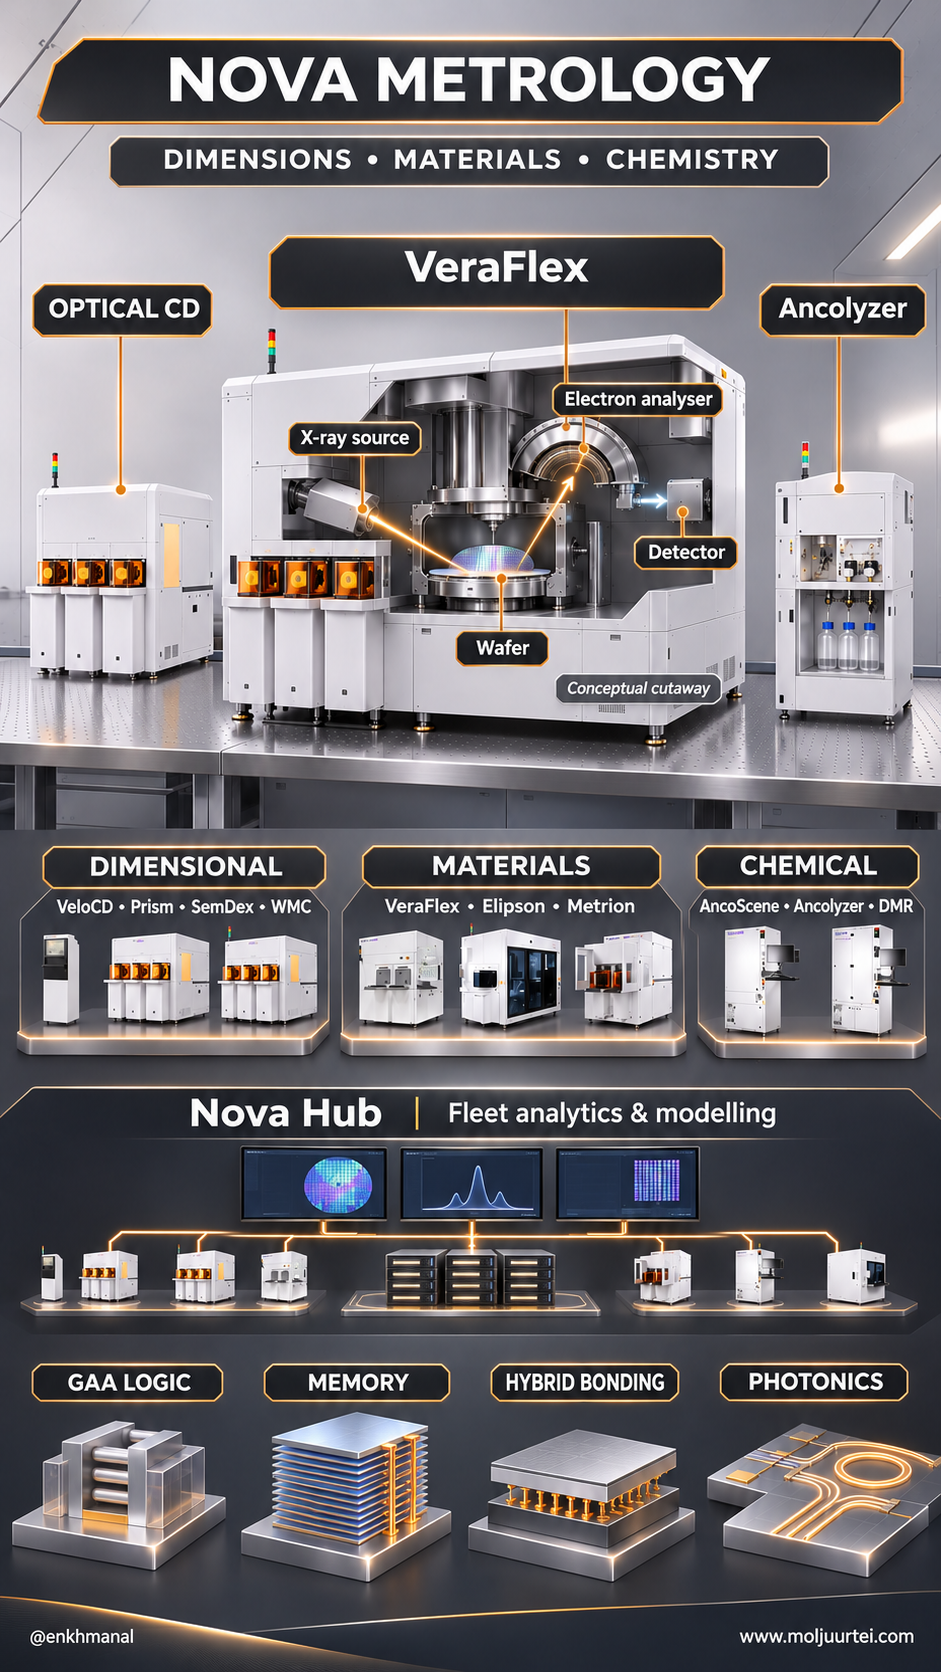
The structural shift is upward stacking and bonding as well as smaller features. Factories need optical models, spectroscopy and chemical analysis to answer different questions; the methods complement rather than universally replace one another. Nova’s public product portfolio maps to these needs.
Nova spans dimensions, materials and chemistry
Nova's distinguishing feature against larger peers is that it did not stay in optical dimensional measurement. It bought and built its way into materials metrology — composition, thickness, strain, contamination — and chemical metrology, the plating and cleaning chemistries themselves. Those are two areas whose importance grows as structures become three-dimensional.
Nova reported Q2 2026 GAAP gross margin of 56.5%, operating margin of 29.9% and net margin of 29.4%. The dated research compared these with Onto Innovation ($ONTO), whose historical gross margin was around 50% and operating margin roughly 13–20%. These are not matched-period comparisons. They show business-model differences but cannot establish that Nova earned twice Onto’s income on 87% of its revenue in the same quarter.
This performance marks a significant milestone for Nova, with quarterly revenue surpassing $250 million and non-GAAP earnings per share exceeding $2.50, demonstrating the scale and earning power envisioned in our long-term strategic plan. We are now working on the next phase of our long-term growth strategic planning, and we will share more about this in our upcoming Investor Day during the first quarter of 2027.
An installed base supports a growing service business
Nova was incorporated in 1993, has traded on Nasdaq since April 2000 and on the Tel Aviv exchange since June 2002, and files as a foreign private issuer — a 20-F annually and 6-Ks in between, with no 10-Qs. It sells into lithography, etch, chemical-mechanical planarization, deposition, electrochemical plating and advanced packaging, and reports one operating segment.
The August presentation described over 8,000 active systems at more than 420 customer sites, four R&D/production centres and a 34-site global presence, with manufacturing in Israel, California and Germany. A larger installed base supports upgrades and service, but it does not make equipment demand non-cyclical.
The source presentation reported 19.5% compound revenue growth over a decade, gross margins between 54% and 59% since 2017 and operating margins generally above 24% since 2020. The historical 2019 trough belongs before that latter window. The research also noted complaints about a Tel Aviv trading halt around the August 6 release; those were market-participant complaints, not evidence of an operational disruption.
Q2 results show revenue $254.958M versus $235.308M in Q1 and $219.989M a year earlier: +8.4% sequentially and +15.9% year on year. Products contributed $201.472M and services $53.486M. First-half service revenue grew 25.7%, from $81.574M to $102.531M, versus 10.2% product growth, from $351.771M to $387.735M. The Q3 revenue guide was $277–287M with non-GAAP EPS $2.70–2.85; its $282M revenue midpoint implied +10.6% sequential growth, not a reported result.
Three measurement disciplines and their physical mechanisms
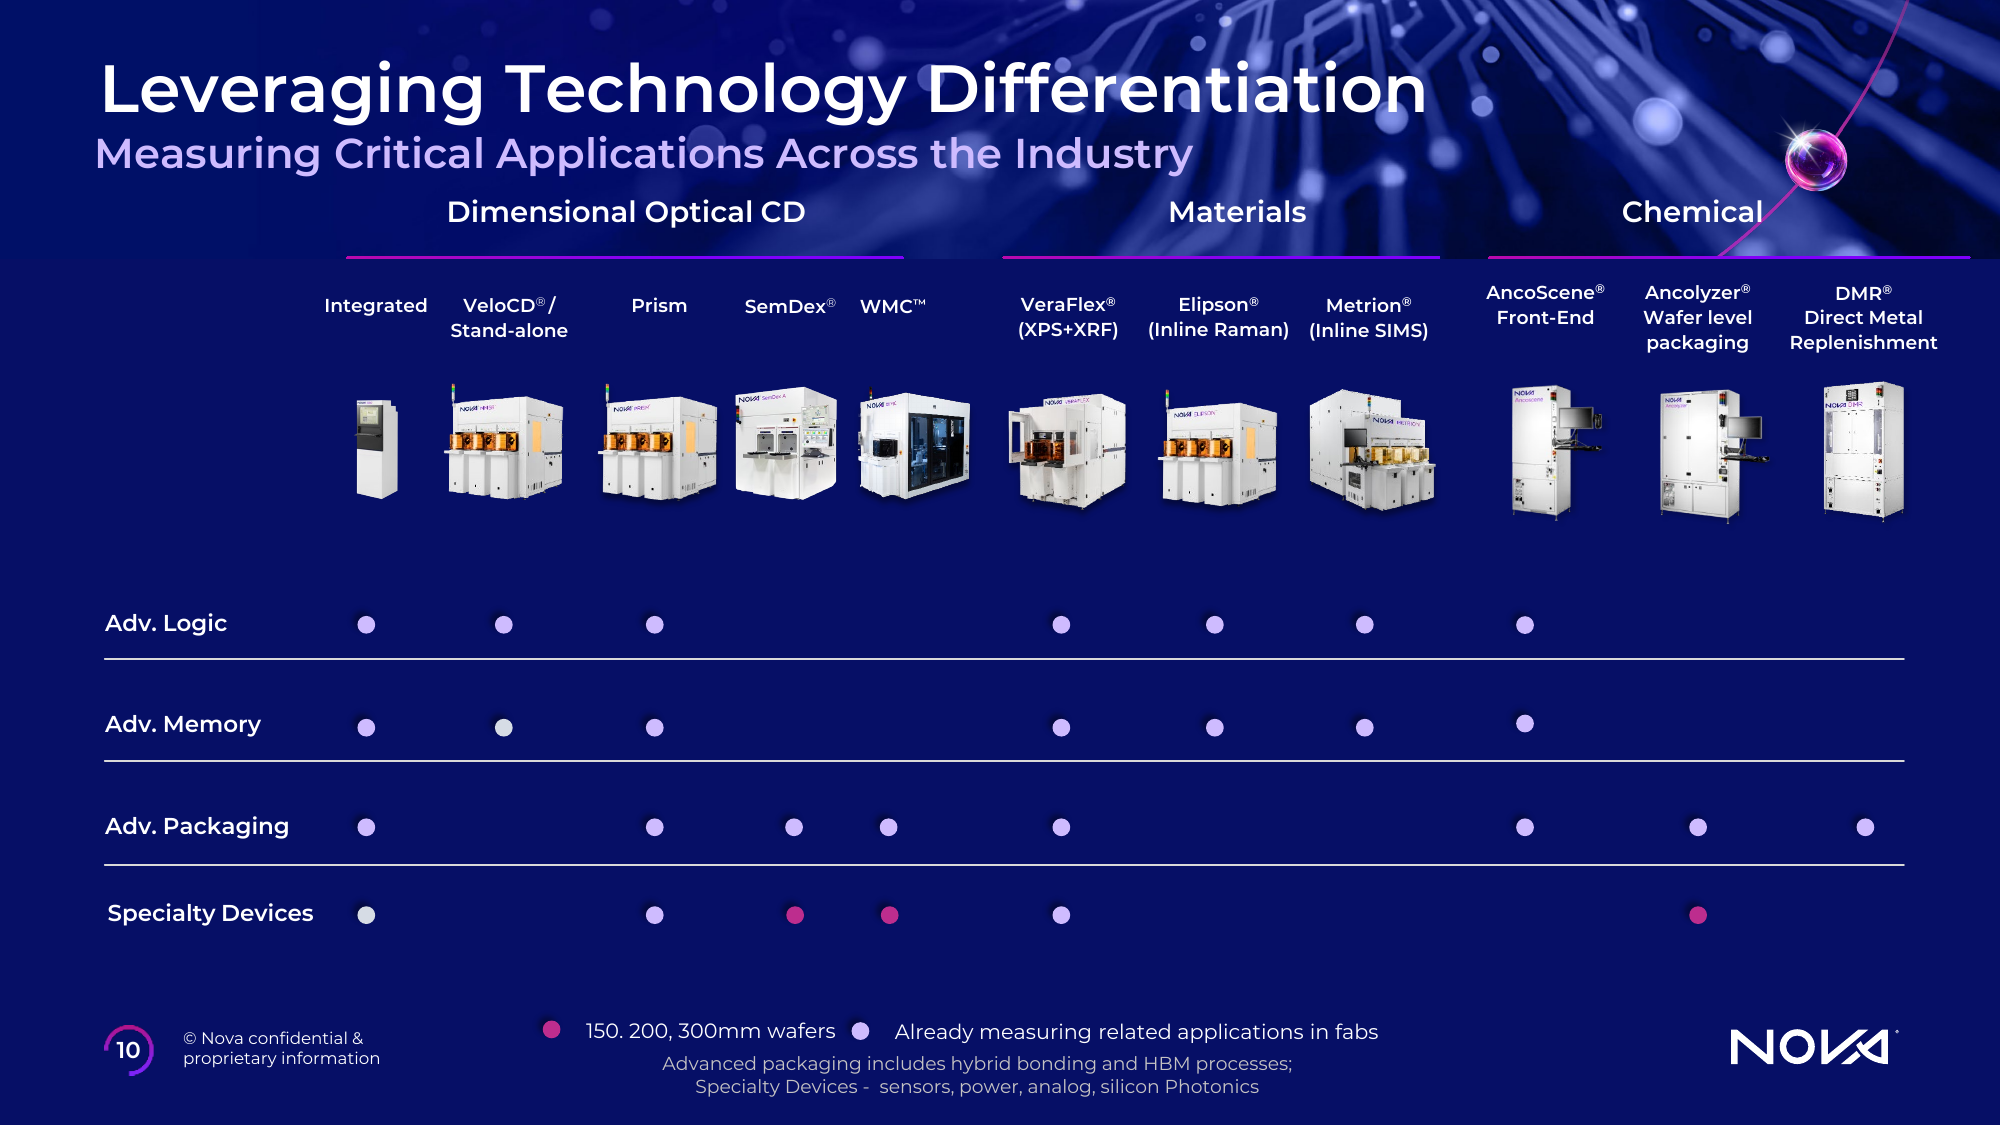
Dimensional optical CD is the classical business — scatterometry, where you shine light on a periodic structure and solve an inverse physics problem to recover a shape you cannot directly see. Materials metrology is where the moat is: VeraFlex combines X-ray photoelectron spectroscopy with X-ray fluorescence, Elipson does in-line Raman for stress and strain, and Metrion does in-line secondary-ion mass spectrometry for doping and trace contamination. Taking that last technique — historically a slow laboratory method — and making it survive a production fab's throughput requirement is engineering that does not get replicated by buying a better camera.
The dimensional family includes integrated modules inside other process tools and stand-alone VeloCD, Prism, SemDex and wafer-level packaging systems. Optical scatterometry collects a diffracted signal and solves an inverse model; different tool configurations serve different structures and substrates.
The Ancosys acquisition added chemical metrology of plating and cleaning baths. Chemistry affects yield as interconnects and packaging add plating steps; Nova competes through in-line analysis and replenishment rather than owning the entire chemistry-measurement market. Its 2025 R&D organisation had 682 people, including 163 doctorates.
Chemical products include AncoScene for front-end analysis, Ancolyzer for wafer-level packaging and DMR for direct metal replenishment. AI-assisted physics modelling combines simulation and machine learning, while Nova Hub supports fleet analytics. Once a measurement recipe is qualified in a customer’s process, replacement requires requalification during production; that creates switching friction, not an absolute lock-in.
Four architecture transitions on the customer roadmap
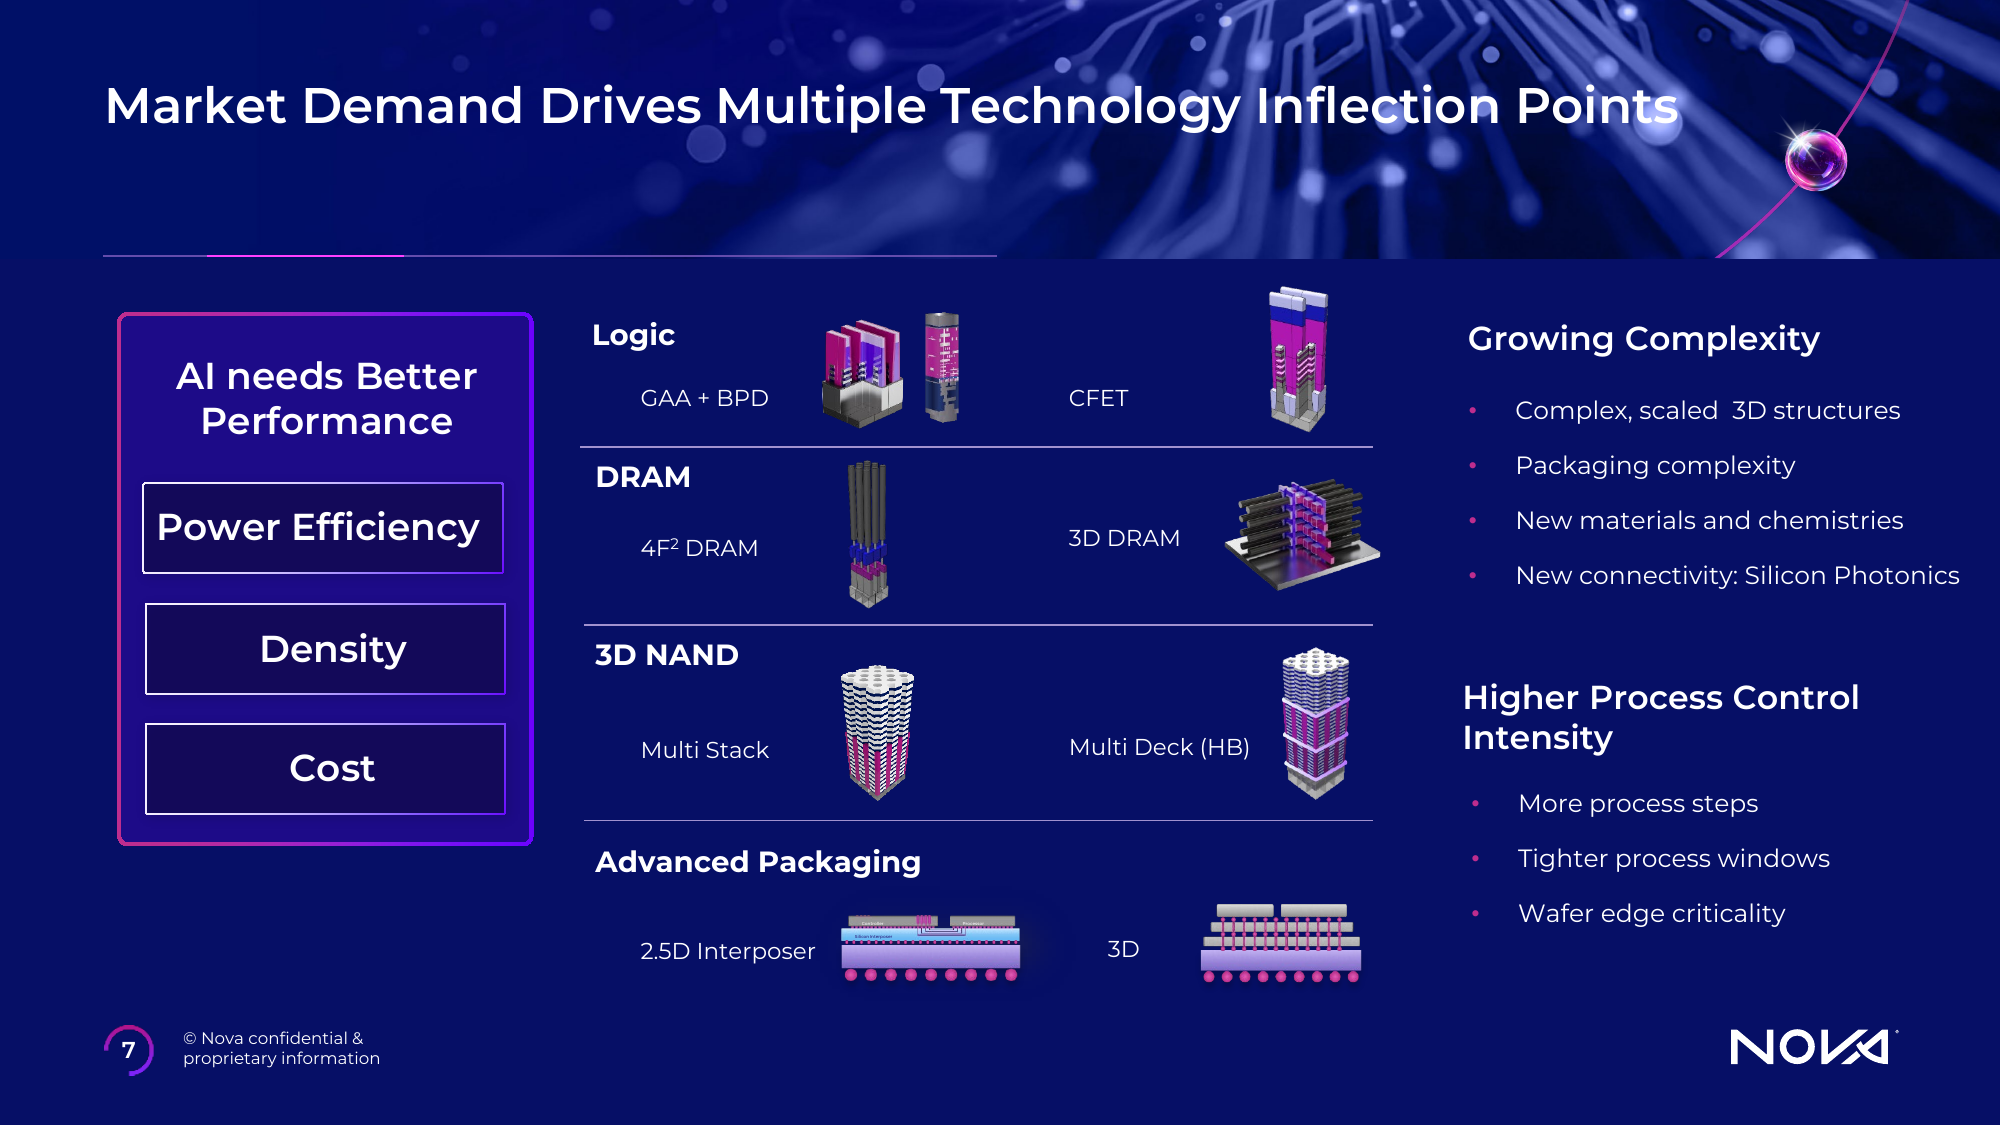
Nova invests approximately 15% of revenue in research and development — $39.3M in the second quarter alone. Four transitions are queued: logic from gate-all-around to complementary stacked devices, DRAM from 4F squared cells to fully three-dimensional arrays, NAND from multi-stack to multi-deck joined by hybrid bonding, and packaging from 2.5D interposers to true 3D integration. Every one adds process steps and tightens process windows.
In materials metrology, the VeraFlex XPS platform continued to gain traction, driven by proliferation in gate-all-around manufacturers as customers continue to increase the number of VeraFlex tools per fab. This traction was one of the factors driving our recent clean room expansion in California, which doubles our manufacturing capacity in the U.S.
The growth mechanism is more metrology tools per fab alongside new fab investment. California capacity expansion is management’s response to expected demand, not proof that all future capacity is sold. Advanced packaging reached nearly 25% of product revenue in the dated call, from very little a few years earlier.
The dated call described advanced-logic-related revenue more than doubling sequentially, led by VeraFlex. Ancosys had record front-end sales across advanced memory and mature logic. PRIZM, Metrion, Elipson and panel-level packaging extend the opportunity set; early platforms should not automatically be treated as secured forecasts.
Quarterly run-rate approached the model; the annual result remains open
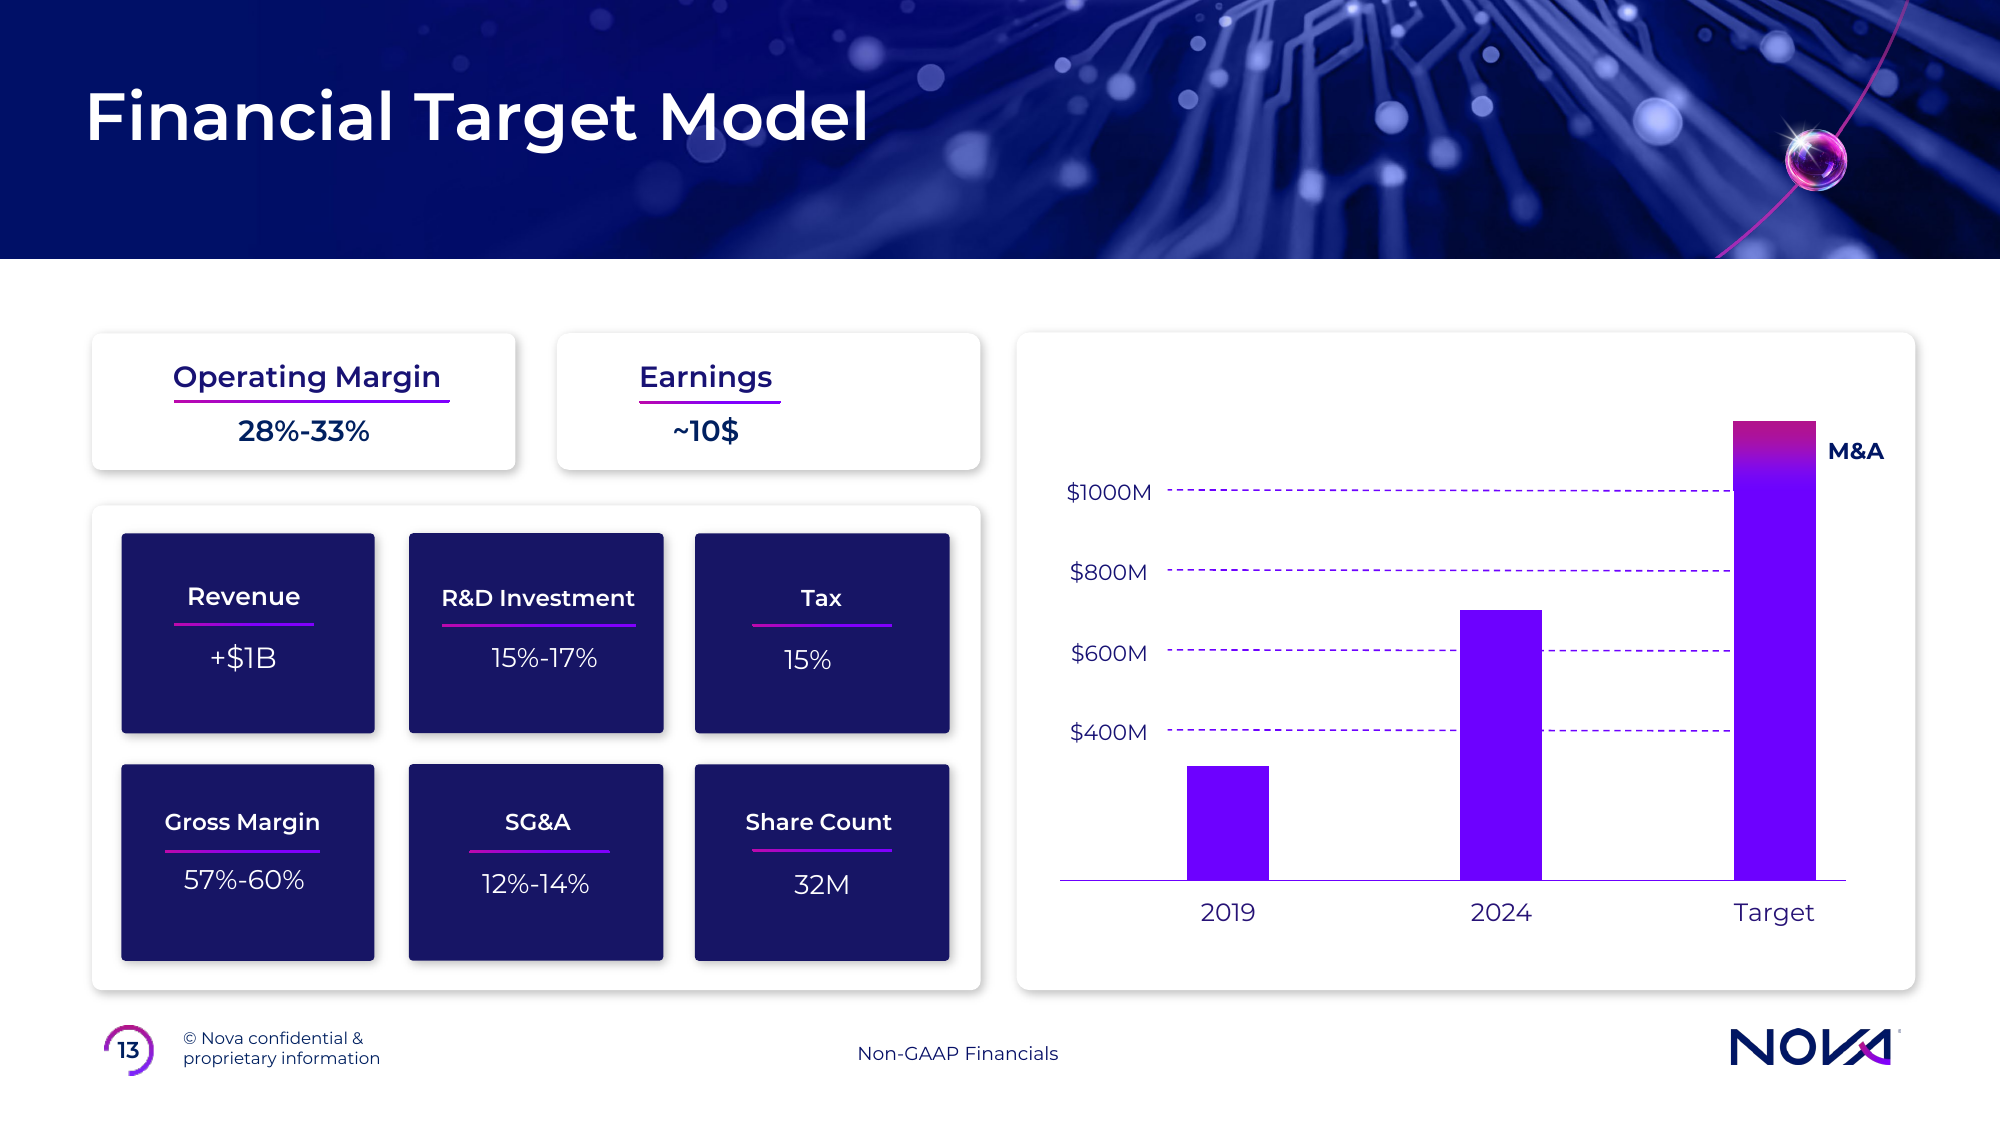
The August price snapshot showed a 5.7% earnings-day fall and a decline of 39.4% from the June 15 close of $606.47 to $367.34. The financial model is a non-GAAP annual target: revenue over $1B, gross margin 57–60%, operating margin 28–33%, and EPS around $10. Q2 revenue of $254.958M annualizes to $1.019832B and $2.51 quarterly non-GAAP EPS to $10.04. Annualization is an illustration, not a completed year. First-half revenue was only $490.266M. Q1/Q2 actual non-GAAP EPS plus the Q3 guide midpoint totals $7.615, not $10; Q3 was still guidance.
The target model is explicitly non-GAAP. Q2 adjusted gross profit of $148.189M divided by revenue gives 58.1%; adjusted operating income of $85.248M gives 33.4%. These differ from GAAP gross/operating margins of 56.5%/29.9%. A quarterly result near the model is evidence of earning capacity, not proof of a sustained annual outcome. The research’s $1.07B revenue and $10.5 adjusted EPS for 2026 are estimates.
We do have visibility into 2027, where our customers are planning further ahead. In some cases, we're already receiving orders and planning the 2027 deliveries. We did see some pulling, by the way, that drove both the first half and are obviously driving the second half of the year.
Earlier orders improve visibility but can bring future spending into the current period. The research also proposed that some metrology spending arrives later than initial fab construction. That is a sequencing hypothesis, not a rule for every tool: metrology is also used during R&D and process development.
Metrology tools go in later when fabs are actually being built out and need to calibrate processes, whereas inspection tools are needed earlier in R&D and process development.
The original sequencing argument also cited $AMAT’s process diagnostics/control and advanced-packaging outlook, and the industry’s limits on space for equipment. These are adjacent-market indicators rather than Nova orders. A factory-capacity constraint can delay shipments even when customer interest is strong. In its August 2026 earnings commentary, $AMAT expected process diagnostics and control revenue to grow more than 50% and advanced-packaging revenue more than 70% in calendar 2026. This supports the broader measurement theme, not a direct forecast for Nova; $KLAC and $ONTO remain relevant peers. Applied Materials Q3 commentary.
Organisation and management track record
Gabriel Waisman became CEO on 31 March 2023, having run global sales, marketing and support as Chief Business Officer since 2016. The organisation chart confirms the three-family framing is not an analyst's construct: Nova runs a Dimensional Metrology Division, a Materials Metrology Division and a Chemical Metrology Division, each with its own general manager. Revenue went from $517.9M in 2023 to $880.6M in 2025 under this team, with net margin expanding from 26.3% to 29.4%.
The source identified Guy Kizner as CFO, Shay Wolfling as CTO and Eitan Oppenhaim as board chair. The divisional managers were Effi Aboody, Adrian Wilson and Thomas Schütt. From 2023 to 2025, the $517.9M-to-$880.6M revenue change implies 30.4% annual compound growth; operating margin rose 25.5% to 28.8% and net margin 26.3% to 29.4%. This record does not guarantee performance through a future AI-demand downturn.
The research noted Form 144 notices in February, May (three), June and July 2026. A notice is a proposed-sale filing, not proof that every proposed share was sold. Recurring notices can be consistent with planned executive sales; they also do not establish insider buying into the drawdown.
China, concentration, cash collection and financing
The $59.4M receivables cash-flow adjustment differs from the $58.35M balance-sheet increase ($210.279M minus $151.929M); cash-flow adjustments can include currency and other effects. H1 operating cash flow was only 56.1% of $144.269M net income, with cash capital spending of $6.543M. The presentation’s $218M free-cash-flow number belongs to 2025, not a current annualized run rate. Net liquidity uses cash, deposits and securities less convertible debt, not cash alone.
Historical August price and options snapshot
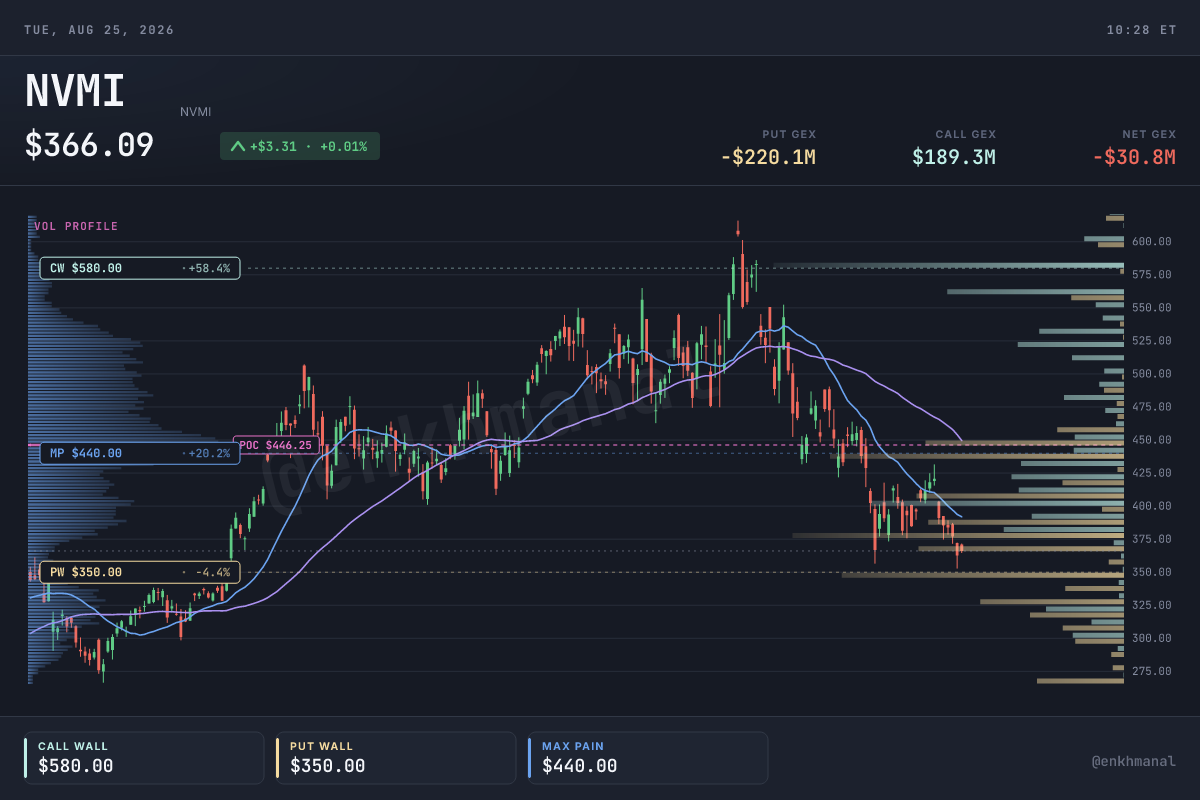
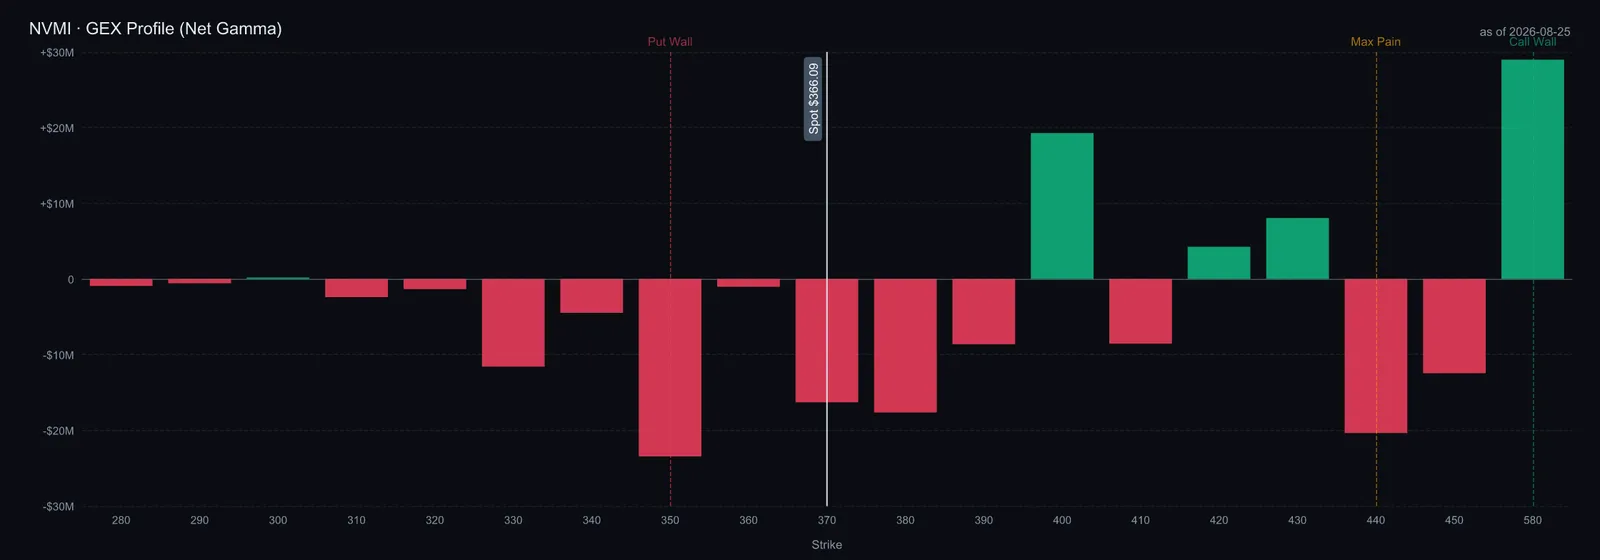
The dated August options snapshot showed an estimated put wall at $350 and call wall at $580. These are concentrations in option positioning, not guaranteed support or resistance. Current positioning can differ, so this map is retained as historical context rather than a present trading signal.
Historical valuation and explicit assumptions
Historical ranges in this table refer to different periods.
At the historical $367.34 reference, equity value was about $11.5B. Using approximately $985M of net liquidity after convertible debt gives enterprise value near $10.5B. Against the research assumptions of $1.07B 2026 revenue and $10.5 non-GAAP EPS, the ratios were about 9.8× enterprise value/revenue and 35.0× price/earnings. At $9.42 assumed GAAP EPS, P/E was 39.0×. These were estimates, not completed 2026 results or current valuations; the unmatched-period peer ranges below do not prove a contemporaneous valuation discount.
The 2027 scenarios use the historical $367.34 reference and no time-value discount. EPS $10.0 × 24 gives $240, a 34.7% decline; $13 × 35 gives $455, +23.9%; $16 × 40 gives $640, +74.2%. The original $245 bear price was inconsistent with its stated $10 × 24 assumptions. No probabilities or present-value targets are implied.
Scenario terms: non-GAAP EPS; P/E. All prices use the dated August reference. NAND and GAA are the memory and logic architectures named in the scenarios.
Conclusion: constructive on the business mechanism. More demanding chip architectures can increase measurement spending per wafer, and Nova’s materials and chemical portfolio positions it to compete for that spending. The investment case depends on orders becoming shipments and collected cash, not on a claim that the model has already been fully achieved. China exposure, customer concentration, pull-forward and cash collection can outweigh technical progress. The September conference is historical; the next earnings evidence is scheduled November 5 and the next Investor Day March 9, 2027.