
$LPTH Deep Dive — The glass inside the next generation of infrared systems
A thermal camera begins with an unglamorous problem: getting invisible light onto a detector without losing the information in it. LightPath Technologies is trying to turn that optical task into a larger position in defense imaging. Its opening is a combination of useful glass, domestic manufacturing and the chance to sell a complete camera where it once sold a lens.
I see a credible growth inflection: domestic infrared sourcing, more camera content per system and improving factory economics can reinforce one another. The September results provide early operating evidence for that opportunity. My investment case is bullish on this transition, with exposure tied to execution and the ability to absorb delays. Valuation helps test the expectations embedded in the share price; it does not by itself determine whether to take the opportunity. This memo uses information available September 15, 2026; fiscal years end June 30.
What Changed
LightPath finished FY26 with $71.7 million of revenue, up 92.7%, and a June backlog of $110.9 million. The fourth quarter delivered $21.2 million of revenue and a 39.4% gross margin, compared with $12.2 million and 22.0% a year earlier. This is evidence that the acquired camera business and a richer product mix are moving through the factory. It is also a different starting point from the small optics supplier investors remember. FY26 results
The less obvious change is where the constraint now sits. Management says BlackDiamond glass capacity remains tight, some infrared detector lead times have stretched from roughly six months to ten months or more, and the final major G5 camera redesign is behind schedule. A better lens material cannot shorten a detector supplier’s queue. The next stage therefore depends on production engineering and purchased components as much as customer interest.
The geopolitical incentive remains, but it needs precise wording. China’s November 2025 announcement suspended the specific US-directed restrictions in the second paragraph of its December 2024 announcement through November 27, 2026; that is not a declaration of unrestricted trade in defense materials. LightPath also points to US procurement policy aimed at reducing reliance on covered countries. I underwrite a continuing incentive to qualify domestic alternatives, without assuming a blanket deadline that awards all displaced germanium demand to one supplier. MOFCOM announcement · Company policy discussion
Thesis
The opportunity has three connected parts. First, chalcogenide glass can give an infrared designer a different combination of transmission, thermal behavior and moldability. Second, integrating those optics with camera electronics can raise LightPath’s content per system. Third, defense qualification can make an installed design difficult to replace. Each step creates value only if the previous one works in a real product and the customer actually orders it.
My constructive case rests on that chain, rather than on the chemical formula alone. LightPath has already demonstrated better quarterly economics and won meaningful camera orders. A supplier that helps a prime contractor reduce optical complexity while qualifying a domestic supply chain has something valuable to sell. The open question is whether this becomes a repeatable platform business with enough scale to absorb engineering, inventory and factory investment.
I would strengthen the thesis when the remaining G5 redesign ships in volume, backlog converts without another large working-capital build, and disclosed production orders replace program-potential estimates. I would weaken it if gross margin stalls while capital spending rises, detector shortages repeatedly defer shipments, or program awards require materially more equity funding. These are milestones for increasing or reducing conviction. Requiring every milestone before taking any exposure can surrender the return from recognizing the transition early.
Business & Backdrop
LightPath sells visible and infrared optics, assemblies, and camera systems. In FY26, infrared products contributed $21.2 million, or 29.6% of revenue; visible products $15.5 million, or 21.6%; assemblies $31.9 million, or 44.5%; and engineering $3.2 million, or 4.5%, with rounding. The distinction matters: a camera integrates lenses, a detector and electronics, whereas a standalone optic captures only one part of that bill of materials. LightPath purchases detectors; it does not acquire their semiconductor economics merely by assembling a camera. 10-K
The transformation has been bought as well as built. Visimid added camera engineering in 2023; G5 Infrared added cooled-camera products in February 2025; Amorphous Materials added glass-making capability in January 2026. Of the $23.5 million FY26 increase in assembly revenue, $23.1 million was the increase attributable to G5. Comparing a full year with a partial acquisition year inflates the apparent organic growth rate. The strategic progress can be real while the headline growth rate remains a poor extrapolation.
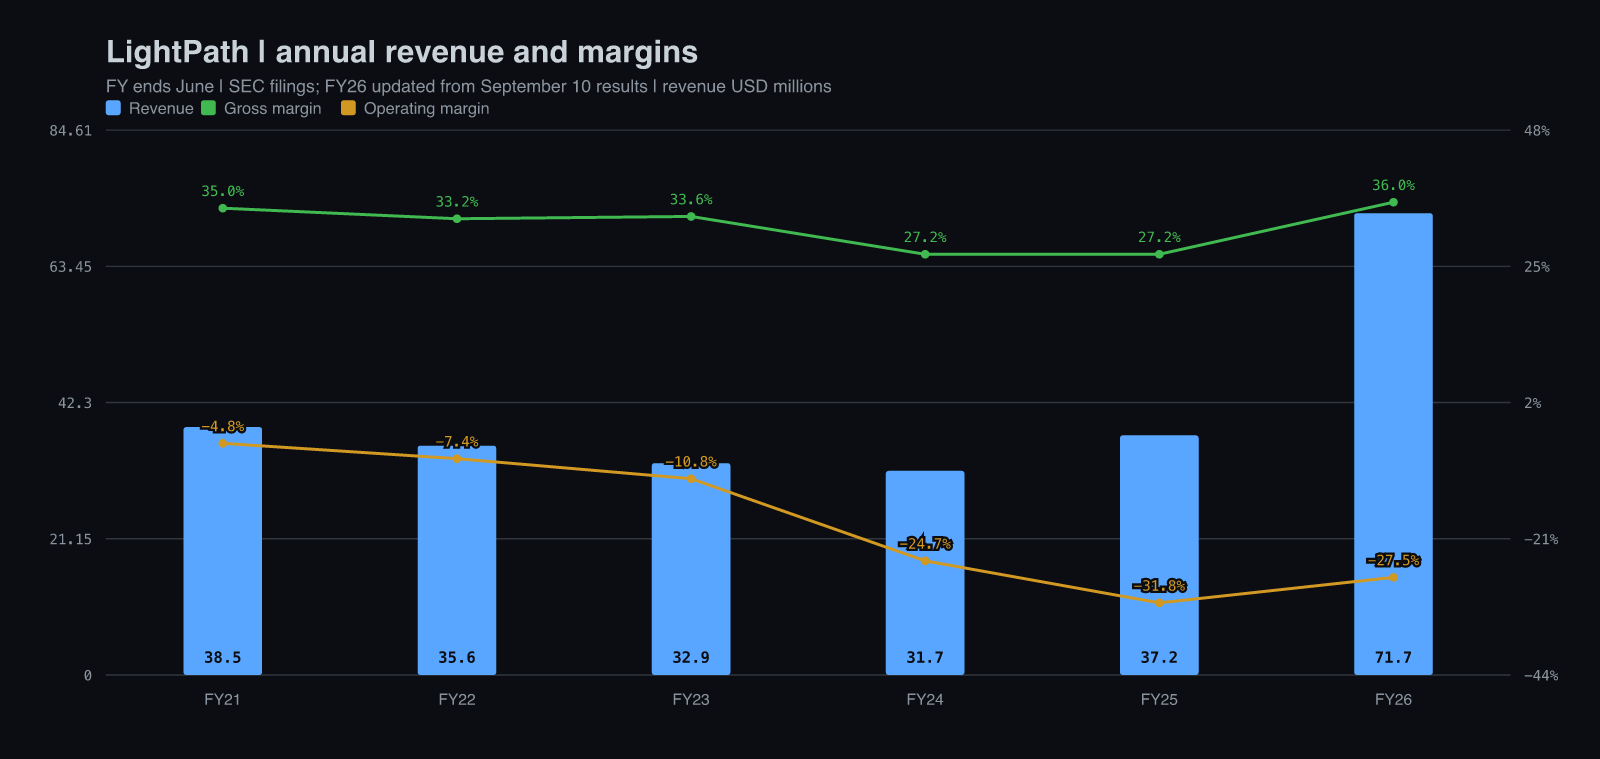
The longer history shows why this transition matters. Annual revenue in FY21, FY22, FY23, FY24, FY25 and FY26 was approximately $38.5m, $35.6m, $32.9m, $31.7m, $37.2m and $71.7m. Gross margin across those years was approximately 35.0%, 33.2%, 33.6%, 27.2%, 27.2% and 36.0%; operating margin was approximately −4.8%, −7.4%, −10.8%, −24.7%, −31.8% and −27.5%. The older component business was shrinking before acquisitions changed the revenue base. FY26’s large earnout remeasurement also depresses its reported operating margin.
Two larger suppliers corroborate the demand environment, without proving LightPath’s market share. Teledyne ($TDY)’s Q2 2026 Digital Imaging revenue rose 12.7% to $868.7 million, with operating income of $170.2 million versus $119.6 million. Leonardo $DRS’s Advanced Sensing and Computing revenue rose 8% to $587 million, with adjusted EBITDA of $69 million and an 11.8% margin versus 10.7%. These are diversified segments with different products. They support the case for healthy sensing demand; they are not clean valuation comparables. Teledyne filing · Leonardo results
Technology & Moat
A thermal lens must transmit the wavelength its detector sees, focus it accurately and remain useful as the environment heats or cools. Ordinary visible-light glass is not a universal answer. Infrared designers choose among materials with different transmission windows, refractive indices, dispersion, hardness and temperature sensitivity. Changing one material can force a redesign of the whole optical assembly. That is both the opportunity and the switching cost.
BlackDiamond is a family, not one universally exclusive substance. LightPath’s BD6 and BD2 offerings include established chalcogenide compositions that other suppliers can also manufacture. Its licensed Naval Research Laboratory compositions are a different part of the portfolio: the company obtained an exclusive license in December 2021 and commercialized BDNL-4 in April 2024. The practical advantage must be evaluated at the level of the specific material, manufacturing process and qualified optical design. Calling every germanium-free glass proprietary would overstate the moat.
The 2015 study by LightPath researchers compared As40Se60 and Ge28Sb12Se60 lens designs across −40°C to 85°C. The former performed better thermally in the tested configurations. The authors warn that one material constant cannot predict an entire lens’s temperature response. Research paper
The tradeoff is concrete: As40Se60’s glass-transition temperature is 185°C versus 285°C, helping molding. But its Vickers hardness is lower, 142 versus 189, and expansion higher, 20.9 versus 14.5 ppm/°C. Better processing choices come with different durability and thermal-compensation requirements.
The August investor deck gives a tangible system example: a traditional 3× zoom design uses 21 optical elements, while a design combining BlackDiamond materials uses 12. That is nine fewer elements, approximately 43%, in the illustrated design. Fewer elements can reduce alignment work, surfaces and assembly complexity. Actual savings depend on fabrication yield, coatings, aperture, detector choice and qualification cost. The deck does not establish that every customer camera becomes 43% cheaper. Investor deck, page 9
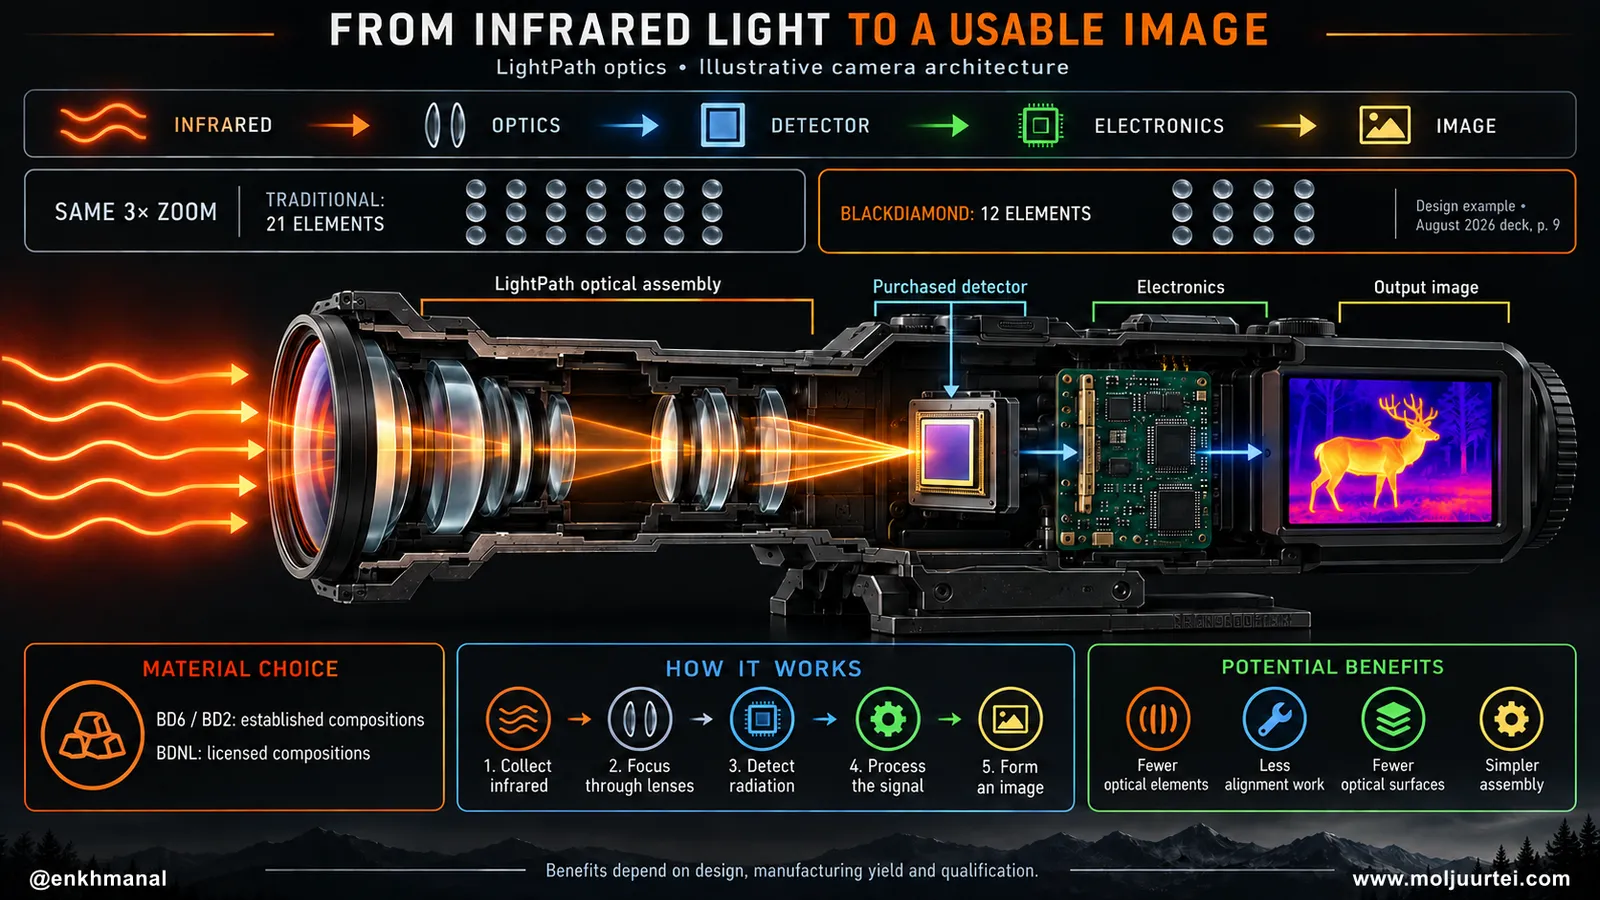
The commercial moat is therefore a stack of capabilities: producing consistent glass, forming and coating precision surfaces, solving the optical design, integrating the camera, and getting that assembly qualified. Qualification ties the approved configuration to a customer’s program, making substitutions costly and slow. It can protect a production slot; it cannot turn a development discussion into an awarded slot. Competing germanium-containing optics, other chalcogenide suppliers and alternative system architectures remain credible options.
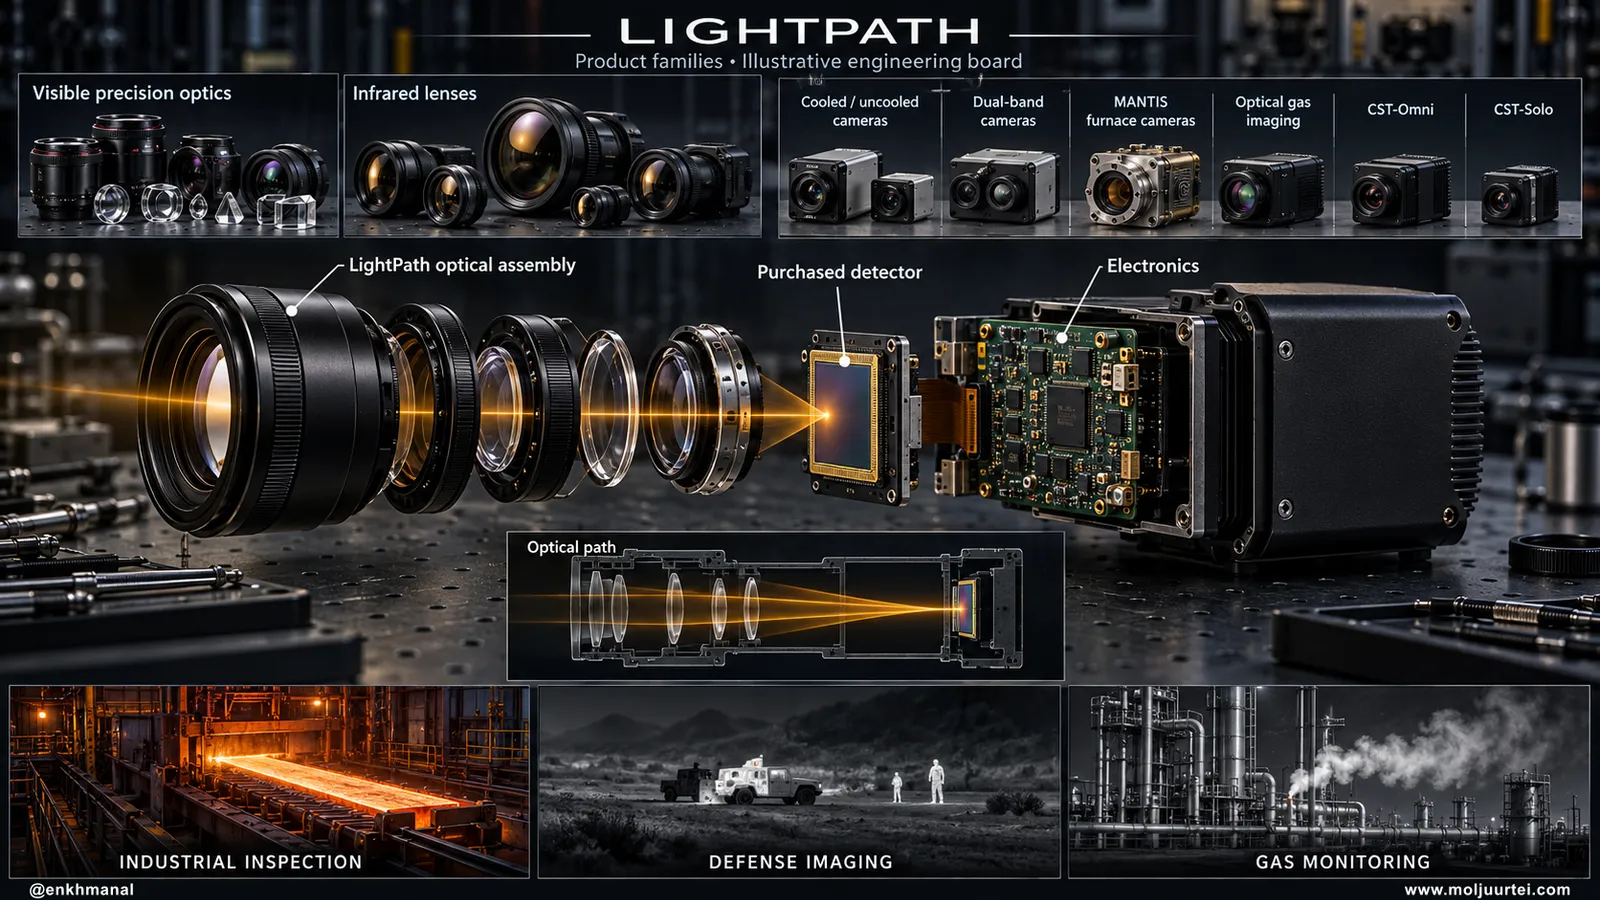
The products make that stack visible. LightPath’s disclosed range includes cooled and uncooled infrared cameras, dual-band imaging, optical gas imaging, MANTIS furnace cameras, and CST-Omni/CST-Solo systems, alongside visible and infrared optics. A furnace inspection camera and a missile seeker need different packaging, qualification and buying cycles. Shared glass know-how helps, but each application must earn its own production economics. Product portfolio
Roadmap & R&D
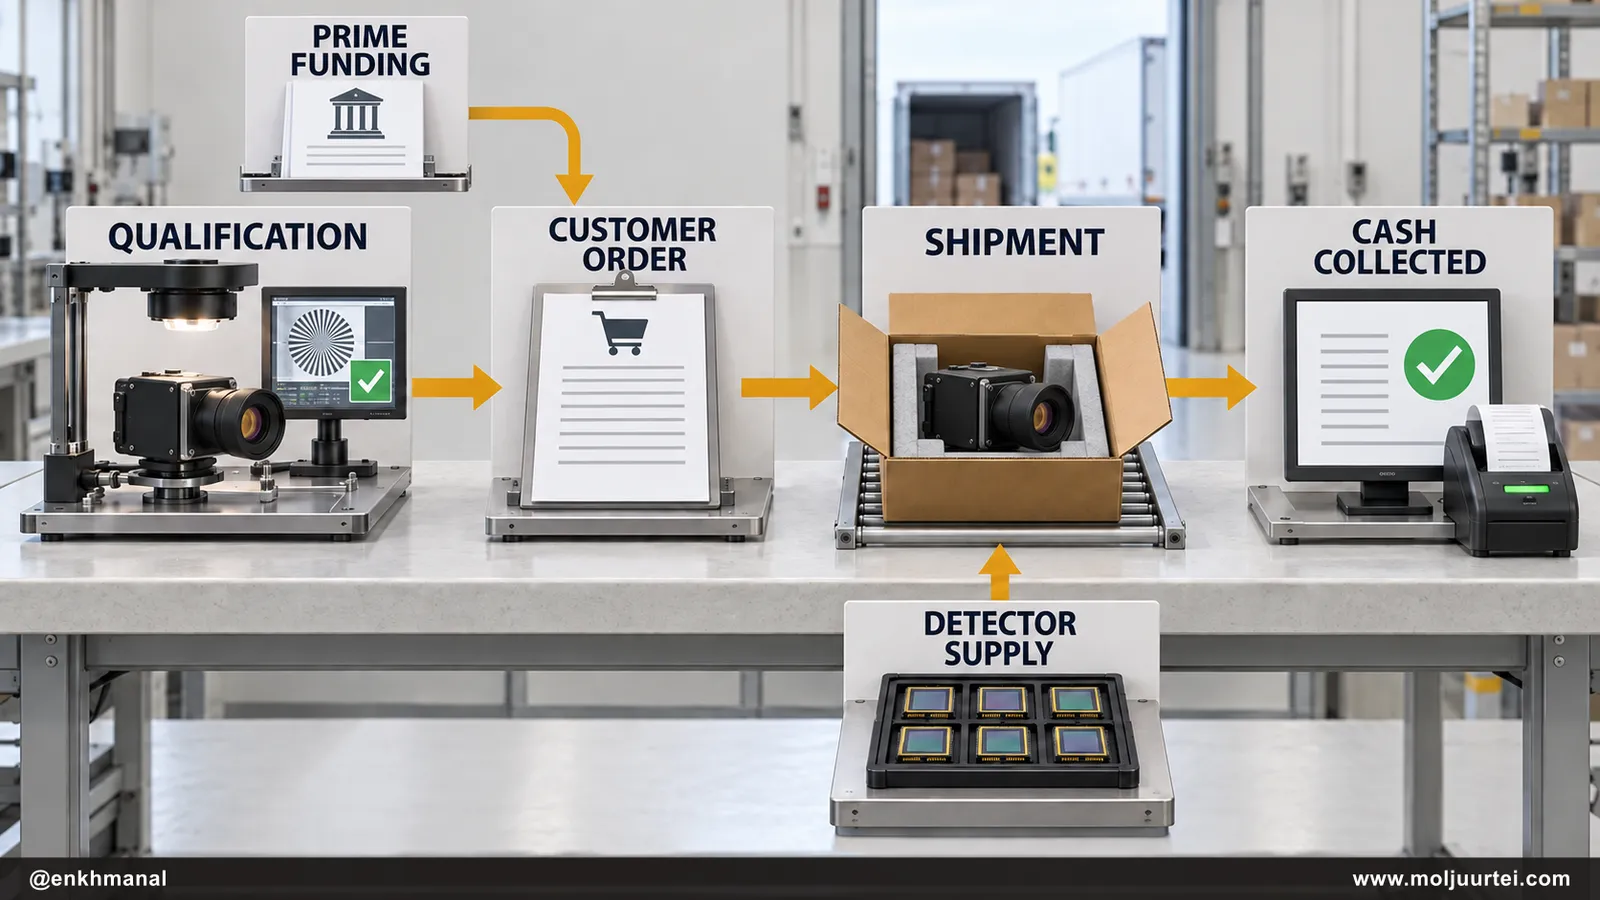
The nearest opportunity is completing the G5 product conversion and expanding usable glass output. Owning a furnace or increasing melt capacity is only the first step. Large-aperture material must meet quality requirements; lenses need to be processed; detectors must arrive; the integrated camera must pass customer acceptance. I want shipment and yield evidence at each stage. Buying Amorphous Materials improves control over a critical process, while leaving the burden of scaling that process inside LightPath.
Defense programs provide considerable upside with distinct purchase stages. The August deck attaches $50–100 million of potential annual revenue to the Army’s Next Generation Short Range Interceptor program and $10–20 million to the Navy panoramic-imaging program. Those are management’s program-potential figures, not contracted annual sales guidance. The Army’s Next Generation Short Range Interceptor program remained a selection and testing opportunity, and September commentary described another timing delay. The Navy panoramic-imaging program’s disclosed position is further along, but production ramp timing still matters. Neither program’s full potential belongs in a near-term revenue forecast by default.
Management discussed seven heat-seeking platforms, including three associated with Lockheed Martin, in the latest call. That is a useful pipeline disclosure, not seven production wins. Border-surveillance funding reaching prime contractors likewise had not yet become a LightPath camera order. Space applications remain a longer development cycle. I keep the model anchored to existing shipments and scheduled backlog, with program upside expressed through scenarios. The missing step is the purchase order.
The Setup — What Could Be Mispriced
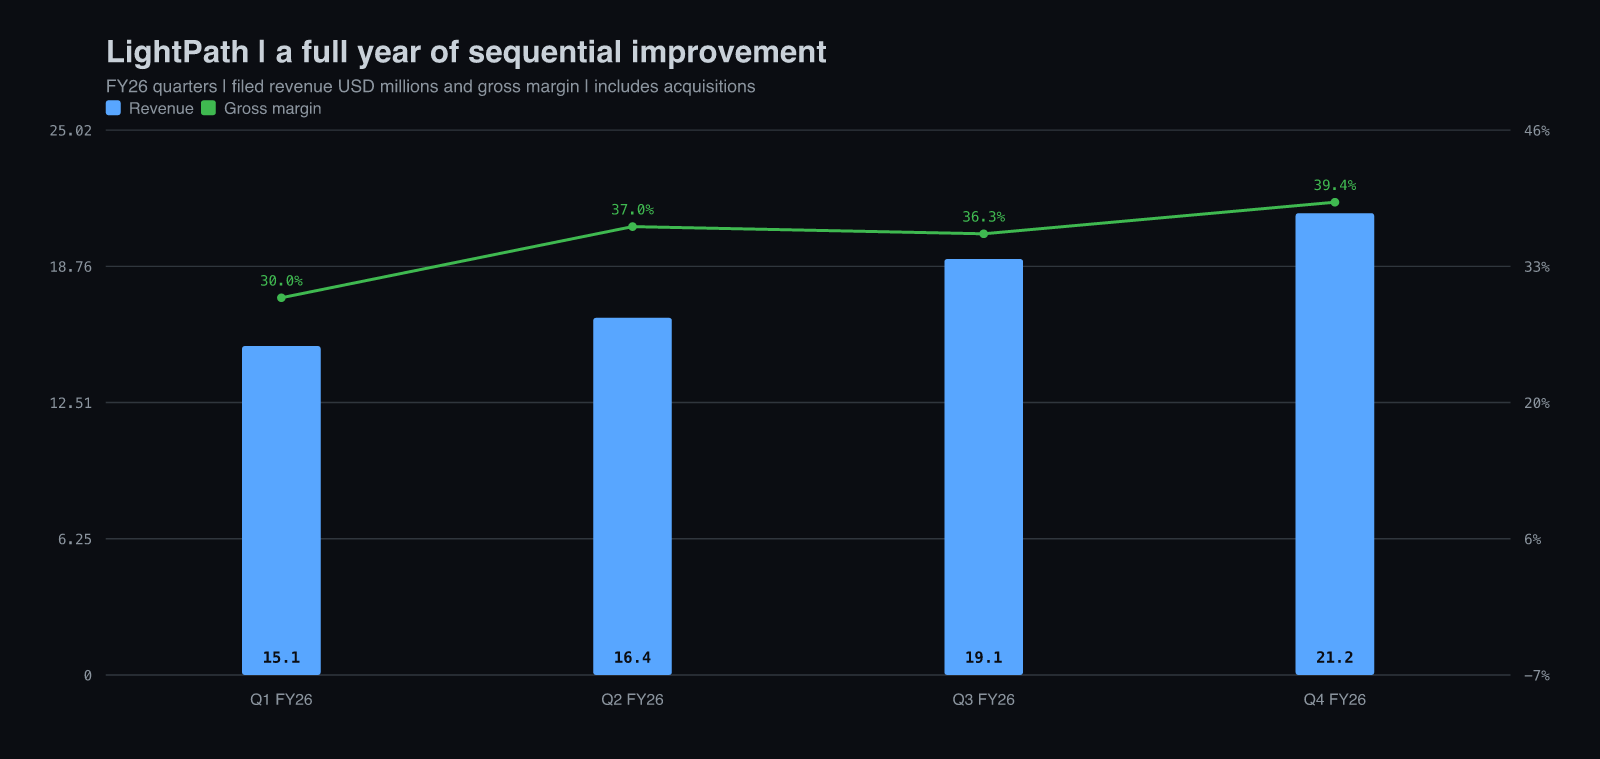
The quarterly trend is encouraging. FY26 Q1, Q2, Q3 and Q4 revenue was $15.1m, $16.4m, $19.1m and $21.2m; gross margin was approximately 30%, 37%, 36.3% and 39.4%; adjusted EBITDA was approximately $0.4m, $0.6m, $1.1m and $2.1m. Four improving revenue quarters and a materially stronger exit margin are better evidence than a single backlog headline. The Q4 release attributes the progress to volume, mix and the integrated business, while also identifying higher compensation costs.
Backlog quality needs a closer reading. The June balance was only $0.3 million above March’s $110.6 million, despite strong year-over-year growth. Customers requested delivery of $85.6 million within the following twelve months. That schedule supports visibility but is not a quantified FY27 revenue outlook: shipment timing, acceptance and cancellation risk still exist. July’s $11 million camera follow-on and $13 million optical-assembly order are further evidence of demand, but adding both to June backlog without subtracting intervening shipments would invent a current backlog figure.
Cash conversion is the remaining financial test. FY26 adjusted EBITDA was $4.2 million, but operating cash flow was negative $10.2 million and capital spending was $6.3 million, giving approximately negative $16.5 million of free cash flow. Operating cash flow includes $3.8 million of G5 earnout payments; excluding those analytically still leaves roughly $6.4 million of operating cash outflow and $12.7 million after capital spending. Inventory and receivables absorbed capital. Positive adjusted EBITDA has not yet made the business self-funding.
The income statement also needs a careful bridge. FY26’s $20.5 million net loss includes a $15.6 million noncash earnout remeasurement; Q4’s approximately $4.1 million loss includes $3.4 million of that charge. Removing an accounting mark can clarify operations, but the earnout is still an economic acquisition cost. Stock compensation was $2.9 million for the year and is also an owner cost. My forecasts remove the unusual remeasurement, retain recurring expense and separately account for the remaining cash and stock consideration.
Management & Track Record
Sam Rubin’s team deserves credit for the margin trajectory. In the November 2025 Q1 call, management described a goal of reaching roughly 35% gross margin by fiscal year-end. Q2 was already around 37%, Q3 held above 36%, and Q4 approached 40%. The business also produced positive adjusted EBITDA across the year. Those are delivered operating milestones, even allowing for acquisition mix. They support the claim that integration is improving the factory’s economics.
Delivery timing has been less reliable. Across the February and May calls, management expected the G5 redesign program to progress through summer and autumn 2026. In September, the last major redesign was behind schedule, with glass-production tuning and detector availability involved. The Army’s Next Generation Short Range Interceptor program selection timing also moved. Reading four calls changes the emphasis: the team has demonstrated margin improvement, while customers, components and qualification have repeatedly controlled the calendar. I give more weight to shipped revenue than to the next confident timetable.
Capital allocation is equally important. Cash reached $93.2 million at June 30, supported by approximately $120.2 million of net equity proceeds during FY26. Common shares increased from 42.95 million to 69.96 million over the fiscal year; the September 8 cover-page count was 70.04 million. The balance sheet buys time to execute, but the share count shows who financed that time. I judge the acquisition strategy on future cash generated per diluted share, not on acquired revenue alone. Capital structure
Risks
The main operating risk is that qualification and capacity do not line up. LightPath can secure customer interest before it has reliable high-volume output; it can also invest in equipment and inventory before program schedules firm up. Either mismatch consumes cash. Detector lead times compound the issue because they sit outside the glass operation. A quarter of lower shipments can reflect timing rather than lost demand, but repeated delays eventually change the return on invested capital.
The main competitive risk is confusing a head start with permanence. Other producers can supply established chalcogenide formulations, and customers can redesign around alternative materials or suppliers. Larger defense imaging companies have deeper integration resources. LightPath’s advantage is strongest where its specific combination of optics, manufacturing and approved camera design saves the customer time or system cost. It is weakest where a customer simply needs a generic glass blank. Program-level evidence is therefore more valuable than broad claims about a protected material category.
The China exit also has a commercial tail. The announced Zhenjiang subsidiary disposal involves approximately $4.5 million paid over five years by a management-related buyer, alongside a five-year supply arrangement initially at cost plus 10%, with the markup increasing as payments are made. At this research cutoff, I found an expected September closing rather than a confirmed completion. A divested legal entity can remain a supplier. Treating the transaction as the instantaneous elimination of every China-linked commercial input would misread the disclosed arrangement. 10-K disposal terms
There is a defined acquisition obligation ahead: the final $9 million G5 earnout comprises $6.3 million in cash and $2.7 million in stock, payable in January 2027. This is separate from the $15.6 million FY26 accounting remeasurement. Remaining preferred shares, awards and future financing can also dilute common owners. My downside case includes a slower revenue ramp and less margin expansion; a material production failure or another large acquisition could be worse than that modeled case.
Price Setup
At the September 14 close of approximately $9.11, the latest filed common count implies about $638 million of equity value. Subtracting $93.2 million of cash and adding roughly $0.8 million of funded debt and finance leases gives approximately $546 million of enterprise value, before acquisition obligations or dilution adjustments: about 7.6 times FY26 revenue. The useful question is how that revenue base can change as camera programs enter production and glass capacity expands. This multiple is a snapshot of an unfinished transition. It flags sensitivity to slower growth, but it cannot capture the opportunity without assumptions about future volume, mix and cash generation.
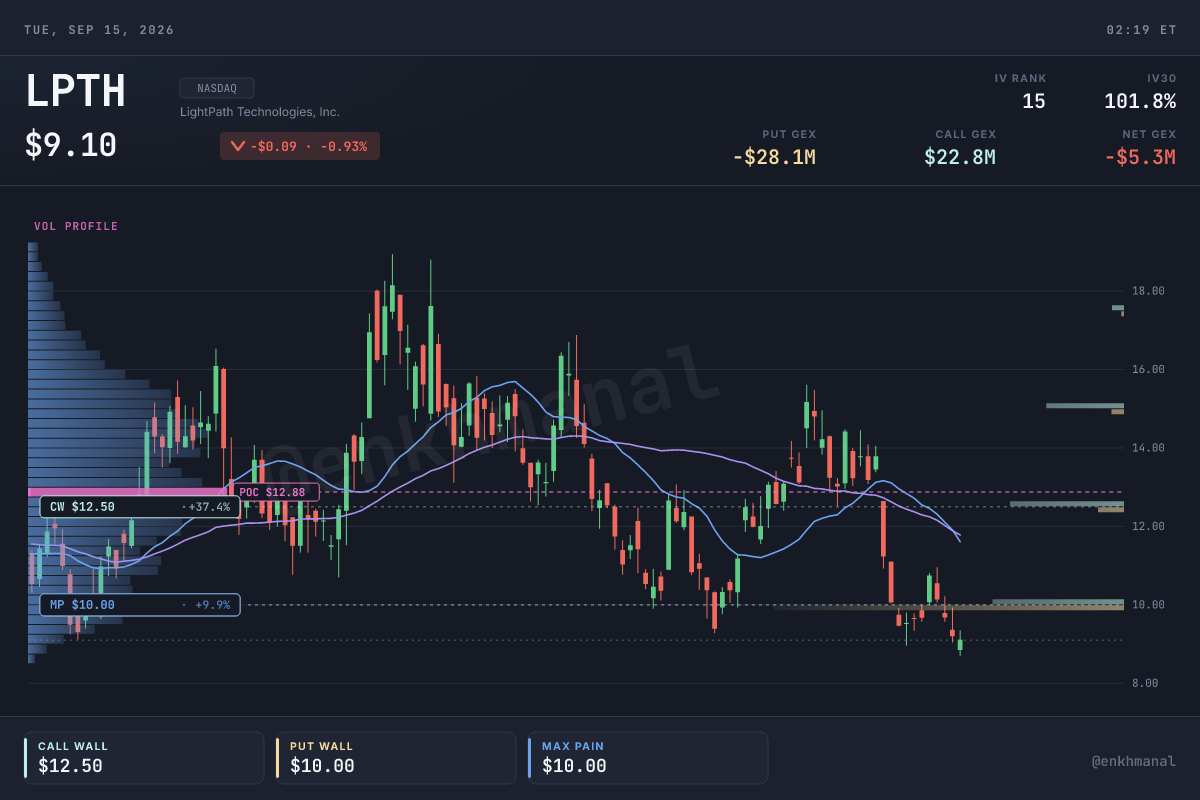
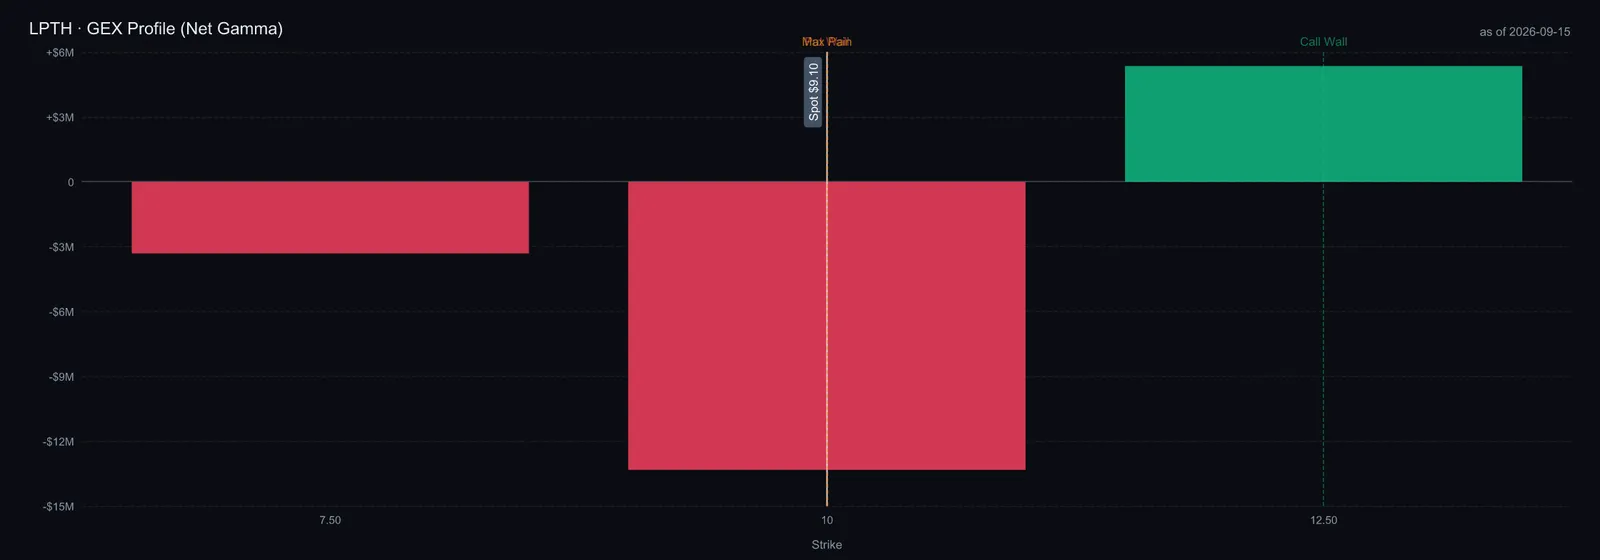
Options positioning adds timing risk rather than intrinsic value. The latest snapshot shows approximately negative $5.3 million of net gamma exposure, a $12.50 call wall and a $10 put wall, with an open-interest put/call ratio near 0.46. Spot is below the put wall, so that strike should not be described as a floor. Roughly 102% thirty-one-day implied volatility, and still higher volatility around the imminent expiry, indicate a wide distribution of possible moves. Positioning can change rapidly as contracts expire or dealers hedge.
The existing combination of sequential growth, improving margins and follow-on orders can support a staged investment before every program reaches production. I would begin only with exposure whose potential loss fits a predefined portfolio risk budget, then add when redesign completion, shipment growth and cash conversion strengthen the expected return. I would reduce exposure if customer qualification fails, repeat orders disappear or cash needs rise without a credible path to productive capacity. A timing delay with intact demand calls for a revised schedule; a broken customer or manufacturing premise calls for a revised thesis. High implied volatility makes short-dated options a poor match for a thesis whose catalysts can slip, and a stop order cannot guarantee the loss on a gap. GAAP losses make trailing P/E and PEG unhelpful here. Forward operating outcomes, dilution and valuation sensitivity belong in the same decision.
Valuation
I built a ten-year, unlevered cash-flow model for FY27–FY36. Every forecast revenue figure is my estimate. The latest release and earnings call provide no quantified total FY27 revenue guidance; scheduled backlog and management’s longer-term ambition are not substitutes. The base revenue path is $100m, $125m, $155m, $190m, $225m, $250m, $275m, $297m, $315m and $328m. This already assumes a much larger business, successful execution and continued customer adoption. No additional acquisitions are included.
The base gross margin rises from 39% to 46%; selling, general and administrative expense falls from 28% to 17% of revenue. R&D remains 5%, with 2% of revenue retained for other recurring operating expense, including amortization. Capital spending fades from 10% to 5% of revenue and depreciation from 6% to 4%. Working capital consumes 35% of incremental revenue, close to FY26 receivables plus inventory less payables relative to sales. I tax positive operating income at 25%, without assigning value to loss carryforwards. The discount rate is 13%, with 2% perpetual growth.
Per-share arithmetic is explicit. I use $86.1 million of adjusted net cash: $93.2 million cash less approximately $0.8 million funded debt and finance leases and the $6.3 million future G5 cash payment. Operating rent remains in expenses. FY27 starts at an assumed 75 million diluted shares, versus 70.04 million latest filed common shares, allowing for roughly 3.02 million preferred-conversion shares, stock consideration and an awards buffer. Shares then grow 0.5% annually to approximately 78.44 million. This is a modeling assumption, not a filed fully diluted count; preferred redemption value is not also deducted when conversion is assumed.
The bear case reaches $120 million revenue in FY31 and $141 million in FY36, with a 40% terminal gross margin and 14% discount rate. The base reaches $225 million and $328 million, with 46% gross margin and 13%. The bull reaches $330 million and $499 million, with 50% gross margin and 12%. FY36 free cash flow is approximately $9.2 million, $46.3 million and $89.4 million respectively. These cases span different production outcomes; none assumes that a named program’s advertised potential is already booked revenue.
Under perpetual cash-flow growth, estimated value is approximately $1.37 per share in the bear case, $3.07 in the base and $5.77 in the bull. Using an illustrative 15× FY36 EBITDA terminal multiple instead produces $2.19, $6.26 and $11.55. That multiple is a sensitivity assumption, not a peer-derived fair multiple. I do not average the two methods: the large difference shows how much value depends on a future buyer continuing to pay a premium for the business after the explicit forecast ends.
A reverse check makes the hurdle tangible. Holding the base margin path, expense ratios and dilution constant, and scaling every forecast revenue year together, the 15× exit model needs approximately 1.58 times the base revenue path to match $9.11. That means roughly $158 million in FY27, $356 million in FY31 and $519 million in FY36. This is a mathematical sensitivity, not an achievable growth forecast or management guidance. It is one conditional path to that price, not a minimum FY27 revenue threshold: different ramp timing, margins, capital intensity, discount rates or terminal assumptions produce different paths. I use it to identify which operating improvements would earn a higher valuation, not to reject the investment solely because the present base case falls short.
The reproducible model contains all annual cash flows, separate scenario assumptions, the acquisition adjustment, dilution and audit results.
The model’s remaining warnings are disclosed: no numeric issuer revenue guidance, no clean selected exit-multiple peers, a normalized tax assumption for a loss-making issuer, and a large terminal-method spread. Only two full calls reside in the assembled model feed even though four quarterly calls were reviewed for this memo. The audit has no failing checks after documenting the guidance review, but a passing audit verifies the structure and provenance of the work; it does not validate the forecast.
My stance is bullish on LightPath as a developing infrared platform, with execution risk managed through staged exposure. The opportunity is the interaction of domestic sourcing, higher content per system and better manufacturing economics. The evidence is strong enough to investigate an early position; it is not yet strong enough to treat the production ramp as assured. The valuation scenarios describe how much growth and cash generation matter, and how costly disappointment could be. They are not a requirement to wait for an apparently cheap multiple. I would review after the next reported quarter, or sooner on a material production award, with a checkpoint of November 15, 2026. More shipped cameras, reliable margins, better cash conversion and growth per diluted share would justify greater conviction. Loss of customer qualification, impaired manufacturing economics or financing that overwhelms that per-share growth would justify reducing it.
Research seed: PhotonCap, with additional perspective from Shawarma Capital. Financial and technical claims above were checked against filings, company materials and the cited primary research. Forecasts and conclusions are our own.