
KLAC — Inspection, advanced packaging and the growth test
Update — November 1, 2026. KLA reported October 28: September-quarter revenue $4.136B versus $3.210B a year earlier (+28.8%), GAAP EPS $1.18, operating cash flow $1.531B and free cash flow $1.336B. December revenue guidance is $4.7B ±$0.2B, above the research’s $4.3B test. The shareholder letter reported growing backlog and wafer-inspection growth of 37% year on year. Advanced-packaging process-control revenue remains guided to about $1.1B in 2026, over 70% growth; this is guidance, not a completed full-year result. The letter now expects second-half revenue about 25% above the first and 2027 wafer-equipment spending above $200B. Prices and valuation scenarios below remain the October 6–7 snapshot, not live quotations.
Dates and units: KLA’s fiscal year (FY) ends June 30; CY means calendar year. Share and per-share comparisons use the ten-for-one split effective June 11, 2026. The old price references below are retained on that consistent split-adjusted basis.
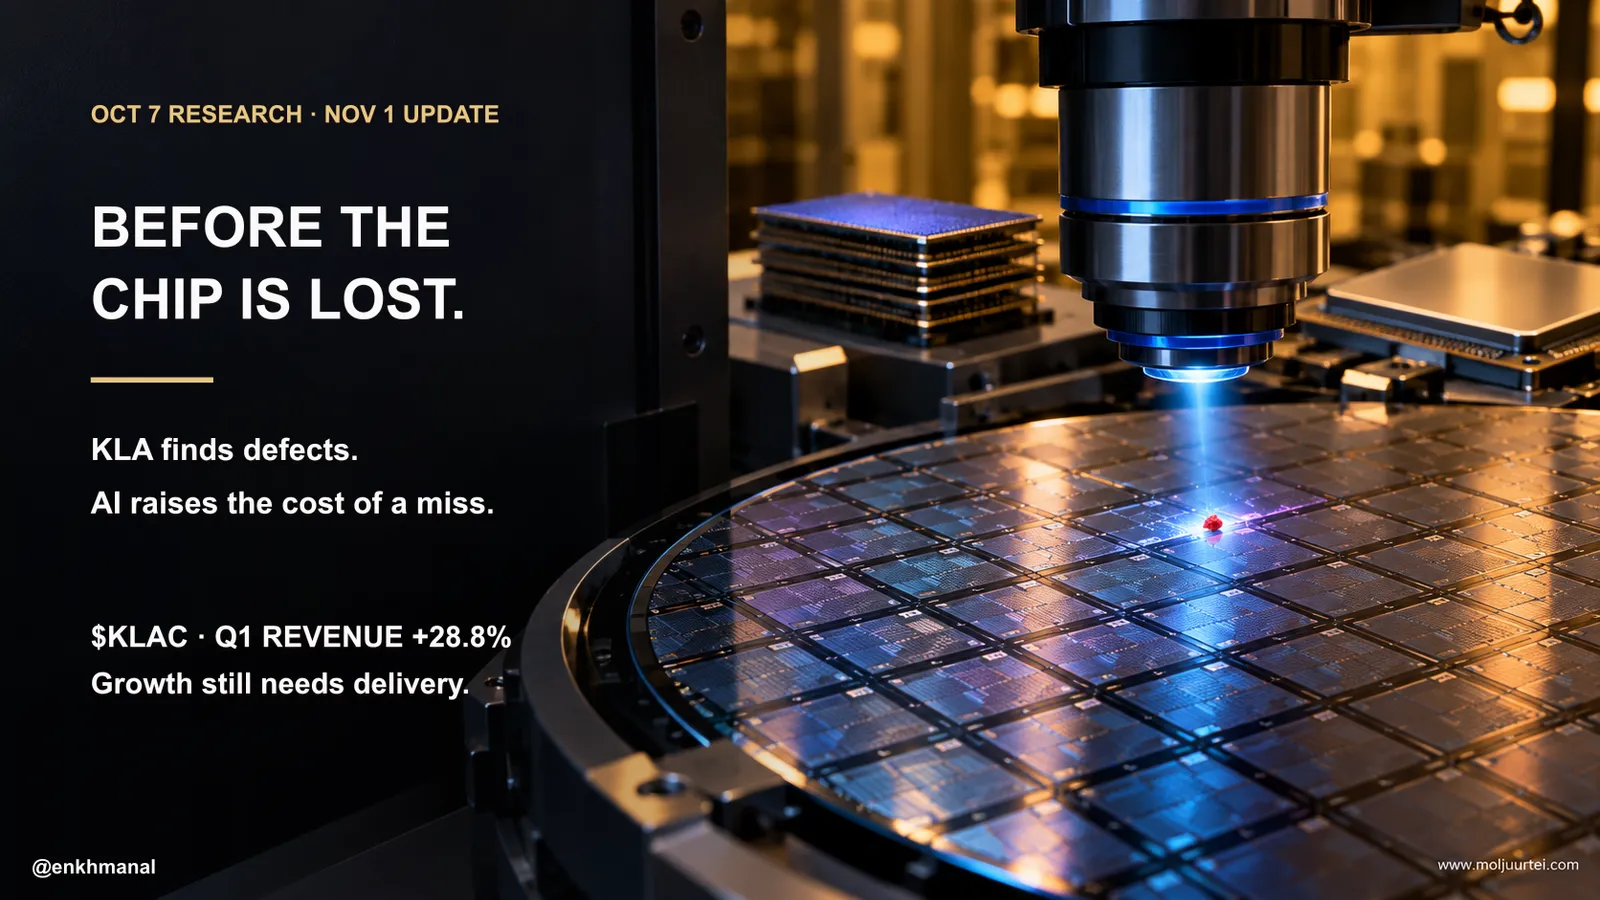
Larger AI processors and stacked memory make a missed manufacturing defect more costly. $KLAC sells inspection and measurement systems that help factories catch problems before more value is added. This October 7 research examines how higher process-control intensity and advanced packaging can accelerate growth. Its original prices, forecasts and scenarios are dated observations; the November 1 update below resolves the October 28 earnings catalyst.
AI Made Every Bad Die Expensive
Start here. A chip is a small piece of silicon containing many transistors and connections. A wafer is the circular silicon disc, commonly 300 millimetres across, on which hundreds of chips are built together, layer by layer through roughly a thousand manufacturing steps. A die is one individual chip, before or after it is separated from the wafer. Yield is the fraction that works correctly. Dust, an incorrectly printed line or misaligned layers can damage a chip. Inspection finds defects; metrology measures dimensions and alignment. Together they let a factory identify a problem between manufacturing steps before processing more wafers. KLA supplies these process-control systems.
AI changes both the size of chips and the way they are assembled, raising the value at risk from a missed defect.
The first change is size. Under a simple random-defect model, the probability of a die escaping defects falls approximately exponentially with its area. Larger dies put more value at risk when a defect hits; the loss does not follow a universal doubling rule. Ahmad Khan, who runs KLA’s semiconductor products, explained at the September 11 Goldman Sachs conference that one defect takes a larger share of a wafer when it contains only a few large dies than when it contains many small ones. AI accelerators are among the largest and most valuable dies.
The second change is stacking. HBM combines multiple DRAM dies with a base die and places the memory beside the processor in an advanced package. A 12-high HBM3E product has twelve DRAM layers, not eleven memory dies plus a base counted as twelve. SK hynix describes its 12-layer product. A bad die or bond can waste an otherwise valuable assembly. That raises the value of inspecting dies and bonds and brings more capable front-end inspection into packaging lines.
The industry is buying a lot more of everything at once. $KLAC raised its estimate for 2026 wafer equipment spending, packaging included, to the low $150 billion range on July 28, mid-20% growth over about $120 billion in 2025, and analysts on the same call were already working with 2027 numbers near $190 billion. More fabs means more of every tool. But process control is a category whose share of the bill can rise as chips get bigger, stack higher and move to 2-nanometre transistors, where $KLAC says inspection intensity is higher than at 3. The company that sells the most of that inspection is $KLAC.
Why Inspection Can Grow Faster Than Wafer Output
$KLAC owns roughly two-thirds of the market for finding and measuring defects on wafers, and AI is pushing up both the number of inspection steps per wafer and the value at risk at each one; packaging inspection alone is guided to about $1.1 billion this year, up more than 70%.
A Toolmaker With a Subscription Attached
$KLAC sells inspection and metrology systems, then services them for decades. In fiscal 2026, which ended in June, revenue was $13.58 billion. Wafer inspection was 49% of it and grew 7%; patterning, $KLAC's name for metrology and reticle inspection, was 20% and grew 23%; services were 23% and grew 16%; specialty semiconductor process tools were 4%; PCB and component inspection 3%. Of the $1,423 million of growth, patterning contributed 36%, services 31%, wafer inspection 30% and PCB 7%, while specialty process and refurbished systems shrank. The Semiconductor Process Control segment produced $12.24 billion of revenue and $5.48 billion of segment profit, a 44.8% margin, which makes $KLAC a single-segment company wearing a three-segment income statement.
Table terms: Wafer; inspection; Patterning; metrology; reticle; PCB.
Services are the cushion. They run on multi-year contracts tied to an installed base that customers keep running at full utilisation, and they grew through the 2024 downturn, when total revenue fell 6.5%.
Geography shifted substantially. China’s share fell from 42.8% in FY24 to 29.8% in FY26. FY26 China revenue was about $4.05 billion, essentially flat against FY25, as legacy-node investment offset restrictions on advanced transactions. Taiwan revenue grew 13.7% year on year; its revenue share was 26.8%, versus 26.4% in FY25 and 17.7% in FY24. Korea revenue grew 26.2% on memory investment and North America grew 29% as new capacity was equipped. TSMC alone was about 19% of revenue.
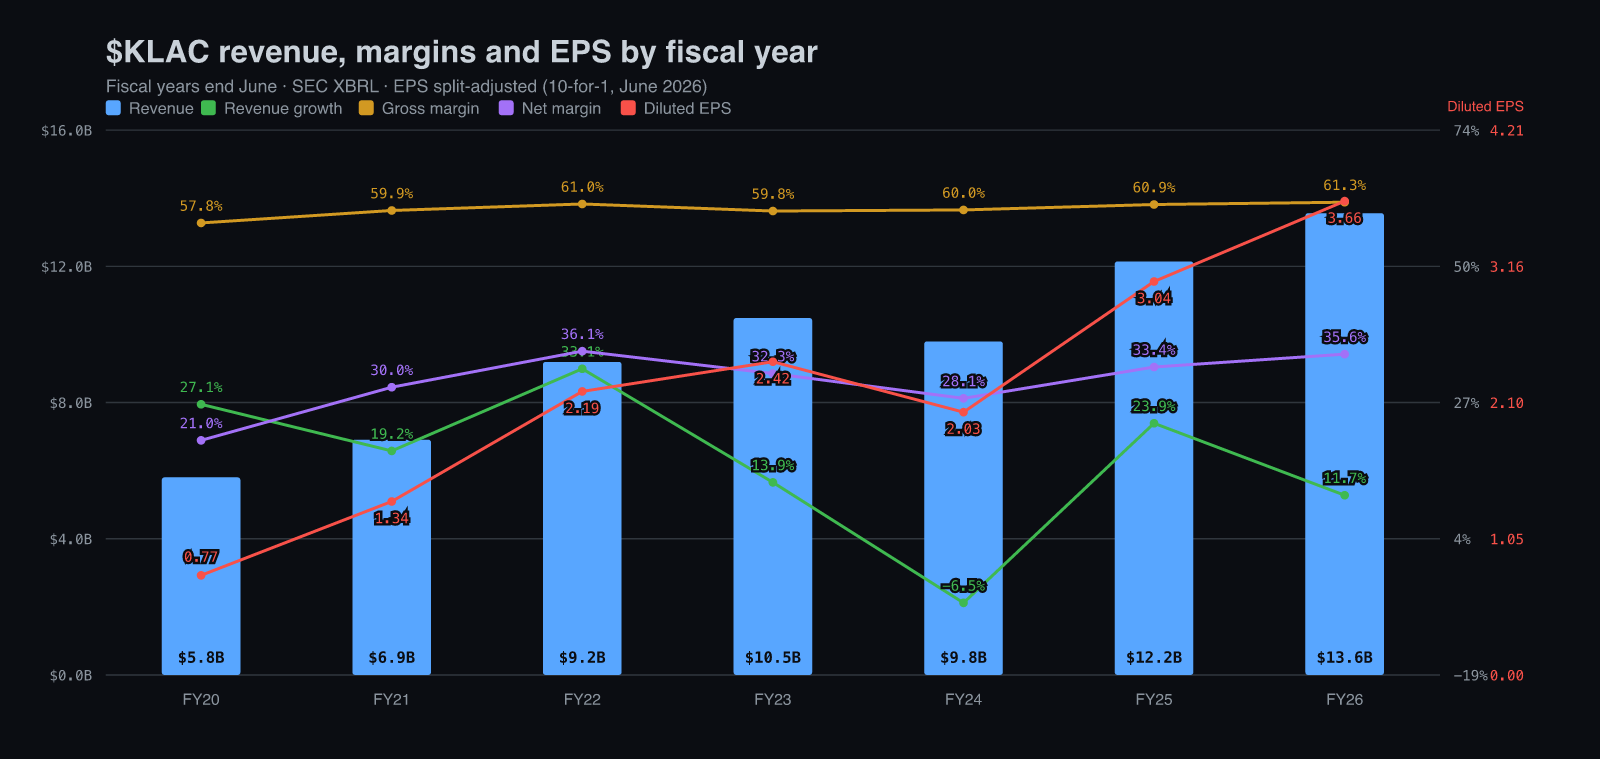
Revenue and margins over seven fiscal years: revenue grew from $5.81 billion in FY20 to $13.58 billion in FY26, with growth of 27.1%, 19.2%, 33.1%, 13.9%, −6.5%, 23.9% and 11.7%; gross margin ran 57.8% in FY20, 59.9% in FY21, 61.0% in FY22, 59.8% in FY23, 60.0% in FY24, 60.9% in FY25 and 61.3% in FY26; net margin went from 21.0% to 36.1%, dipped to 28.1% in the FY24 downturn and recovered to 35.6%. The striking thing is not the growth but how little the gross margin moves through a cycle: FY24 revenue fell 6.5%, while gross margin edged up from 59.8% to 60.0%, a 0.2 percentage-point increase.
By quarter, revenue was $2.84 billion in Q1 FY25, $3.08 billion, $3.06 billion, $3.18 billion, then $3.21 billion in Q1 FY26, $3.30 billion, $3.42 billion and $3.66 billion in Q4 FY26, with the September quarter guided at $4.0 billion. Year-on-year growth slowed from 29.8% in Q3 FY25 to 7.2% in Q2 FY26 and has re-accelerated to 11.5%, 15.2% and a guided 24.6%. GAAP gross margin sat between 61.1% and 62.0% for six straight quarters, at 61.4% in Q4 FY26, and is guided at 61.6%. Net margin was 37.3% in the June quarter.
Peers confirm the demand from both sides of the invoice. Nova, the metrology specialist, reported record second-quarter revenue of $255 million, up 16%, with advanced packaging nearly a quarter of product revenue. $ASML raised its 2026 sales guide from €36–40 billion to €43–45 billion on July 15 after a €9.3 billion quarter, and said its 2027 low-NA EUV capacity is close to fully booked. More lithography means more layers to measure.
Light, Electrons and 1,700 People in Customers' Fabs
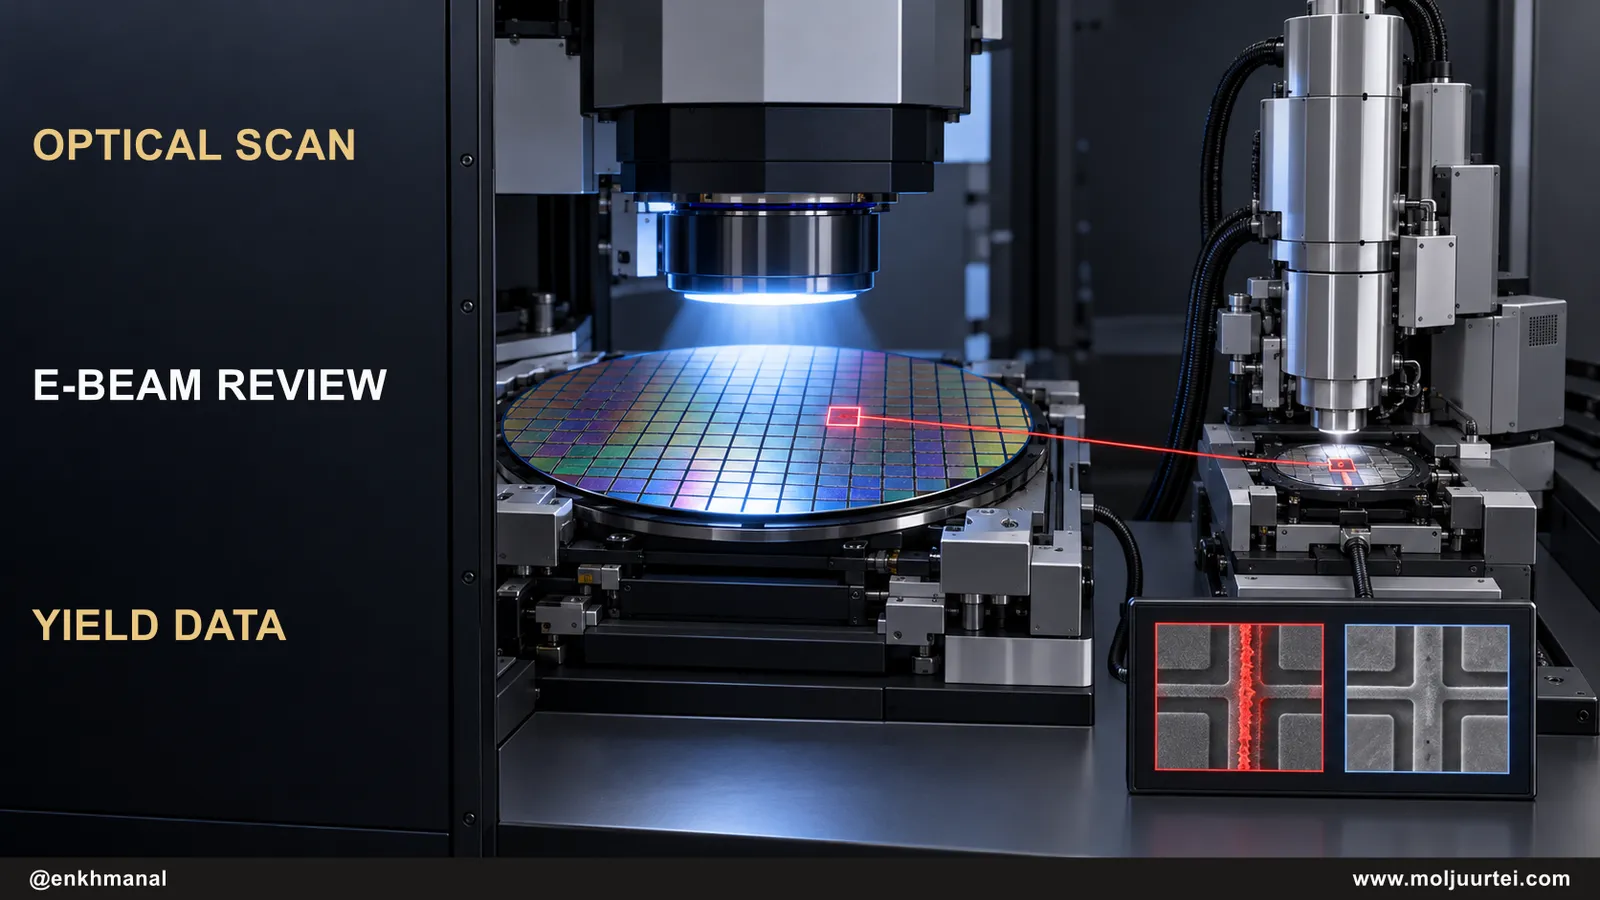
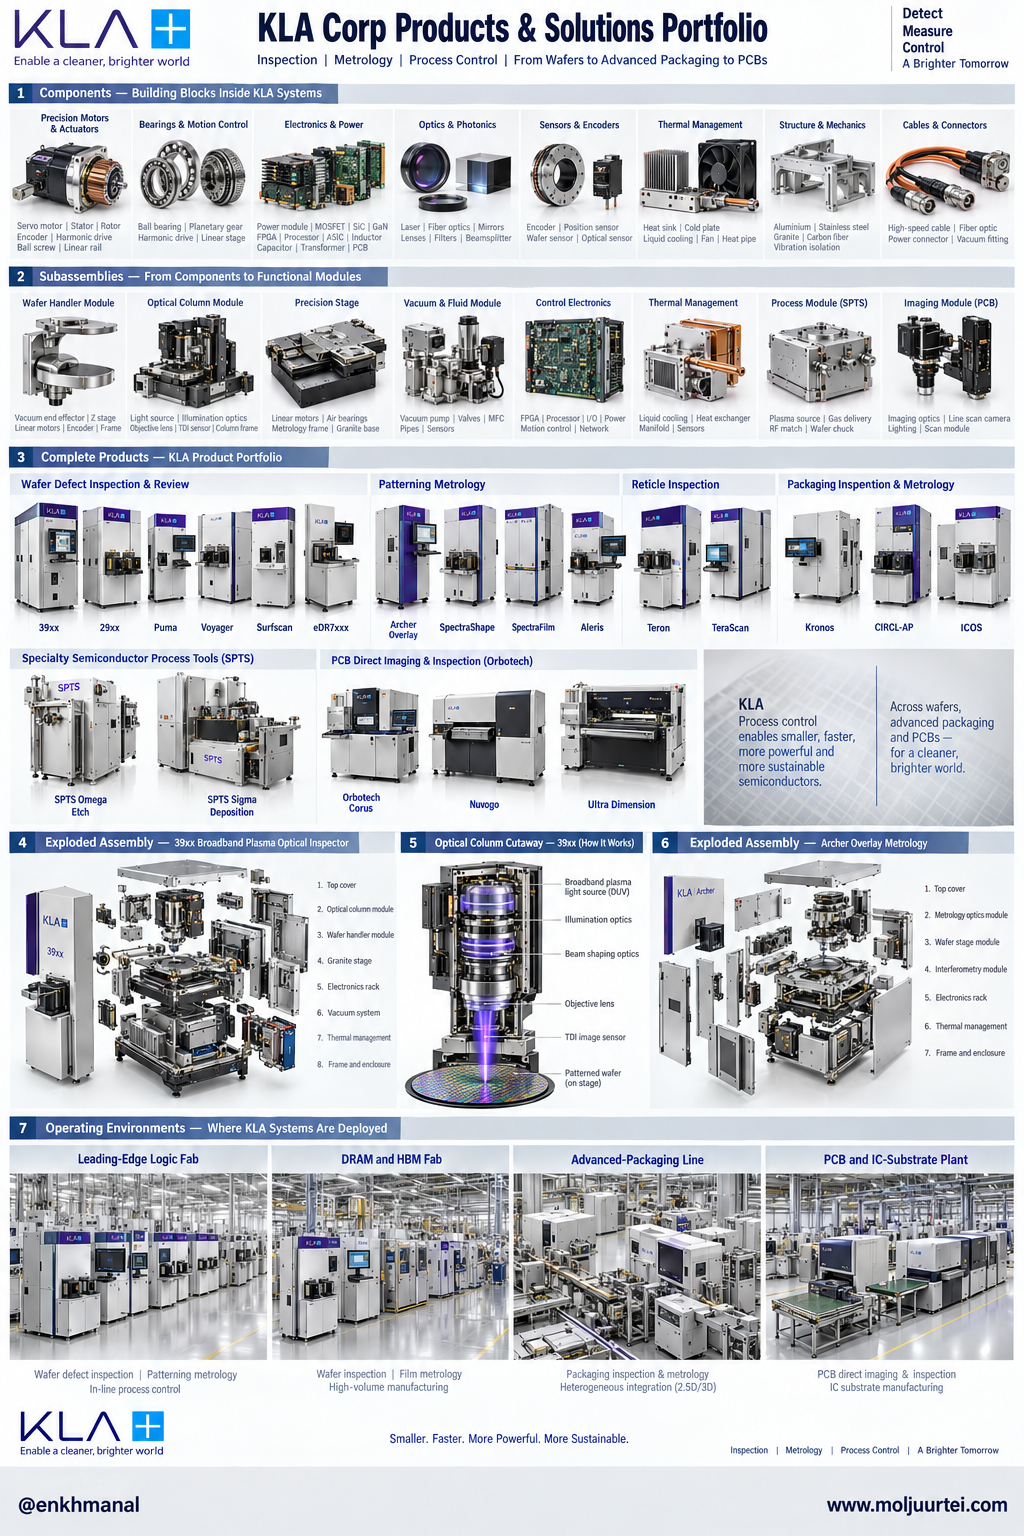
$KLAC's main tool is a broadband plasma optical inspector, the 39xx series it calls Gen5: a plasma lamp produces light across a wide band of wavelengths, optics focus it onto a patterned wafer, and sensors compare what scatters back from each die against its neighbours or the design. Anything that differs is flagged, then sent to an e-beam review tool (the eDR line) that photographs the suspect spot with electrons at far higher magnification to classify it. Metrology tools such as Archer overlay and SpectraShape measure line widths, film thicknesses and layer-to-layer alignment. Kronos and CIRCL-AP carry the same physics into packaging, and Klarity software turns the data into decisions about which step went wrong.
The moat is partly physics and mostly mix. "Process control is tricky to get into because it's a very high-mix, low-volume market," CEO Rick Wallace said on July 28; unlike lithography, every customer layer needs its own recipe and algorithm, and $KLAC places about 1,600 to 1,700 applications engineers inside customer fabs to write them. Optical inspection does about 80% of the production work and e-beam the rest, a split $KLAC expects to persist because electrons are precise but slow.
The scarce input is glass. "Calcium fluoride lead times can be 18-24 months or more," CFO Bren Higgins said at Citi on September 9, and $KLAC is already discussing optics capacity for 2029 and 2030 with its suppliers. That constraint slowed shipments in the first half of 2026 ("I could ship more if I had more parts even today," Higgins said two days later), and it is also a barrier: a would-be competitor has to win the same optics allocation. One outside estimate, from The Information Network, puts $KLAC's share of inspection and metrology at 64.1% in 2025, up from 55.0% in 2020.
Packaging, Hybrid Bonding and a 2030 Model That May Arrive Early
The fastest-growing line is the one $KLAC barely sold five years ago. Its process-control revenue from advanced packaging was about $635 million in 2025; in April management guided about $1 billion for 2026, and on July 28 raised it to about $1.1 billion, "up more than 70% year-over-year, above our prior expectations of high 50% growth, and almost two times faster than the advanced packaging market." Higgins described how it started: a customer pulled the CEO into a meeting to ask for front-end tools in packaging, $KLAC warned them about the price, and the customer said they were moving to front-end processing and needed front-end capability. Packaging carries a lower gross margin than wafer tools, which is part of why margin has been flat while revenue grew.
R&D was $1.53 billion in fiscal 2026, 11.3% of revenue, spent on 2-nanometre and gate-all-around inspection, e-beam throughput, hybrid-bonding void detection and AI inside the tools, which $KLAC first shipped in a product in 2019.
The company’s March Investor Day model targets 2030 revenue of $26 billion ±$2.5 billion, 63.5% gross margin, 45–47% operating margin and $8.40 non-GAAP EPS, assuming wafer-equipment spending of $215 billion ±$20 billion. Reaching that market size sooner could help KLA reach the model sooner, but market share, customer mix, supply capacity and margins must also hold. The model does not automatically move forward with industry spending.
Why It's Mispriced
The October 7 mispricing hypothesis was that investors overreacted to quarterly product mix and underweighted the coming ramp. From the end of September 2025 to October 6, $KLAC rose 83%; $AMAT rose 159%, $LRCX 149% and $ONTO 143%. $KLAC ran to $301.71 on June 30 in the equipment melt-up after its ten-for-one split, then fell 10.8% the day after its July 28 report and touched $165.89 on September 16.
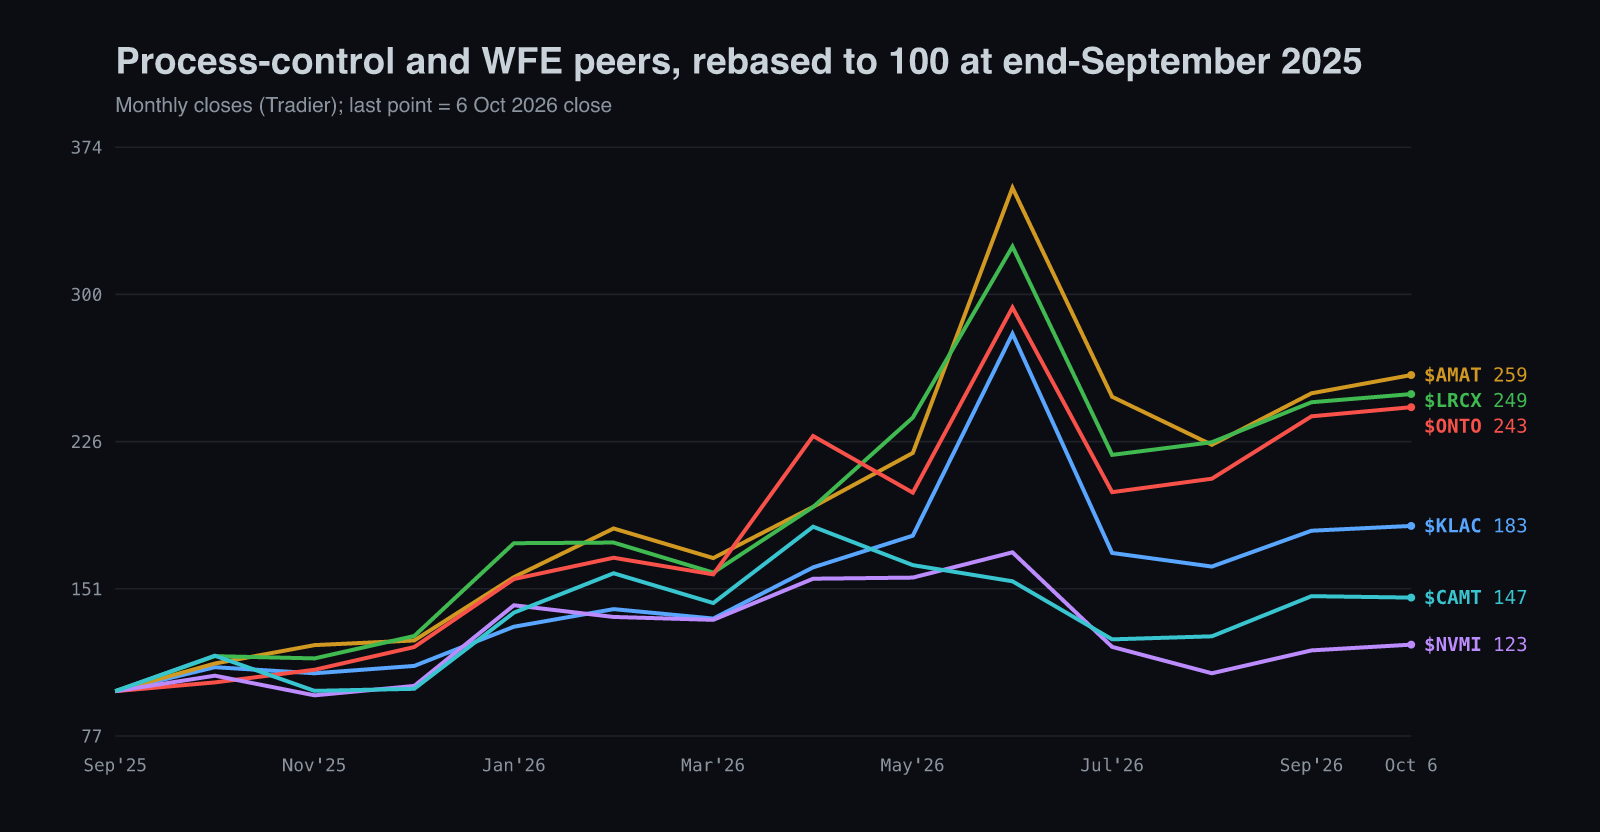
What spooked holders in July is visible in the product breakdown: patterning grew 61% year on year and PCB 96%, but wafer inspection, half of revenue, grew 1%. Gross margin was guided flat on 10% more revenue because DRAM chips inside $KLAC's own tools have risen in price faster than $KLAC can reprice orders already booked. And memory, where process control intensity is lower, will be a bigger share in the December quarter.
We read the same quarter as supply, not demand. Wafer inspection is the line most dependent on long-lead optics, which is exactly where $KLAC says it was short. Backlog was about $12.5 billion at the end of June, "grown pretty consistently over the last couple of quarters," most of it shipping in 12 to 18 months. Management guided the September quarter to $4.0 billion, 9% above June, and the December quarter, by the analysts' arithmetic on the call that management did not dispute, rises about another 10%.
The original October 28 test had three parts: a December-quarter guide above roughly $4.3 billion, backlog still growing, and wafer inspection returning to growth. The October 28 release gave a $4.7 billion ±$0.2 billion guide. The shareholder letter said backlog continued to grow and wafer inspection rose 37% year on year and 19% sequentially. All three directional tests were met. This supports the ramp thesis; it does not prove that supply was the only constraint or eliminate future demand risk.
Cash tells a more careful story than profit. Fiscal 2026 operating cash flow was $4.14 billion against net income of $4.83 billion, 86% conversion, and free cash flow was $3.77 billion, a 27.7% margin. In the June quarter alone, operating cash flow fell to $906 million from $1.17 billion a year earlier while net income rose to $1.36 billion. Receivables stretched from 68 to 78 days and inventory sits near 250 days of cost, the price of stocking optics for a ramp it can see in backlog. $KLAC still returned $3.35 billion, 89% of free cash flow, in buybacks and dividends.
If I had a nickel for every time one of our competitors talked about gaining share in the industry, I'd have a lot of nickels.
Two Decades of the Same Operators
Table terms: CFO; controller; treasury; IR; metrology; patterning; process control; Packaging.
These are operators, not hires. Wallace has run the company for twenty years and Higgins has signed its numbers for thirteen. The one blemish is the 2019 Orbotech purchase: the PCB and component segment lost $470 million in fiscal 2024 after impairments, before turning a $108 million profit in fiscal 2026 as packaging and substrate demand rescued it.
Risks & What Breaks It
The original warning threshold was a December-quarter guide below about $4.3 billion or a backlog that stopped growing. The reported $4.5–4.9 billion range cleared that threshold, and management described growing backlog without replacing the old $12.5 billion figure with an exact updated amount in the reviewed letter. A guide remains a forecast, not realized revenue.
Levels, Technicals & Options
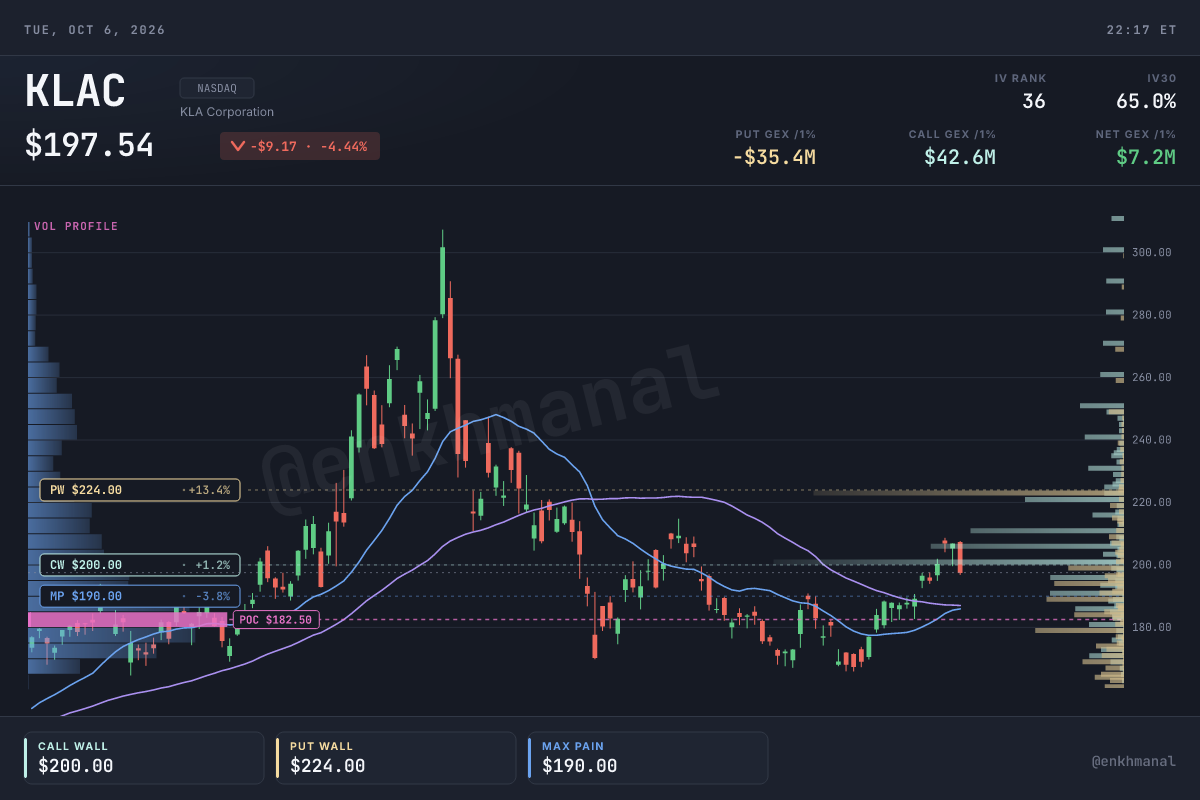
$KLAC closed at $197.46 on October 6, down 4.5% on a day Morgan Stanley cut its target to $227 from $253 and memory and equipment names sold together. It sits above its 20-day ($185.9) and 50-day ($187.0) averages, which have just curled up through each other, and above an approximate 200-day near $182 (our estimate from weekly closes). The September 16 low at $165.89 is the line the market drew under the July print; it was a dated price-risk reference, not proof of a fundamental thesis failure. The volume shelf at $182.50 was a possible support reference, and the gap from $206.85 to $207.66 is overhead.
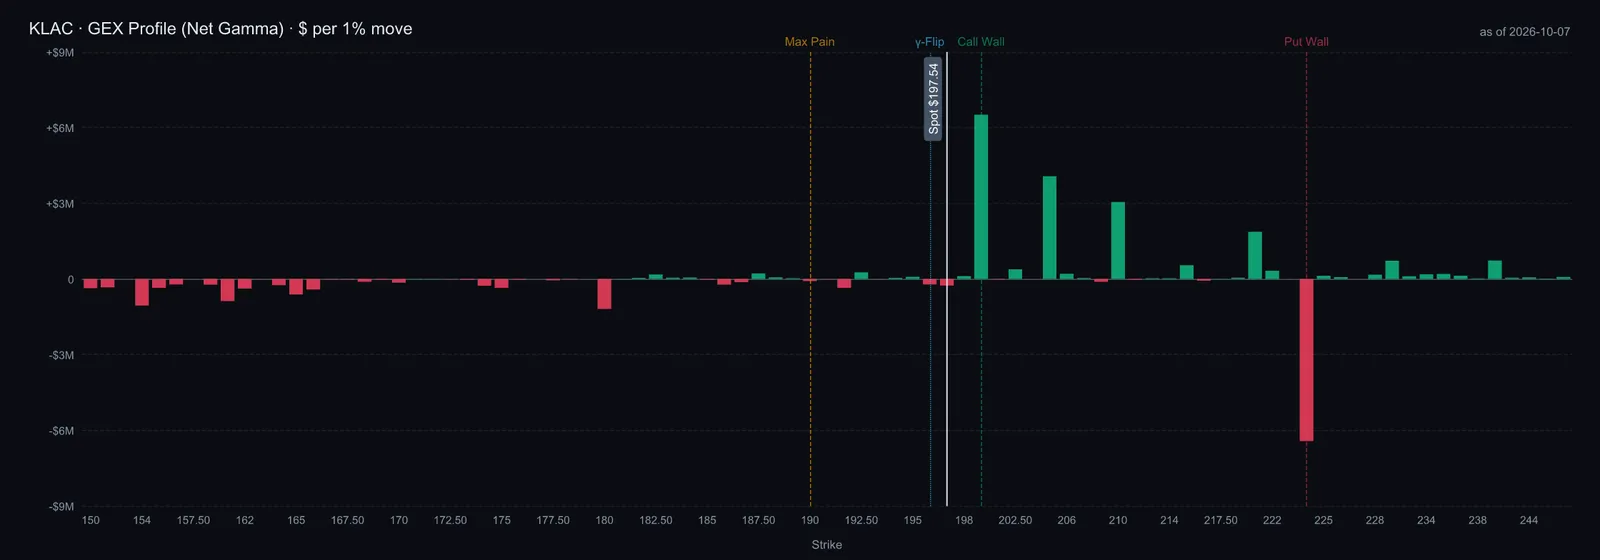
In the October 6–7 snapshot, estimated net dealer gamma was about +$7.2 million per 1% move, gamma flip $196, call wall $200, max pain $190 and the largest negative-gamma strike $224. These model-based concentrations are not price floors or forecasts. Implied volatility was 65% for October 30 versus 54% for October 23; both expiries have now passed. The original roughly ±10% earnings-move estimate was a term-structure calculation, not an observed outcome. The prior July report was followed by a −10.8% move.
Valuation & House View
At $197.46 $KLAC trades at 54 times fiscal 2026 GAAP EPS of $3.66, against a five-year median near 28 times; $AMAT trades at 46 times and $LRCX at 58 times trailing. On management's own 2030 EPS target of $8.40, the price is 23.5 times. Twenty-six analysts' targets run from $175 to $325, with a $234 mean.
The dated valuation sensitivity assumes 30% revenue growth in FY27, 20% in FY28, fading to 5% by FY36, a 10% discount rate and 14.5% tax. It reaches about $25 billion revenue in FY30. A perpetuity gives $105.79 per share; a 43.5× EBITDA exit gives $327.59, and a 35.1× exit about $264. The methods differ by 3.1×. Working-capital assumptions include a 288-day cash cycle and roughly $0.44 of incremental working capital per new revenue dollar; those are model inputs, not a universal relationship. A reverse DCF implies about 24% annual growth over ten years under the assumed economics. The spread shows sensitivity to terminal and cash-conversion assumptions; it is not an established fair-value range.
Table terms: EPS.
Illustrative 25/50/25 scenario weights give $215.90, 9.3% above the dated $197.46 reference. EPS figures and scenario weights are analyst assumptions, not company guidance or measured probabilities. The two-year base illustration is $224. The October results strengthen the growth-acceleration case through backlog and inspection demand, while supply delivery, memory mix, China exposure, cash conversion and valuation remain the tests that determine the return.
Background reading included PhotonCap and P Equity Research. Company filings, releases, presentations and management discussions underpin the dated research; market snapshots and analyst assumptions are identified separately.