
Gold miners — Costs, cash flow and the October earnings test
A gold mine sells metal at a market price it cannot control. Extracting more value from the same ore can turn a rise in gold into a much larger increase in cash generation, but falling prices reverse that leverage. This October 6 research examines $GDX and its major producers and streamers. Prices, fund weights, options and scenarios below are historical October 2–5 observations, not current signals. The November 2 update resolves the October earnings tests.
November 2 update — The earnings tests are complete
Newmont reported on October 22: Q3 by-product AISC was $1,454/oz, below the original $1,680 full-year comparison, and full-year guidance improved to $1,520. Realized gold was $4,317/oz; the price-minus-AISC spread was $2,863/oz, not net profit. Free cash flow was $1.9B, down from Q2’s $2.2B. Cost resilience passed the original test, while cash generation did not accelerate sequentially. By-product credits affect cost comparability.
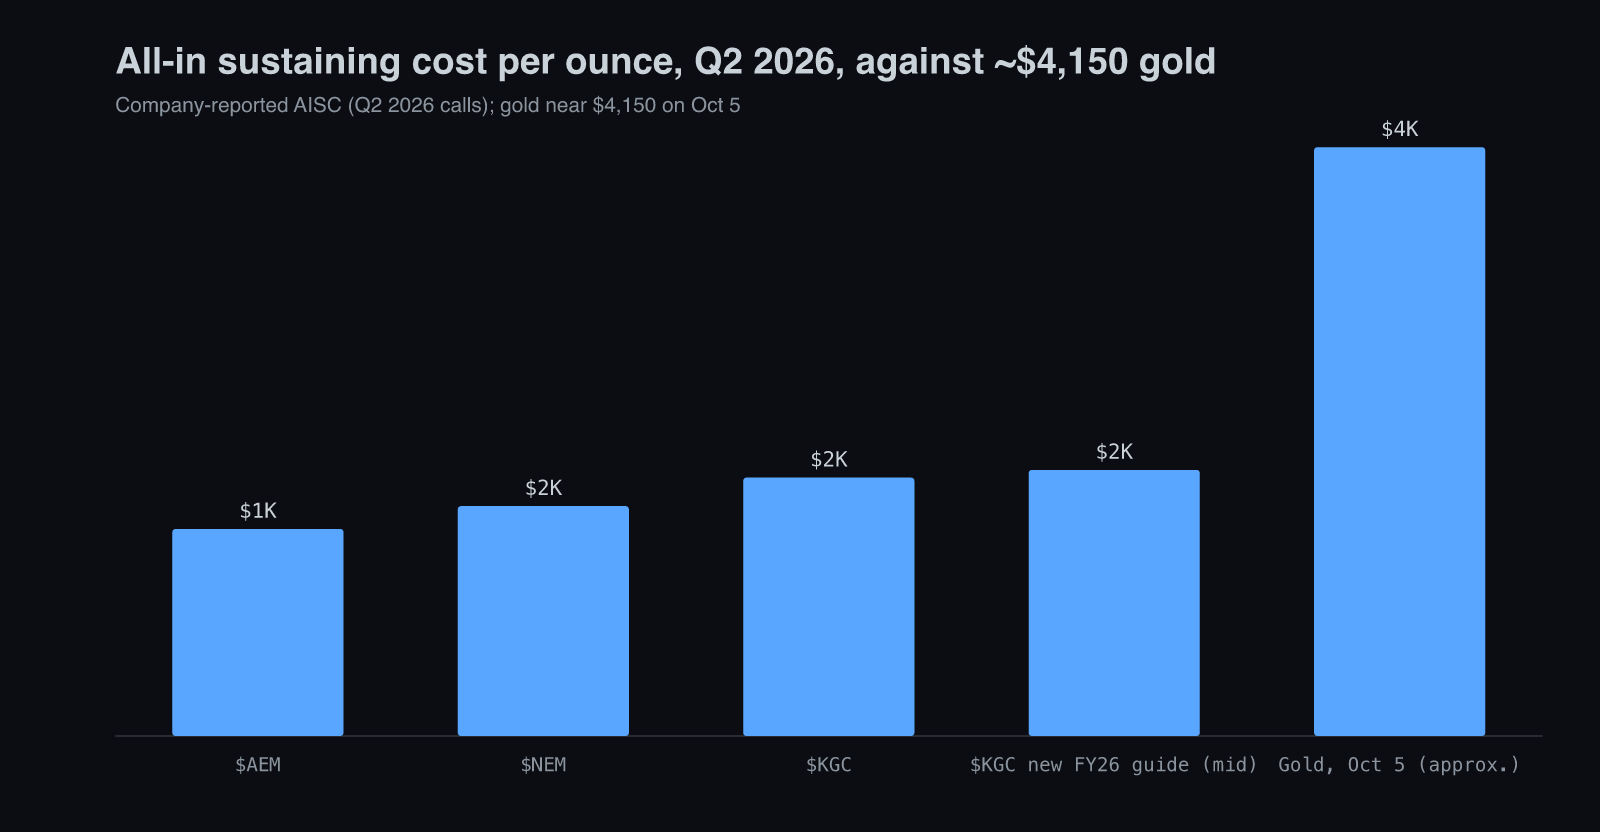
Agnico Eagle released results October 28, with its call October 29. It produced 814,012 ounces at $1,648/oz AISC and realized gold of $4,264/oz; free cash flow was $852M. AISC rose 13.0% from Q2’s $1,459 and exceeded the $1,550 upper end of annual guidance for the quarter, although management retained the annual range and expected its upper end. Strong cash remained, but the original low-cost story faced pressure. The spread was $2,616/oz before costs excluded from AISC.
The October catalysts are historical, not upcoming. These outcomes support the cash-generation mechanism while showing that costs and cash conversion can diverge across companies. Original stock prices, fund weights, option levels and valuation scenarios remain dated illustrations; they are not current share-price targets.
Thesis
The dated thesis: high gold prices can turn slowly moving production costs into strong cash generation and share repurchases. $GDX provides diversified exposure to that operating leverage. The October research favored Newmont for cash returns and Agnico Eagle for operating quality, while asking whether lower gold prices and rising costs would erode the cash surplus. The completed-quarter evidence is mixed, as the update explains.
Backdrop — How the Gold Bid Got Here
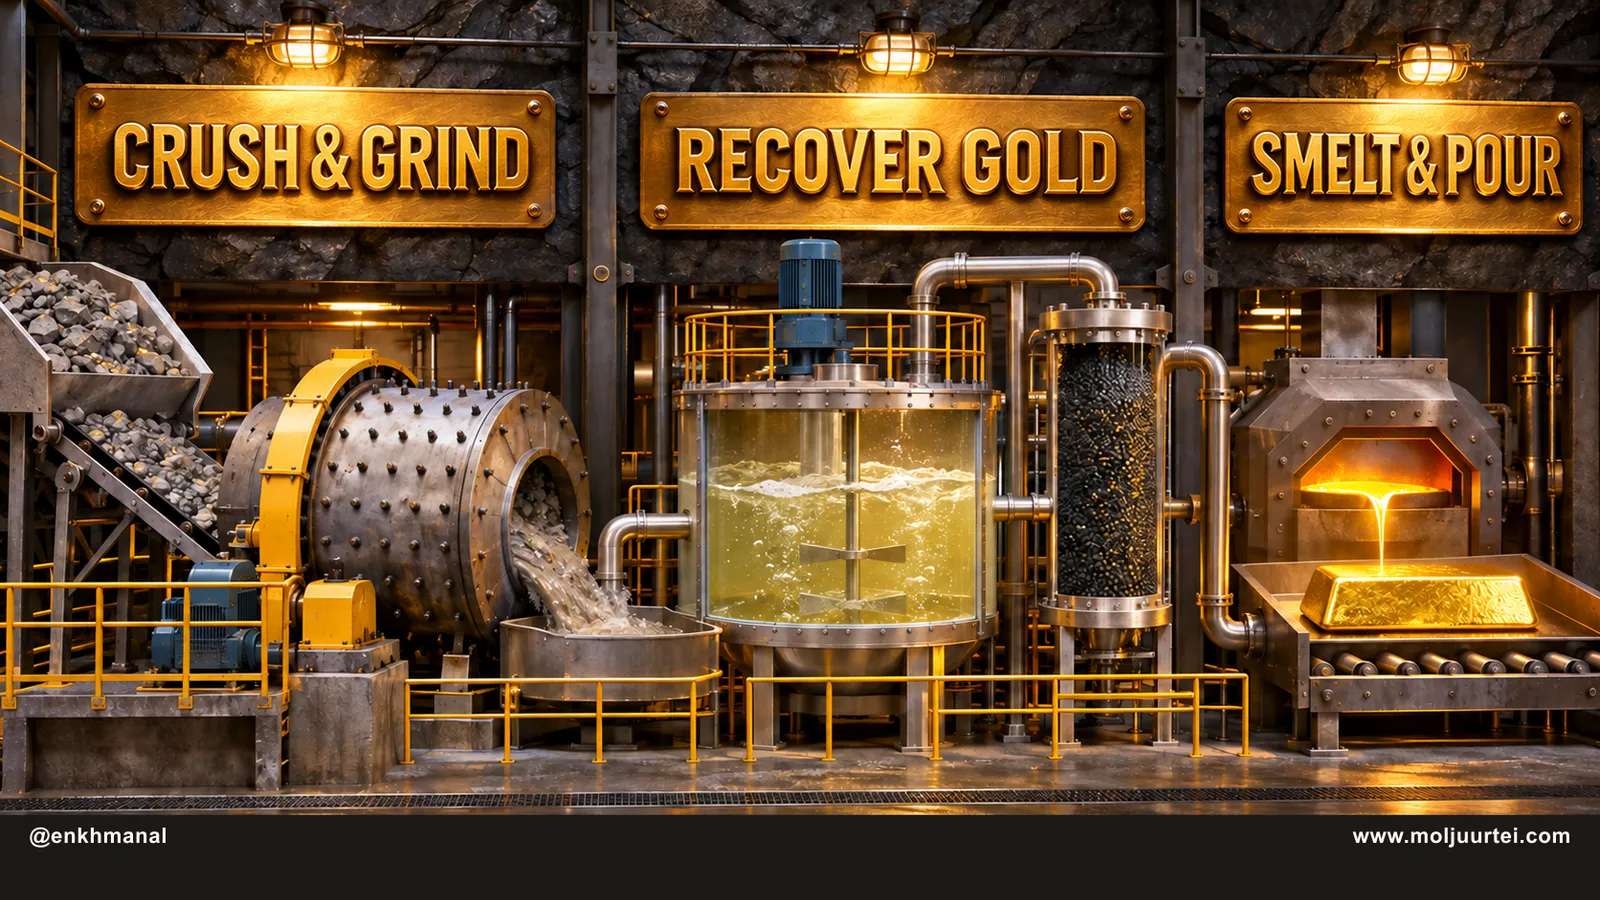
Start here. Ore is rock containing small amounts of gold. A mine extracts the rock, crushes and grinds it, then separates and refines the metal. Some operations use a dilute cyanide solution to dissolve gold and activated carbon to recover it; geology determines the processing method and ore grade. One troy ounce is about 31.1 grams. All-in sustaining cost (AISC) combines operating costs with spending needed to sustain existing production and other specified costs. It is a company-defined non-GAAP measure, not every expense a shareholder bears. Gold price minus AISC is a useful per-ounce spread, not net profit or free cash flow: taxes, interest, growth investment, working capital and measurement differences still matter. $GDX owns mining and royalty/streaming businesses rather than physical gold.
The buyer base broadened. Central-bank reserves and investment funds matter alongside jewelry demand. The World Gold Council’s Q1 2026 report estimated central-bank net purchases of 244 tonnes, up 3% year on year, while noting that some institutions were also selling. Reserve diversification supports demand but does not create a permanent price floor. In the research price series, $GLD rose from $253.51 in October 2024 to a $509.70 high in January 2026.
Bonds compete with a metal that pays no interest. The historical October 5 close for $GLD was $379.55, about 25.5% below its $509.70 January high and below its 20-, 50- and 200-day averages. The US Treasury daily curve records a 5.31% nominal ten-year yield on October 5. Nominal yield is not real yield: the latter accounts for inflation. Higher inflation-adjusted returns on safe bonds can raise the opportunity cost of holding gold, but nominal yields alone do not establish that mechanism.
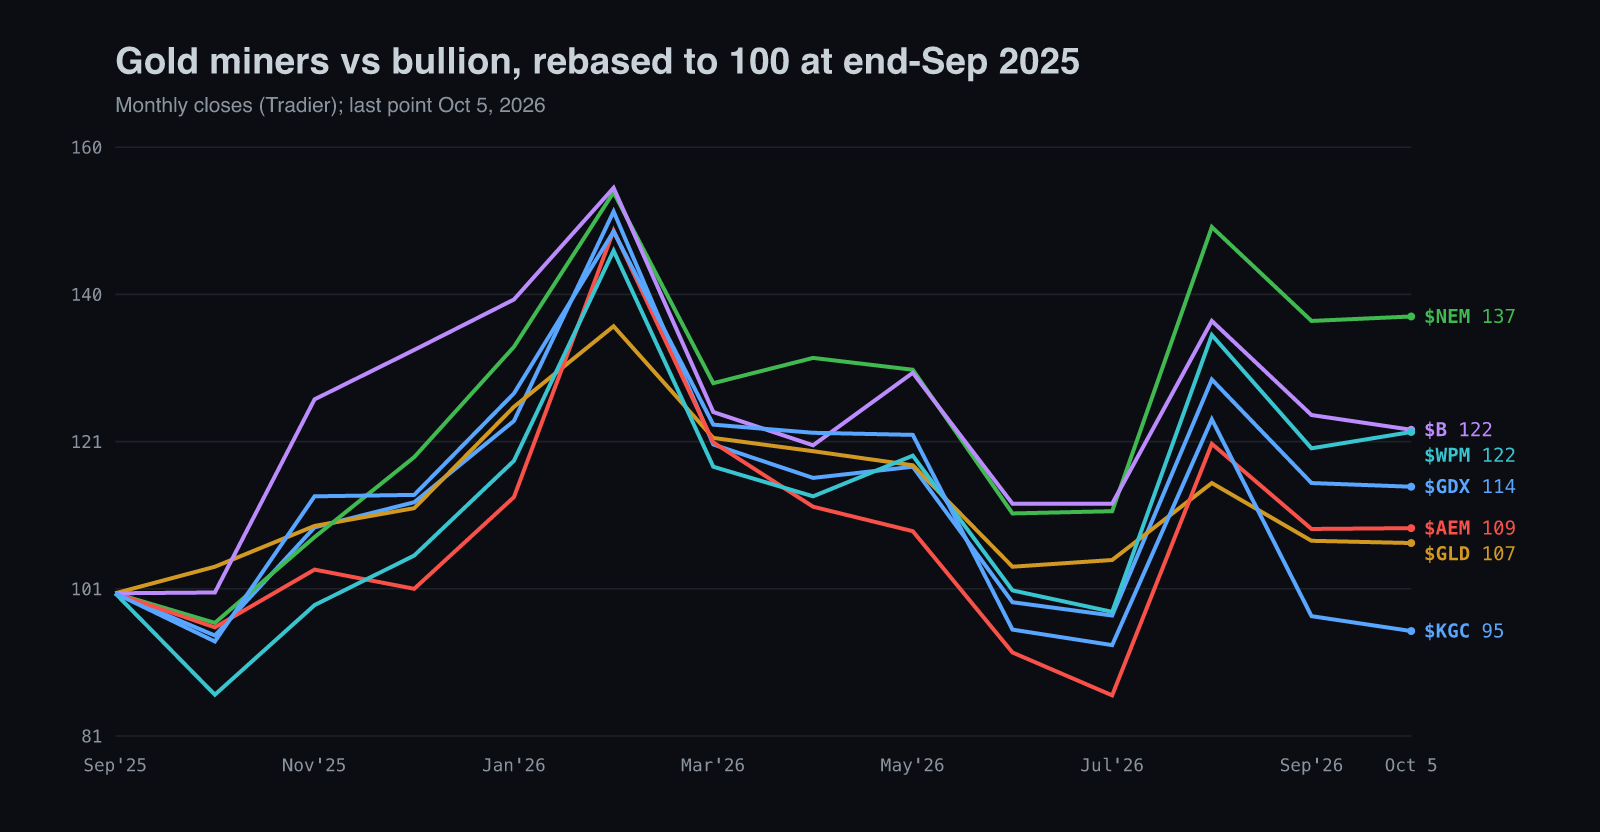
The miners amplified both legs. Rebased to the end of September 2025, $GDX reached 152 at the February peak against 136 for bullion, then fell back to 114 while $GLD sits at 107. $KGC is the exception that proves the point: it is now below where it started the year-long window, because its own operations broke during the gold decline rather than after it.
Mechanism — Why the Margin Moves Faster Than the Metal
Many costs follow tonnes moved rather than the gold price. A mill must grind ore even when gold falls. That gives miners operating leverage, although wages, energy, grades, recoveries and price-linked royalties also change. Newmont’s Q2 2026 call reported approximately $1,100 more realized gold revenue per ounce year on year, around 33%, against a 4% increase in absolute costs applicable to sales. The comparison concerns total reported costs, not a promise that cost per ounce stays fixed.
Year-over-year, our realized gold price increased by approximately $1,100 per ounce, or about 33%, while absolute cost applicable to sales increased just 4%.
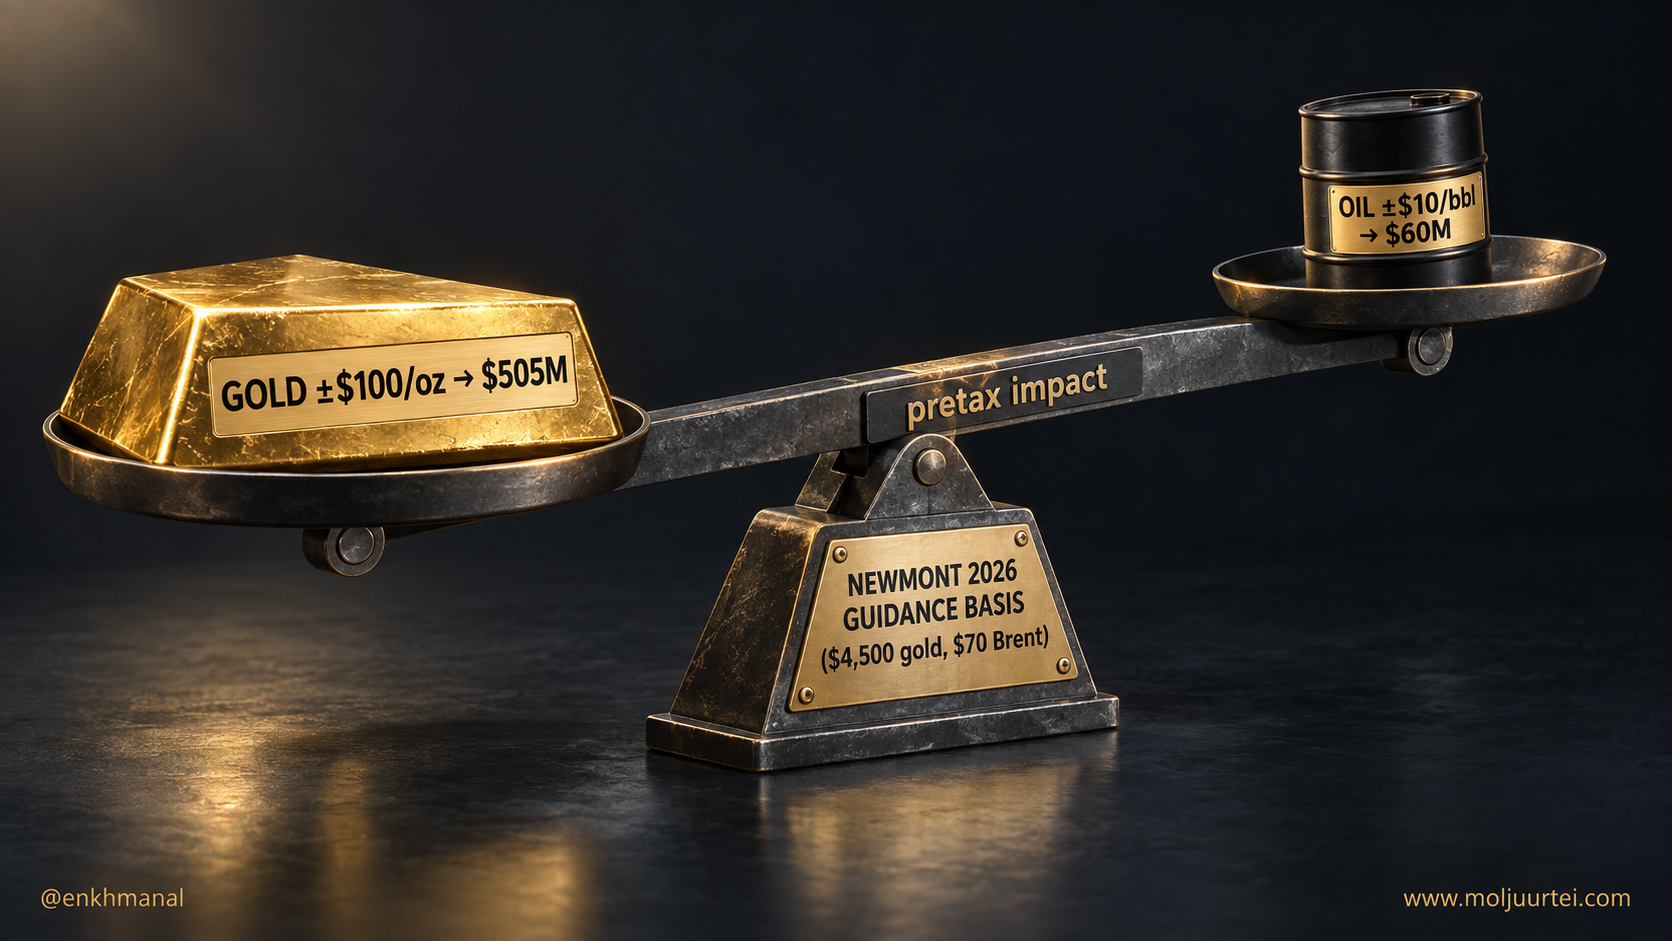
Compare sensitivities on their stated increments. Newmont’s 2026 table estimates a $505 million annual pretax revenue-and-cost impact per $100/oz gold change, versus $60 million per $10/bbl oil change, with $4,500 gold and $70 Brent as planning assumptions. The dollar impacts differ by 8.4 times for those particular increments; that is not an equal-percentage sensitivity comparison. A sustained $4,150 gold price would be $350 below the gold assumption, implying roughly $1.77 billion less annual pretax contribution under the table’s linear approximation. It is neither a forecast of a quarterly shortfall nor a direct free-cash-flow estimate.
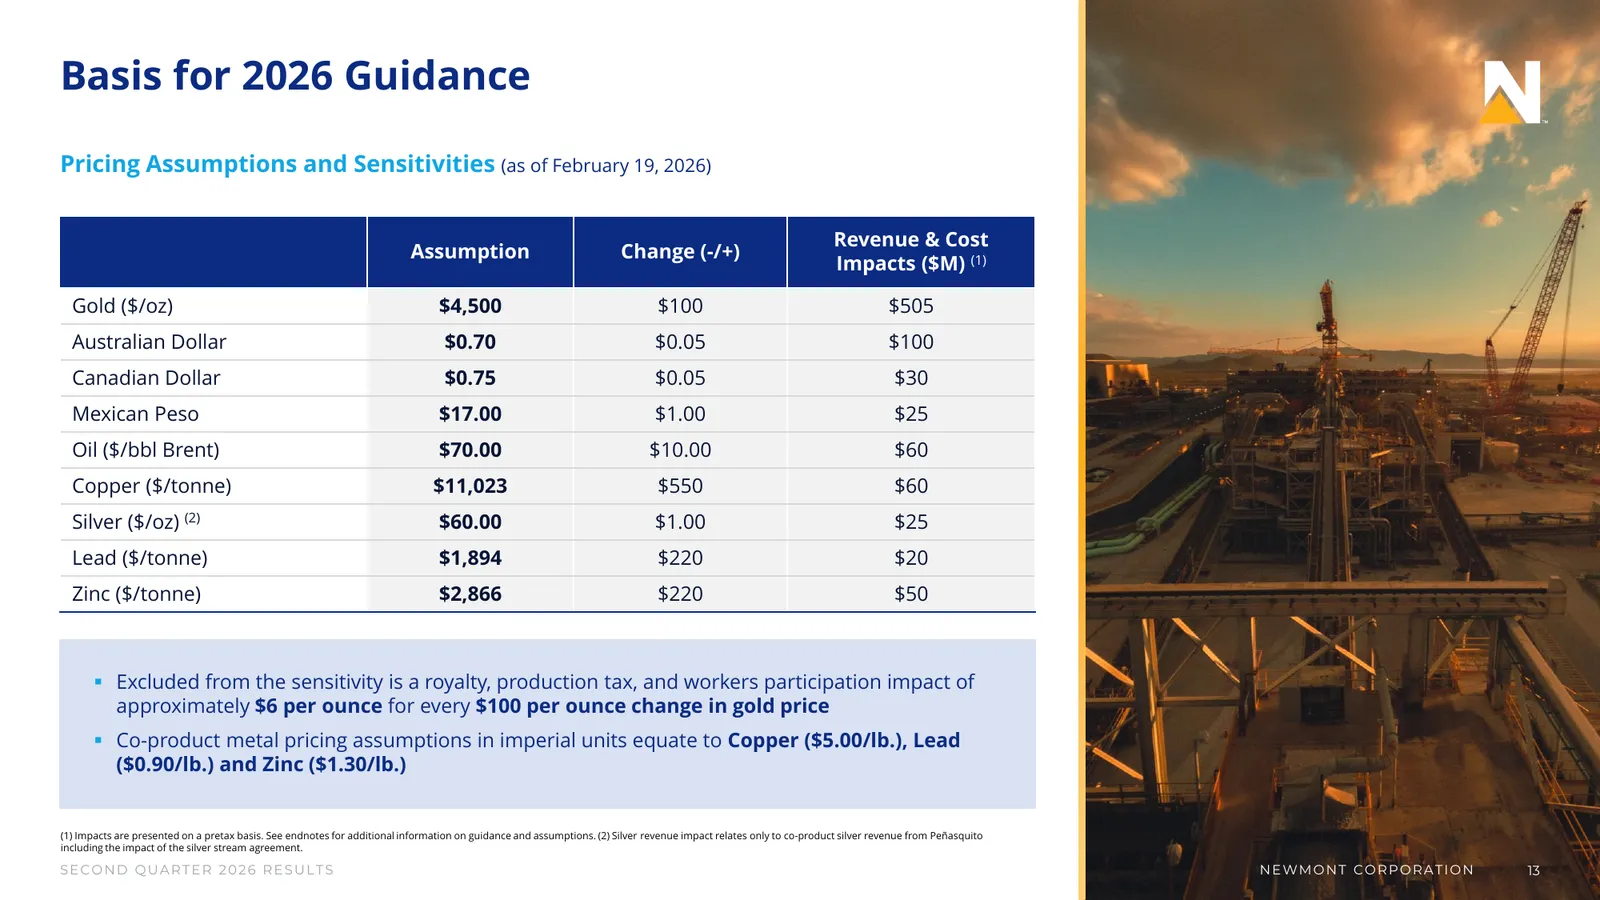
Energy is the cost that bites, but it is a sixth of the bill. Labor is half of Newmont's direct operating costs, materials and consumables 30%, and fuel and energy 15%, of which diesel is 6% and electricity 5% (Q2 2026 deck, slide 12). Oil traded above $100 for much of the quarter, which Agnico Eagle called out on its call, yet both companies stayed inside cost guidance. Kinross quantifies it at about $10 an ounce of all-in cost per $10 a barrel, plus up to $4 of second-order effects (Kinross Q2 2026), real, but smaller in this stated comparison than a $350 move in the metal.
The record shows leverage in both directions. Newmont revenue ran $11.50 billion in FY20, $12.22 billion in FY21, $11.92 billion in FY22 and $11.81 billion in FY23, then rose to $18.68 billion in FY24 after Newcrest was consolidated and $22.67 billion in FY25. Reported growth was +18.0%, +6.3%, −2.5%, −0.9%, +58.2% and +21.4%; net margins were 24.6%, 9.5%, −3.6%, −21.1%, 17.9% and 31.3%. Gold prices, cost inflation, acquisitions and impairments all affected the series. The FY24 jump cannot be called organic gold-price growth.
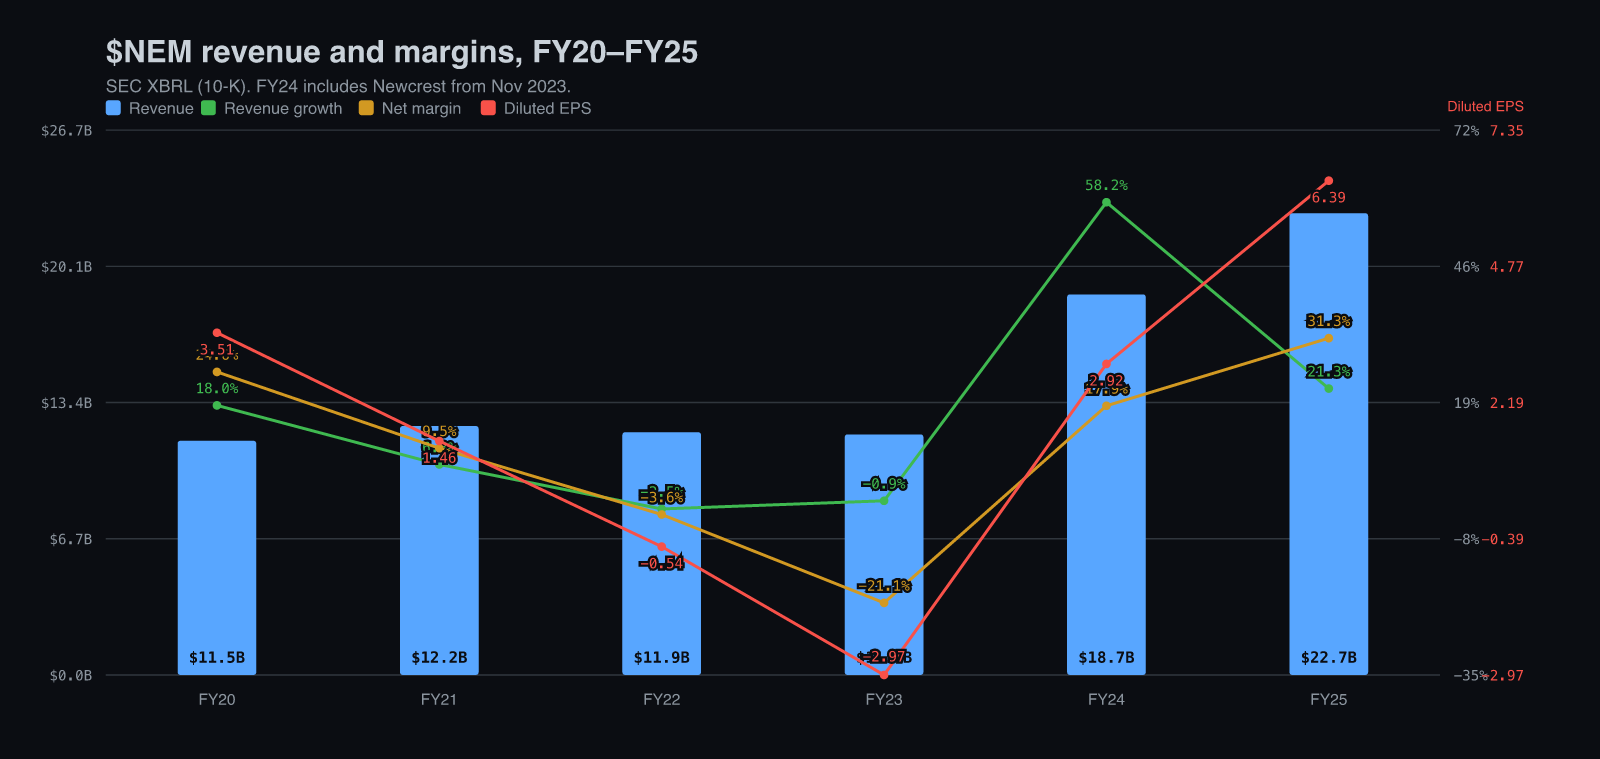
Table terms: YoY.
The quarterly series shows the turn the annual one hides. $NEM revenue peaked at $7.31 billion in Q1 2026 with a 44.6% net margin, then fell 16.3% sequentially to $6.12 billion in Q2 with net margin at 36.0% as fewer gold and silver ounces were sold and by-product credits shrank; Q4 2025 dipped to a 19.1% net margin between two stronger quarters. Q2 revenue was still +15.1% year on year, the slowest growth of the last six quarters, which is consistent with weaker prices and volumes; cash effects also depend on costs and working capital.
Cash is tracking profit, which is the test a commodity boom usually fails. Newmont generated $10.33 billion of operating cash flow in FY25 against $7.09 billion of net income, spent $3.04 billion on capital, and kept $7.29 billion of free cash flow, 103% of net income. In the first half of 2026 operating cash flow was $6.71 billion, capital $1.36 billion, free cash flow $5.35 billion against net income of $5.46 billion, or 98% conversion (10-Q, SEC). Earnings that arrive as cash are earnings that can be returned, and they are being returned: $NEM has retired more than 100 million shares, about 9% of its count, since the buyback began.
Basket & Positioning
$GDX is a fund of different business models wearing one label. It holds producers that dig and sell (the seniors), streamers that pre-pay a miner for a slice of future output at a fixed low price, and smaller producers whose costs and risks are higher. VanEck's own holdings page shows how concentrated the top is: the ten largest positions are 58.8% of a $26.2 billion fund that charges 0.51% a year (VanEck). The six names below represented 44.62% of the fund on October 2, substantial concentration but less than half.
Table terms: FCF; IPO; EBITDA; OCF.
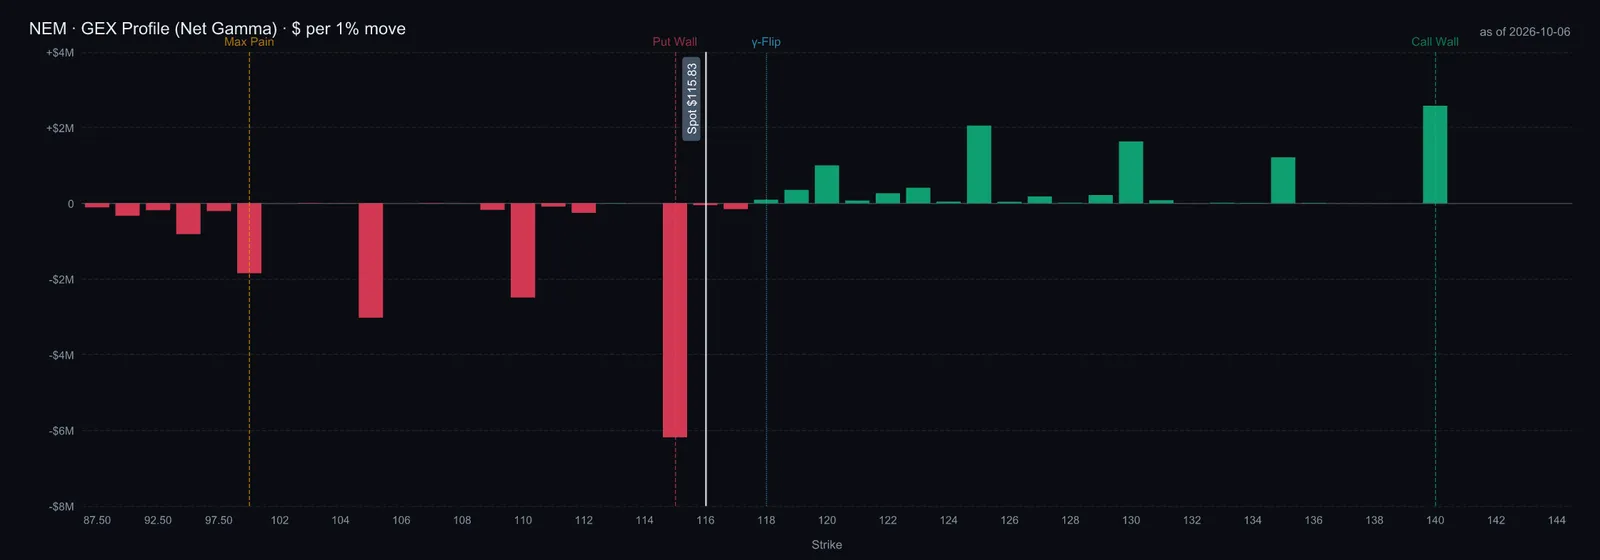
$NEM is the fund's core and its best evidence. Q2 2026: 1.3 million ounces of gold, all-in cost $1,621 against a full-year guide of $1,680, realized gold $4,414, adjusted EPS $2.10, $3.4 billion of net cash and a record Q2 free cash flow of $2.2 billion (Newmont Q2 2026). Its put wall at $115 sits right under the $115.82 close, and its call wall is $140.
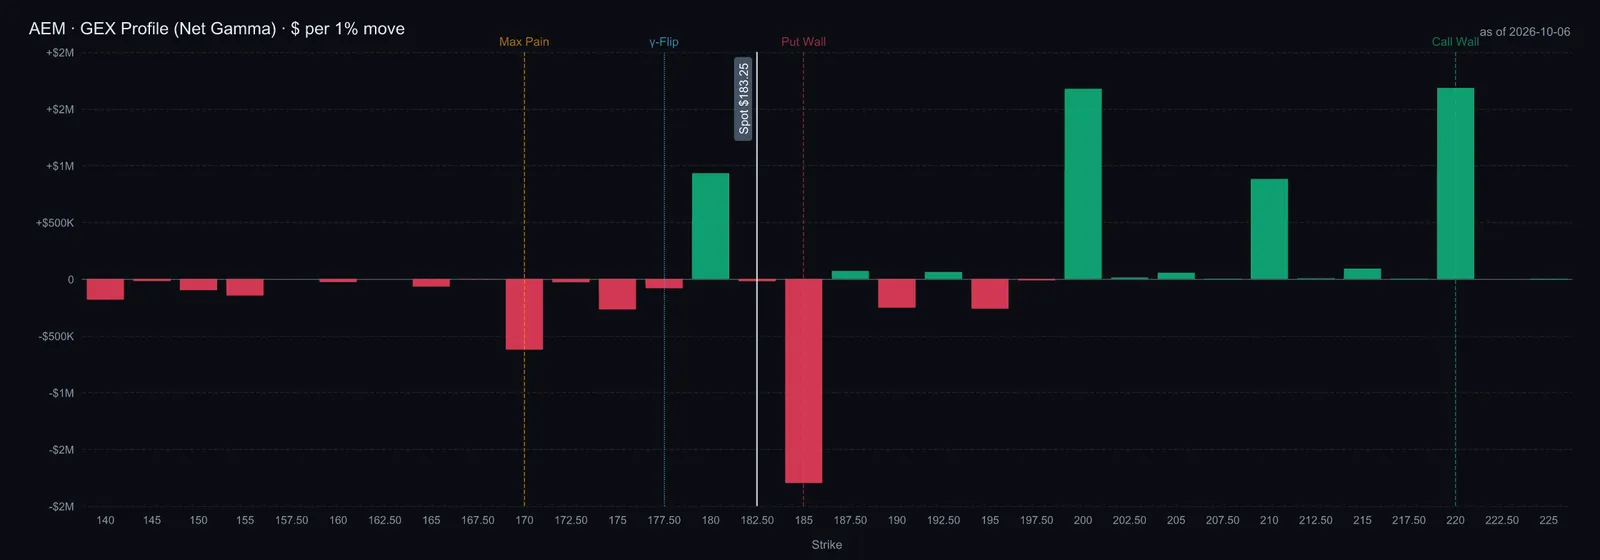
$AEM is the quality challenger, and on costs it wins. Agnico produced 856,000 ounces in Q2 at cash costs of $1,054 and all-in cost of $1,459, delivered record free cash flow of more than $1.3 billion, ended with about $3.3 billion of net cash, and was upgraded by Fitch to A- in April (Agnico Eagle Q2 2026). Its mines sit in Canada, Finland, Australia and Mexico, which is the jurisdiction premium you pay for. Against $NEM it has the lower cost and a different jurisdiction mix; $NEM has the larger buyback and the copper. Its options put wall is $185, just above the $183.33 close.
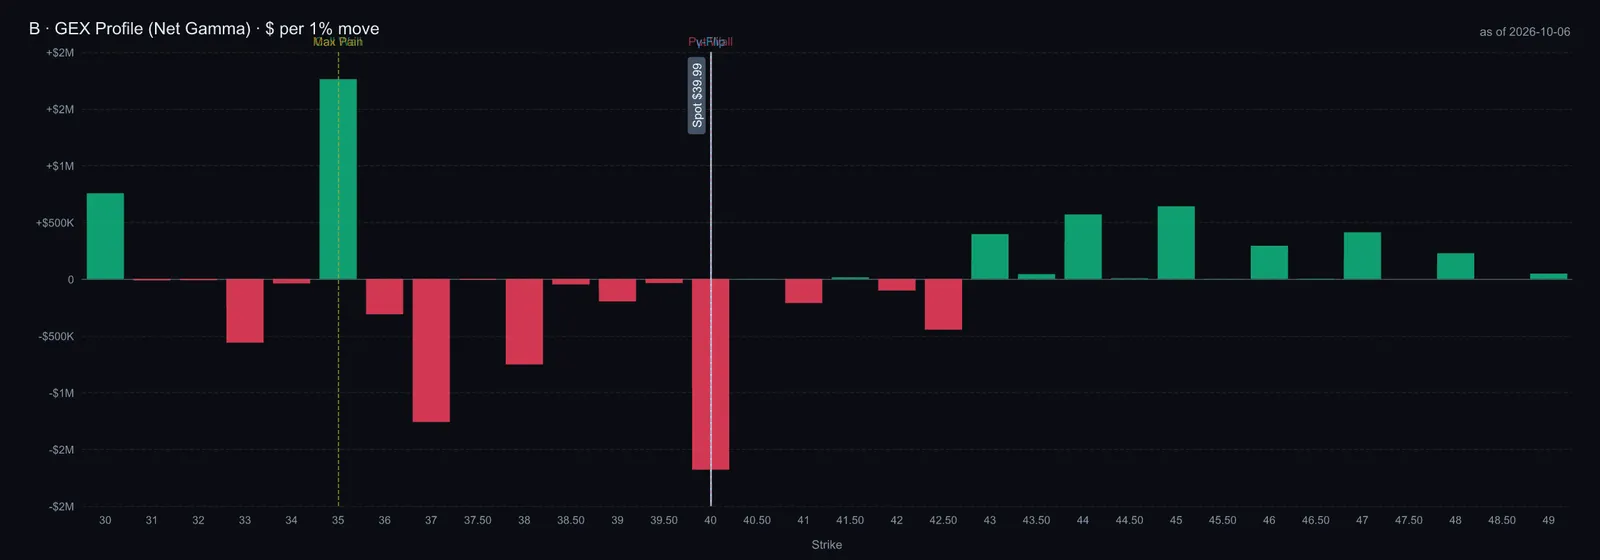
$B is the restructuring story inside the fund. Barrick reported Q2 net earnings of $1.2 billion, adjusted EPS of $0.82, attributable EBITDA of $2.5 billion at a 59% margin and $1.2 billion of net cash; free cash flow fell 33% year on year because of tax timing and a one-time $200 million payment tied to Loulo-Gounkoto in Mali (Barrick Q2 2026). The same day it announced a roughly $4 billion package with Newmont over the Nevada joint venture that, management said, reduces the friction costs of a planned IPO of its North American assets. That is value that has not shown up in the share price yet, and risk that has not left it.
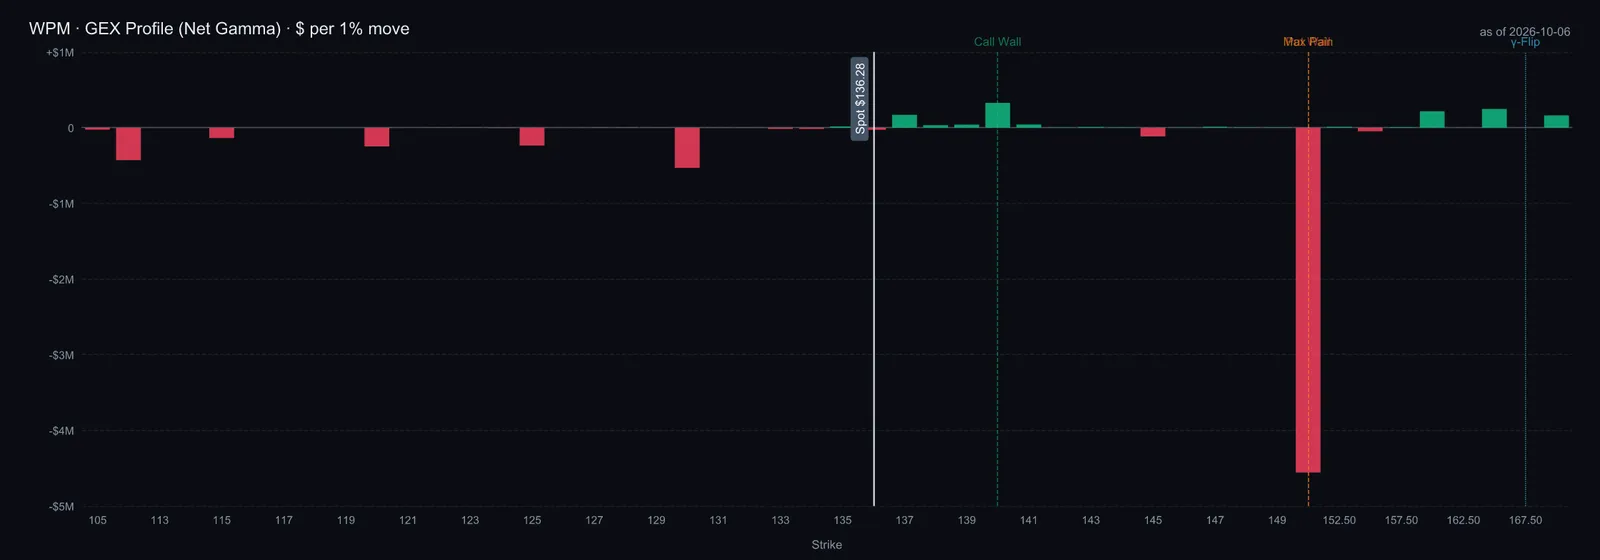
$WPM is the alternative to owning a mine at all. A streamer pays a miner cash up front for the right to buy part of its future gold or silver at a fixed low price, so it carries no diesel bill and no labor contract. Wheaton reported record Q2 revenue of $929 million (+85%), net earnings of $543 million and operating cash flow of $650 million; 46% of revenue was gold and 52% silver (Wheaton Q2 2026). Debt and concentration remain: the $4.3 billion Antamina silver stream bought from $BHP in April took it from net cash to about $1.9 billion of net debt, and one asset, Salobo, is still about 37% of production (Herukos). Its closest rival in the fund, $FNV, ran a 91% adjusted EBITDA margin in 2025 with no asset above 13% of revenue (Drew Crawford).
$KGC shows what the downside looks like when operations break. On September 23 Kinross cut 2026 and 2027 production to about 1.84–1.86 million gold-equivalent ounces a year, 2–3% below the low end of prior guidance, raised 2026 all-in cost guidance to $1,850–1,900, and in the same release lifted its capital-return target from 40% to 50% of free cash flow; the cut was concentrated at La Coipa, hit by extreme winter weather, and Round Mountain (Kinross 6-K). The stock fell 25% in a month and sits 20% below its 200-day. Cheap on earnings, yes, but the market is telling us that a mid-tier producer's cost guide is only as good as its two weakest mines.
Two substitutes compete for the same dollar. The first is bullion itself: $GLD carries none of the operating risk, and during the September sell-off investors repeatedly chose it over the miners, on October 1 gold and silver rose while all four mining ETFs fell (Silver & Gold Alpha). The second is outflow from the miners' own funds: the junior-miner ETF $GDXJ rose 275% over three years while losing $2.62 billion of assets to redemptions (Oliver Groß), which says this rally was carried by price, not by new money. Neither is a reason to avoid the sector; both are reasons the miners need a gold uptrend, not just a high gold price, to outperform.
Management & Track Record
Three of the five seniors are run by people who were not CEO eighteen months ago, and that is the governance fact of this cycle. Call transcripts date each change: Natascha Viljoen first spoke as Newmont's president and CEO in February 2026, Mark Hill as Barrick's interim CEO in November 2025, and Haytham Hodaly as Wheaton's CEO in May 2026.
Table terms: CEO; COO; FCF; CFO; IPO.
The record that matters is capital discipline at the top of the cycle, and so far it holds. The last gold boom ended in 2011–2013 with write-downs on acquisitions bought at peak prices. This time the seniors are buying back stock, raising payout ratios and holding net cash: Newmont targets net cash of $1 billion ± $2 billion and sits at $3.4 billion, Agnico has returned 48% of first-half free cash flow against a 40% target, and Kinross raised its target to 50%. The test still ahead is M&A: Gold Fields' rejected $27 billion approach for Northern Star in late September is the first sign that the urge to buy at the top has not died. The September proposal filing describes a non-binding offer, not a completed acquisition.
Risks & What Breaks It
The operating test has now occurred. The original research compared Newmont’s Q3 AISC with its then $1,680 annual guide. A quarter should not be mechanically equated with a full-year average. The November update below reports the actual result. A persistent squeeze from lower realized gold prices and higher unit costs would weaken the thesis; a break of the historical $GLD $355.80 low was a dated market-risk observation, a historical risk observation.
Price Setup — Levels, Technicals & Options
$GDX is below every average that matters, and its dealers are short gamma. The fund closed at $87.42 on October 5, under its 20-day ($93.06), 50-day ($91.68) and 200-day ($91.10) averages, 25% below its March high of $117.18 and 28% above its 52-week low of $68.13. The 50-day crossed above the 200-day on October 2, a "golden cross" that preceded a doubling the last time it happened in February 2025 (Barchart), but price is beneath both lines, so the cross describes the last three months, not the next one.
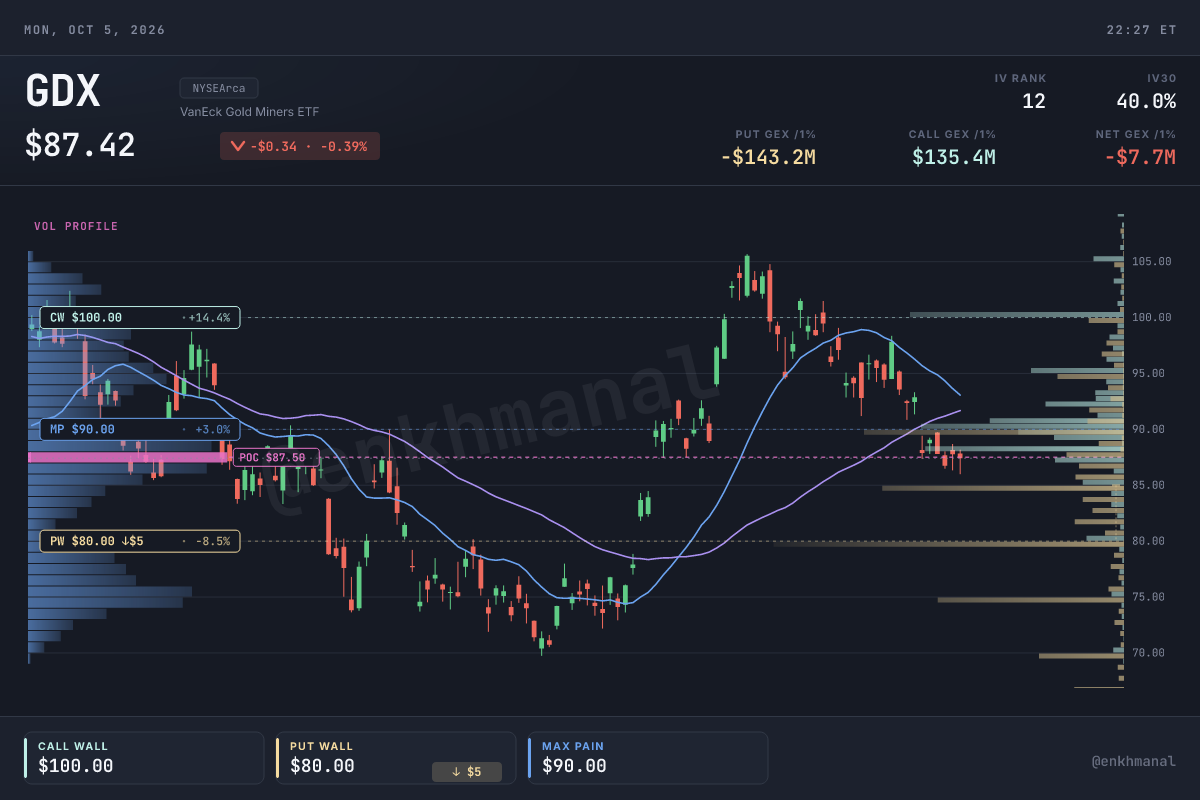
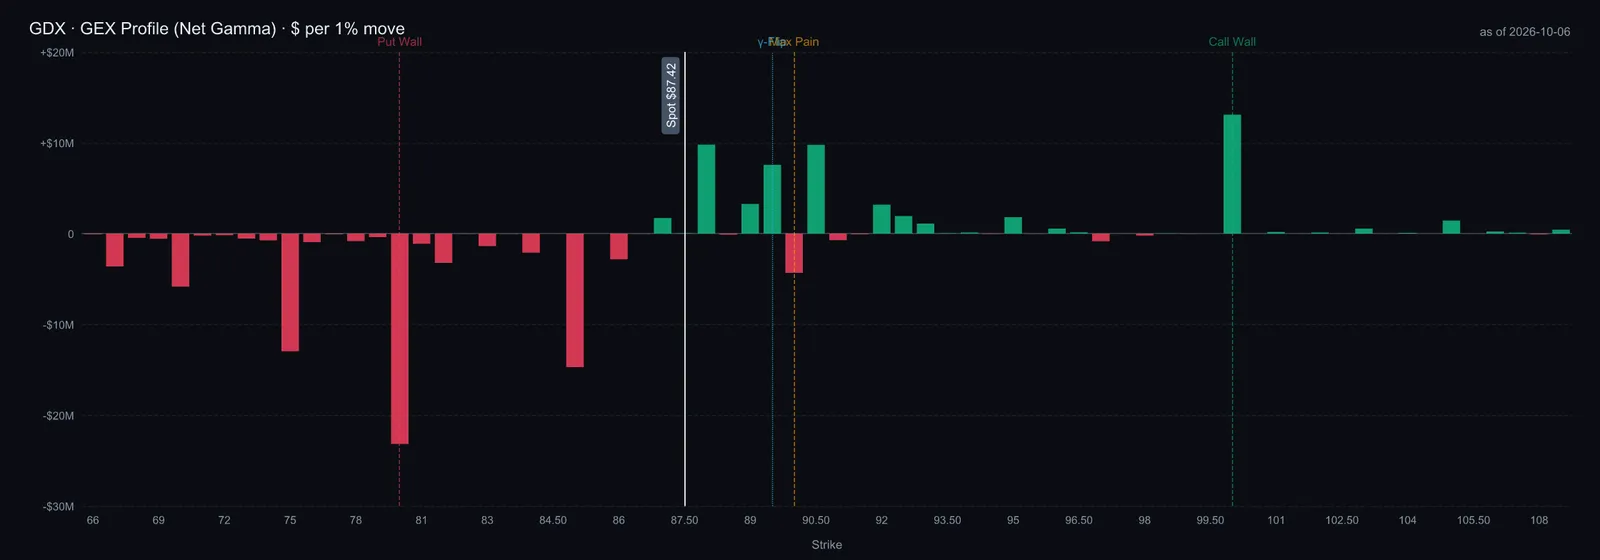
The options map puts the battle between $85 and $93. Net dealer gamma on $GDX is slightly negative (−$10 million), with the gamma flip at $89.50, max pain $90, the put wall at $80 and the call wall at $100; put open interest outnumbers calls 1.43 to 1. Thirty-day implied volatility is about 40%, which prices a one-standard-deviation move of roughly ±$10 by month-end. Traders on X frame the same levels, $93 on a bounce, $85 if weakness continues (Danny Naz). A close back above $92 clears the flip, the 50-day and the 200-day in one move; a break of $85 opens the way to the $80 put wall.
Relative strength was an open question in the October snapshot. The research described October 2 as a session when mining funds held up better than bullion. One session cannot establish a durable turn; repeated outperformance and improving reported cash generation would be stronger evidence.
Valuation & House View
On trailing earnings the leaders are cheaper than their own history. $NEM trades at 14.6× trailing diluted EPS of $7.92, against a five-year median of 18.1×, the 27th percentile of its own range, with a trailing PEG of 0.85 on 17.3% EPS growth (SEC XBRL; foreign filers' quarterly XBRL is not available, so the others are shown on Q2 2026 adjusted EPS annualised). Annualising Q2 adjusted EPS gives $AEM 14.9×, $B 12.2×, $KGC 8.3× and the streamer $WPM 28.6×. Trailing free cash flow tells the same story: Newmont $9.7 billion, Barrick $5.2 billion and Agnico $4.6 billion over the last four quarters, the highest the group has produced (Oliver Groß), with record cash balances (Oliver Groß).
Q2 earnings were booked at $4,414 gold; the October research used a lower spot-price snapshot. That is the trap in a cheap-looking miner: the multiple is low on earnings the current price will not repeat. So instead of a target we ran a return-hurdle screen, what each name's per-share earnings must grow at for three years for an investor buying at the October 5 close to make 10% a year, at two exit multiples. The base is Q2 2026 adjusted EPS × 4, from each company's own call or deck.
Table terms: EPS; P/E; CAGR.
Read the screen against the gold price, because that is what EPS will track. At an 18× exit, $NEM's own five-year median, Newmont needs roughly flat earnings to return 10% a year and Barrick can absorb a decline, as can Kinross at 12×; at the low exits they need 11–15% a year, which requires sustained growth in realized prices, production or per-ounce cash generation; buybacks can also help. $AEM needs more growth at either multiple, which is the premium for its costs and jurisdictions. $WPM needs 8–24% a year at streamer multiples, the premium for owning contractual metal rights rather than directly operating mines. The apparent valuation discount depends on sustainable earnings, future gold prices and the chosen exit multiple. A $4,150 gold price does not by itself make every miner cheap.
Historical scenario assumptions include AISC and gold-price paths; these are illustrations, not forecasts.
Conclusion. The opportunity is cash growth per share: resilient metal prices, controlled sustaining costs and disciplined repurchases can reinforce each other. Newmont offers strong cash returns; Agnico Eagle offers operating quality but its Q3 cost increase deserves attention; GDX diversifies individual-mine risk without removing gold-price exposure. Wheaton substitutes contractual and counterparty risk for direct operating costs. Kinross shows why company-specific production problems matter even in a strong commodity market. The October 30 review date has passed; read the completed results in the dated update alongside the original thesis.