$FIGR — The toll booth on trapped home equity, priced like a crypto stock
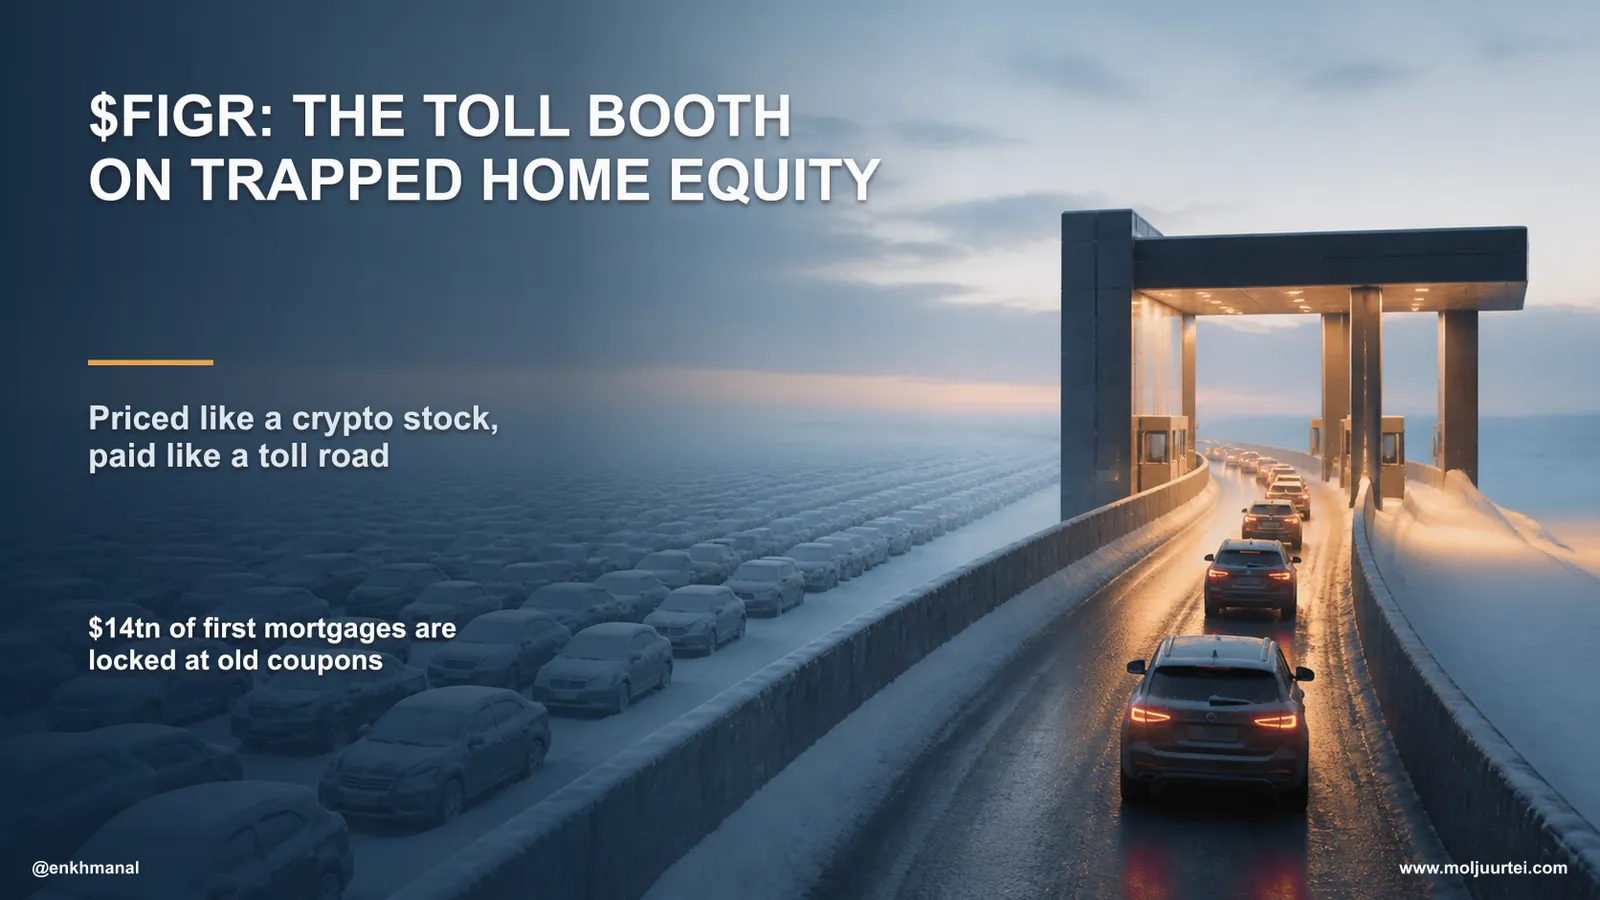
A home-equity loan is a promise to repay. Almost everything expensive about making one is the paperwork proving who owns that promise — the title search, the county clerk, the notary, the custodian, the trustee, each keeping a private copy of the same fact. $FIGR's bet was that if every party reads from one ledger, the paperwork stops being work. That bet is now 87% of its own origination volume, and the market is pricing the company as a digital-asset proxy while the actual tailwind — a frozen mortgage market — has nothing to do with crypto.
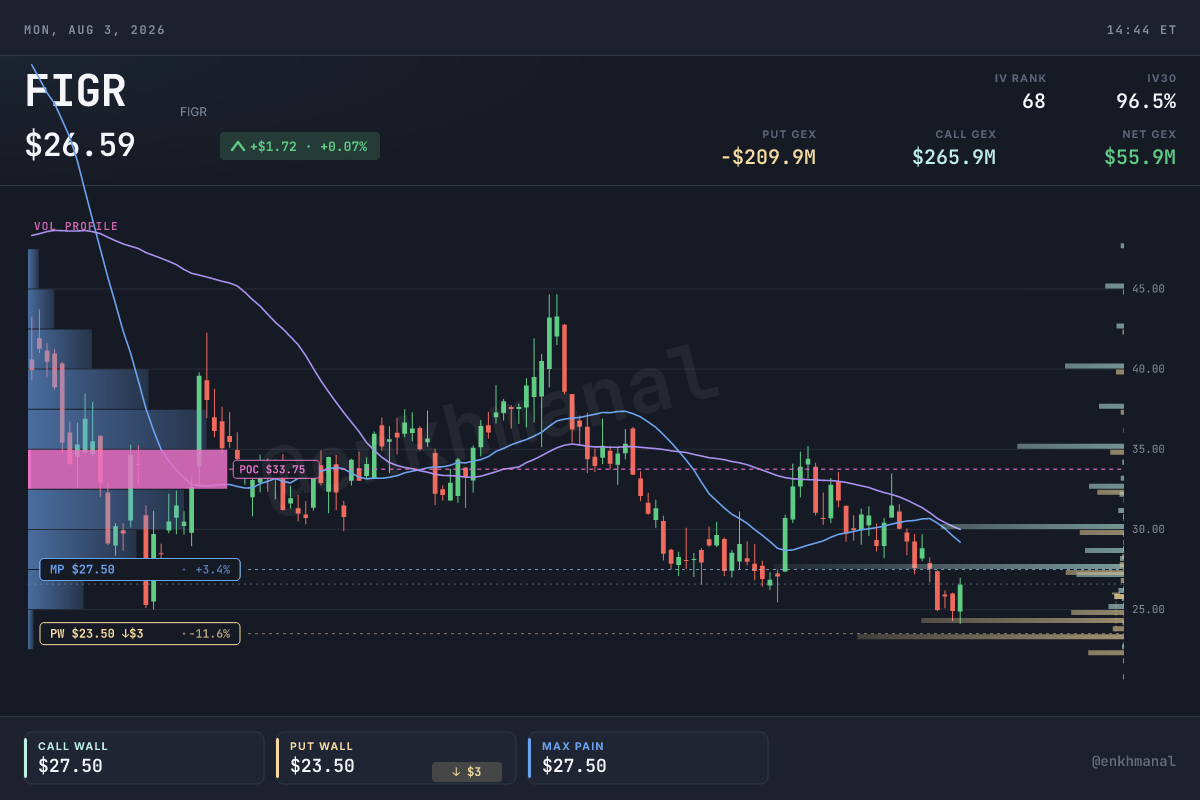
$FIGR price & levels, 180 days to 3 August 2026 — the 6 July high of $34.43 to the 31 July low of $24.87.
LOG 01 // THESIS
Priced on the word on the tin, not the business
At $26.88 — a ~$6.7B market cap on 248.8M diluted shares — $FIGR fell 27.8% from its 6 July high to a new low below its $25 listing price without a single company disclosure after 14 July, while the weekly data it publishes itself showed July volume running $51.9M/day against Q2's $46.8M/day. The demand driver is the rate lock-in, which is a mortgage phenomenon, and it strengthens as rates stay high.
What breaks it
Catalyst: Q2 results on 13 August premarket — the 14 August expiry prices a ±19% move on one morning.
The risk that matters: $51M a year of 8.5% notes began accruing 14 July while Kiavi stays unclosed, outside date 30 November.
Builds on the 12 July deep dive, which called for accumulation at $28-31. That zone came and went.
LOG 02 // BUSINESS
A tollkeeper on a road it also paved
$FIGR makes money at four points along a loan's life: an ecosystem fee when a partner originates through its software, a fee when that loan changes hands on Figure Connect, an administration fee when a pool is securitised, and a servicing fee for the roughly five years the loan is outstanding. It began in 2018 originating under its own name, then let other people originate and charged them for the rails — Figure Connect launched June 2024 and had transacted about $3.9bn across 48 onboarded participants by end-2025. Loans are sold in a weighted-average 20 business days, so very little credit stays on the balance sheet.
FY25 home equity facilitated
$8.3B
+62% year over year (10-K)
Active partners
307 → 387
end-2025 to Q1'26
Q1'26 revenue
$167.0M
+97.6% YoY, net income $44.9M (10-Q)
Origination to sale
20 days
weighted average; 45 days to securitisation
The tailwind is filed under the wrong heading. The hiking cycle froze the American mortgage market: roughly $14 trillion of first-lien debt sits at coupons no borrower will refinance away from, so a homeowner who needs cash cannot reach it through the front door. The only door left is a second lien against equity they already own. Home-equity demand rises precisely when refinancing dies — which makes a high-rate world a tailwind for the company that manufactures that product most cheaply. This has nothing to do with the price of any token. It has to do with 6.5% mortgages and a homeowner who needs $80,000.
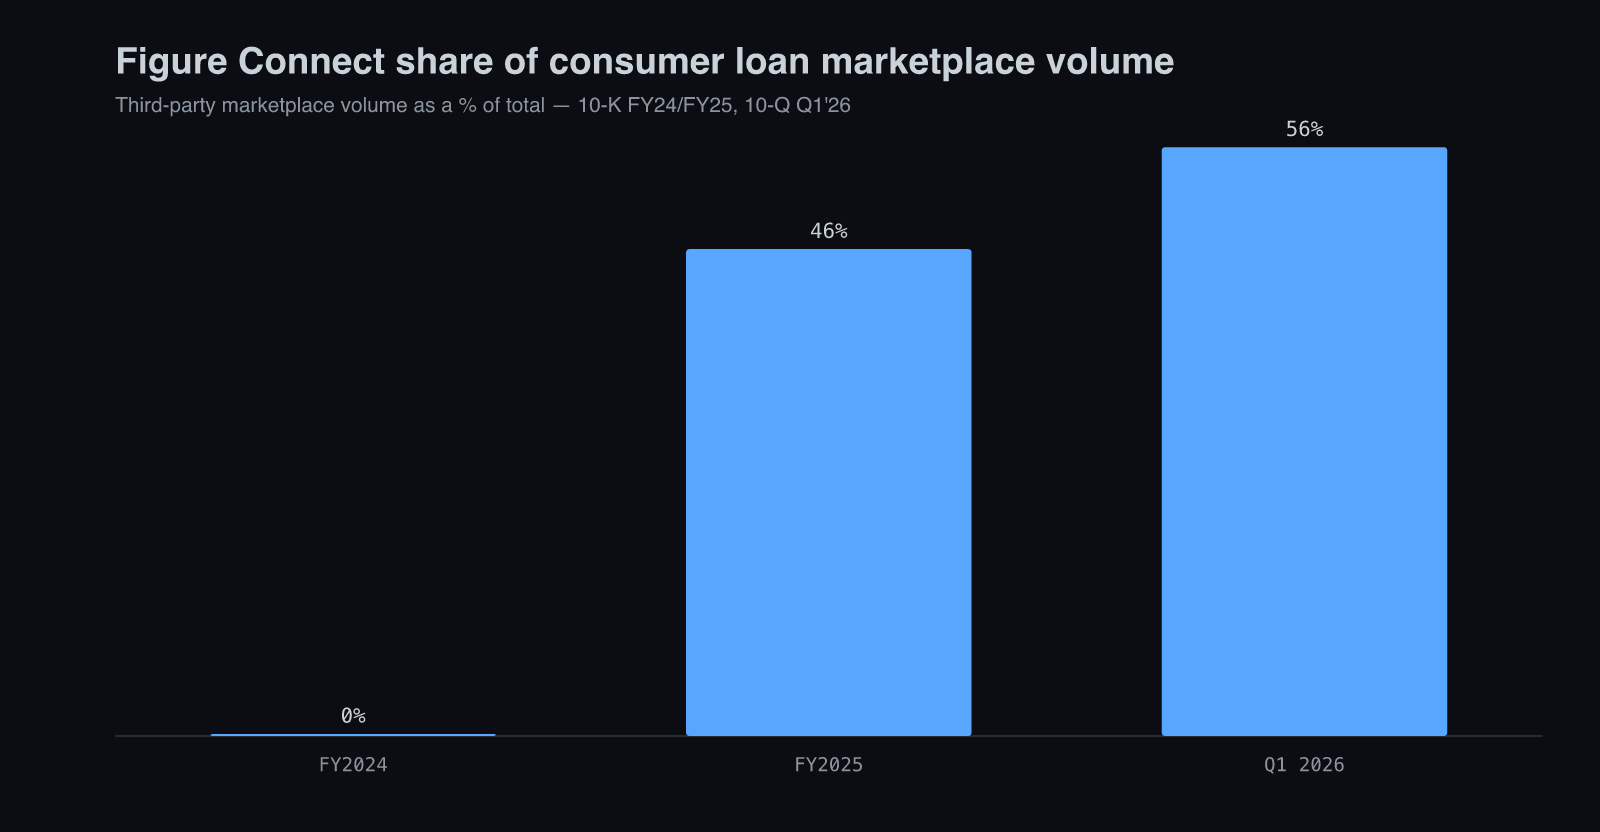
Figure Connect volume went from $8.1M in 2024 to $3.84bn in 2025. By Q1 2026 the marketplace carried more than half of everything the company touched. Source: 10-K FY24/FY25, 10-Q Q1'26.
LOG 03 // MOAT
One ledger instead of six that must be reconciled
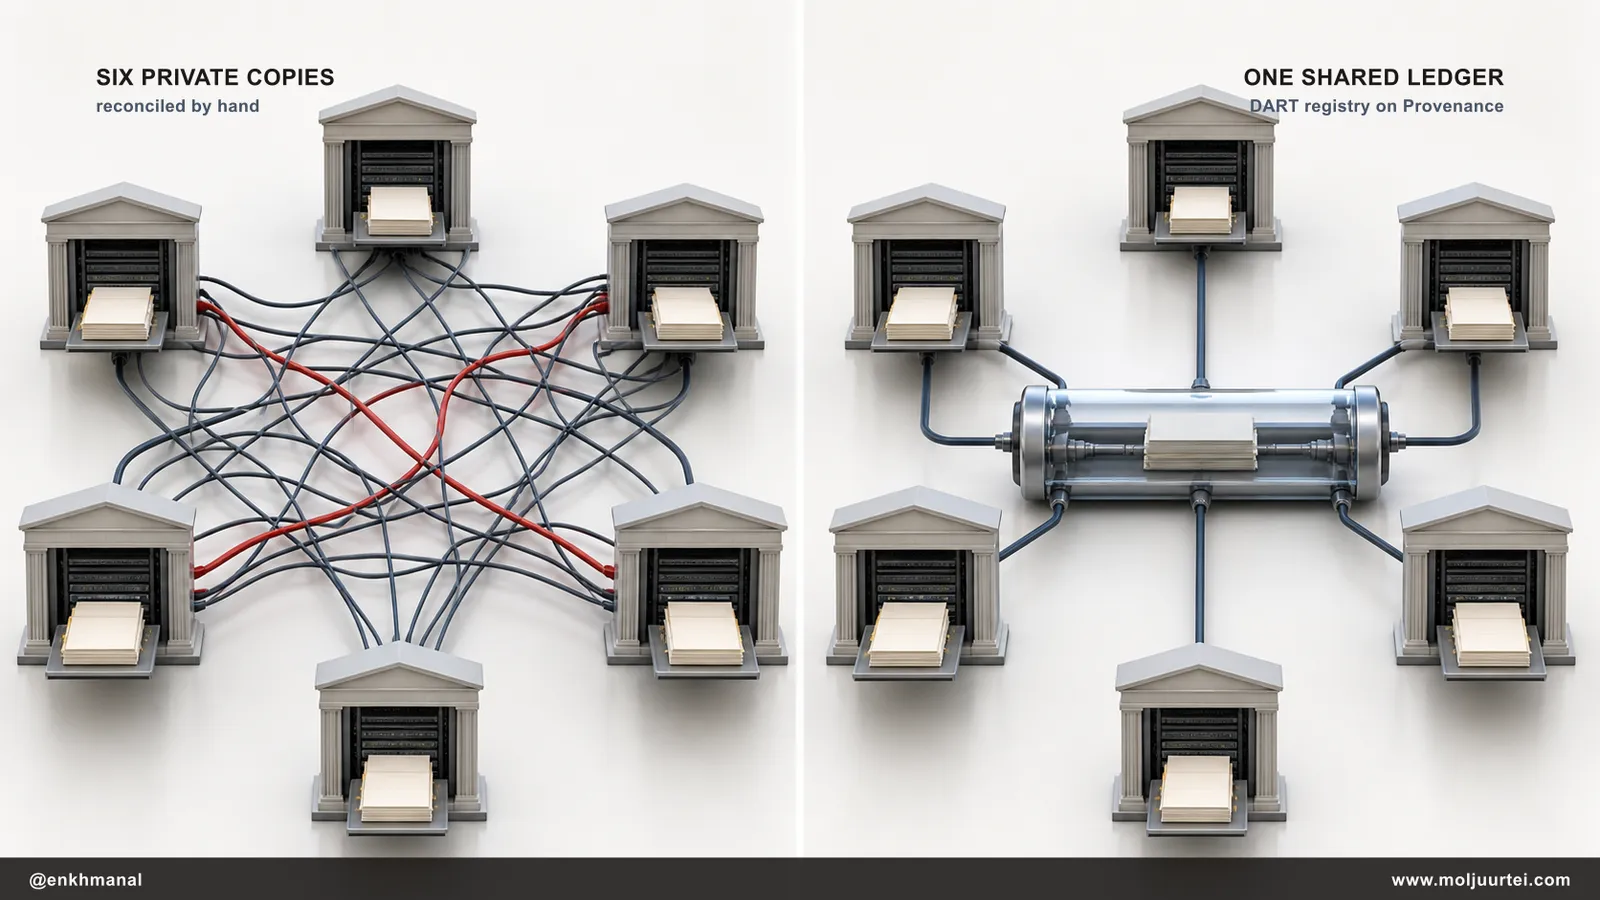
Ask what the blockchain is actually replacing and the answer is unglamorous, which is the point. When a loan is originated, sold, pledged and serviced, half a dozen institutions each keep their own record of who owns it and who has a claim on the property. Reconciling those records — title work, lien recording at the county, custody of the note, diligence before a sale — is the cost. DART is an electronic register of servicing rights and loan ownership living on the Provenance chain that updates ownership and transfer automatically. One record, visible to every party, instead of six.
DART replaces six separately reconciled records with one shared ownership ledger on Provenance.
DART adoption — share of loans originated through Figure's system
% of LOS originations
Company-reported in the FY2025 Form 10-K filed 16 March 2026. Technology theses usually die in the gap between 'it works' and 'anyone uses it'; this one crossed in twelve months. No estimates.
What it costs to run is almost comic: chain fees are paid in the utility token, and the average has been under one token since 2018 — about two cents at end-2025 — which Figure pays on behalf of every participant. The second moat is the one nobody can code around. To do this you must simultaneously be a lender in every state, a money transmitter, and a securities firm: more than 180 lending and servicing licences, 48 money-transmitter licences, and an SEC-registered broker-dealer with authority to run an alternative trading system. A competitor with better software still needs years and a compliance department to stand where Figure already stands.
“
The scalability of DART is a competitive moat for Figure — it tracks the liens at the county level, as well as preventing the eNote from being double sold or pledged.
— Michael Tannenbaum, CEO — Kiavi M&A call, 10 June 2026
Who is actually coming for this. Each rival attacks one layer rather than the stack: $ICE owns the incumbent origination system and the electronic lien registry the industry already runs on; Blend Labs sells origination software to banks that intend to keep the loan; $RKT and Better originate at scale on their own balance sheets; Aven chases the same borrower directly with a home-equity credit card. Figure's claim — and it is a claim, not an audited fact — is that none combines origination, registry and secondary marketplace on one ledger. The contest to watch is for the partner's software seat: a partner who standardizes on someone else's system never reaches Figure Connect at all.
LOG 04 // ROADMAP
The year of the first lien
2026-02-26Operational
Auto loans go on-chain
An Agora Data partnership brings US auto loans on-chain; by late July the live pool shows ~$153.5M outstanding at an 8.25% lend rate — a product line that did not exist eighteen months ago.
2026-06-10Award$717M
Kiavi acquisition agreed
$532.4M cash of a $717M headline; a Sixth Street JV absorbs the loan book plus a $3B forward purchase. Figure keeps the engine, someone else warehouses the credit — roughly $7B of added volume and $35M of synergies.
2026-07-14Risk8.500%
$600M senior notes close
Net proceeds ~$587.5M. About $51M a year of interest begins accruing with Kiavi still unclosed — roughly $11M lands in Q3 against zero acquired earnings.
2026-08-13Policy
Q2 2026 results
Premarket, 07:30. Consensus $214M revenue, $113M EBITDA, $0.32 EPS across six analysts — and the first guide to carry the interest drag.
2026-11-30Risk
Kiavi outside date
Still open: supermajority equityholder approval, antitrust expiry, state licences, a pre-closing restructuring and an asset sale.
LOG 05 // THE SETUP
The company reports every Tuesday. The stock ignored it.
On 7 July $FIGR stopped monthly disclosure and began publishing a weekly operational dashboard, refreshed every Tuesday after the close. That decision is why this drawdown is legible: the 28 July refresh covers data through 26 July, and it says the business accelerated through the entire de-rate.
Weekly consumer loan marketplace volume
USD m
Company-reported on the weekly investor dashboard, data through 26 July 2026. W30 is +98% year over year. No estimates.
Metric
Q1'26
Q2'26
Jul 1-26
Marketplace volume
$2.90b
$4.26b
$1.35b
Implied volume per day
$32.2M
$46.8M
$51.9M
$YLDS in circulation
$598M
$556M
$596M
Prime — matched offers
$368M
$392M
$517M
Prime — lender supply
$453M
$522M
$690M
One qualifier, and it is the most important number in the model: revenue does not grow as fast as volume, and the two available yield measures point in opposite directions. The rate Figure discloses — Net Take Rate, the fees it earns on the volume it monetizes — rose to 3.8% in the first quarter of 2026 from 3.6% a year earlier. The cruder ratio of total net revenue to total marketplace volume fell, from 6.2% to 5.75% across the same span. Both are true, and the reconciliation is mix: partner and Connect volume is compounding far faster than Figure's own book, and a partner-originated dollar earns less gross revenue while consuming no balance sheet. A headline +132% volume therefore converts to roughly half that in revenue. Any model built off volume alone overstates this company by a wide margin — but a rising disclosed take rate is a reason to doubt the sell-side's further step down, not to extrapolate it.
Set that against what actually moved the stock. $FIGR ran 27% from $27.05 on 29 June to $34.43 on 6 July into the pre-announcement, then fell 9.8% on 7 July when the beat itself arrived — $4.26bn of quarterly volume against a guided $3.8-4.1bn. Everything after was mechanical: the notes priced at 8.5%, Keefe Bruyette cut its target from $55 to $45, Piper Sandler from $75 to $65, the CFO sold 4,000 shares at $28.13, and the stock printed a 52-week low on the insider-selling headline. No 8-K has been filed since 14 July. Businesses do not deteriorate in silence while their own weekly data accelerates.
LOG 06 // RISK
What breaks it
What breaks it
The bear case that is actually good: BofA rates $FIGR Underperform at $33, arguing the origination system may not work in bigger loan segments and that banks holding loans on balance sheet do not value Connect's distribution. That last clause caps the addressable partner base well below the headline opportunity — and it is the largest institutions that are most likely to hold.
Negative carry, running now: $51M a year of interest began accruing 14 July with Kiavi unclosed. Q3 absorbs roughly $11M against zero acquired earnings, and the 13 August guide is the first to carry it.
Earnings quality: FY25 net income of $133.9M sits above pretax income of $113.7M on a $20.6M tax benefit, and operating cash flow of roughly $63M ran far below net income. Much of the gap is the ~20 business days a loan sits before sale.
Insider distribution: ninety-day net open-market sales of about $11.56M with no open-market buys, and fifteen Form 144s since March. Several of the largest are non-discretionary tax withholding on vesting stock — but nobody bought the lows.
Dilution and governance: weighted diluted shares went from 141.8M in FY25 to 248.8M in Q1'26; a dual-class structure concentrates voting control, and a material weakness is still being remediated.
Democratized Prime had not generated material revenue as of the FY25 10-K — Figure seeded it with its own assets. Treat it as optionality with a real fee structure, not as a segment.
Sizing the housing risk, since "air pocket" is otherwise just a phrase: loans held for sale stood at $503.9M at fair value on 31 March — about 7.5% of market capitalization — turning over in roughly 20 business days. The larger exposure is volume: a second lien averaging ~$92,000 behind a first mortgage the borrower will not refinance, written to a 755 weighted-average credit score. A 10% price decline compresses the equity available to lend against rather than impairing willingness to pay, so it surfaces as fewer originations, not credit losses. No combined loan-to-value is disclosed, so the price-to-volume elasticity cannot be estimated honestly from public data.
Chain dependency: the 10-K states that if the utility token were deemed a security, Provenance could become impractical and Figure would have to migrate chains. Low probability, high consequence.
Why it works
DART went from 2% of originations in FY24 to 87% in FY25 — the adoption gap most technology theses die in, crossed in twelve months.
July volume ran $51.9M/day vs $46.8M/day in Q2 — acceleration, not deceleration.
Weighted-average borrower credit improved to 758 from 734 on the comparable securitisation.
More than 180 lending licences, 48 money-transmitter licences and a broker-dealer with trading-system authority — a wall software cannot climb.
Even the most bearish published target, BofA's $33, sits 24% above spot.
What I am watching
Banks that hold loans on balance sheet have no need for Connect's distribution, capping the partner base.
$51M a year of interest accrues now against zero Kiavi earnings until the deal closes.
Operating cash flow has run far below net income, and FY25 profit was flattered by a tax benefit.
Insiders sold roughly $11.56M net over ninety days with no open-market buys.
Kiavi adds property-investor credit — more cyclical than home-equity lines, inside the same housing exposure.
LOG 07 // VALUATION
Paying a fintech multiple for the toll booth
Market cap
$6.7B
248.8M diluted shares at the 3 Aug close of $26.88
P/S trailing
11.4x
vs a 5.9x peer median — a 92% premium
P/S 2026E
7.8x
on $858M modelled revenue — author estimate
P/E 2026E
23x adj · 38x rep
reported EPS ~$0.71 after interest and a normalised tax rate
Quarter
Volume
Revenue yield
Revenue
Q1'26 actual
$2.90b
5.75%
$167.0M
Q2'26 consensus
$4.26b
5.02%
$214M
Q3'26 estimate
$4.75b
4.95%
$235M
Q4'26 estimate
$4.99b
4.85%
$242M
FY26 estimate
$16.9b
5.08%
$858M
Name
P/S trailing
Forward P/E
Revenue growth
$FIGR
11.4x
23x adj / 38x rep
+98%
$ICE
8.1x
18.5x
+9%
$COIN
6.4x
105.5x
-9%
$AFRM
6.4x
20.8x
+32%
$SOFI
5.4x
24.5x
+41%
$RKT
4.3x
18.6x
+75%
$UWMC
0.9x
5.6x
+45%
Peer price-to-sales is computed identically for every name — market capitalisation over trailing revenue, both from stockanalysis.com on 3 August 2026 — rather than mixing vendor multiples of unknown basis. $FIGR's $589M trailing revenue is the sum of Q2'25 through Q1'26 from SEC filings.
Where this lands versus the Street: the scenarios top out at $40 against a $55 median, and the bear at $20 sits below the most bearish published target ($33). The whole distribution is more conservative than the entire sell-side — deliberately, because published targets are struck off adjusted earnings and haircut neither the reported-versus-adjusted gap nor peer convergence.
Bear
$20
25%
Growth converges toward peers and reported earnings stay flat; the multiple compresses to the 5.9x peer median on 2026 revenue.
Base
$34
45%
2027 revenue near $1.25B at 6.8x sales — a modest premium to the 5.9x peer median for a name still growing far faster.
Bull
$40
30%
The marketplace and infrastructure mix earns $ICE own 8.1x on 2027 revenue as reported earnings finally inflect.
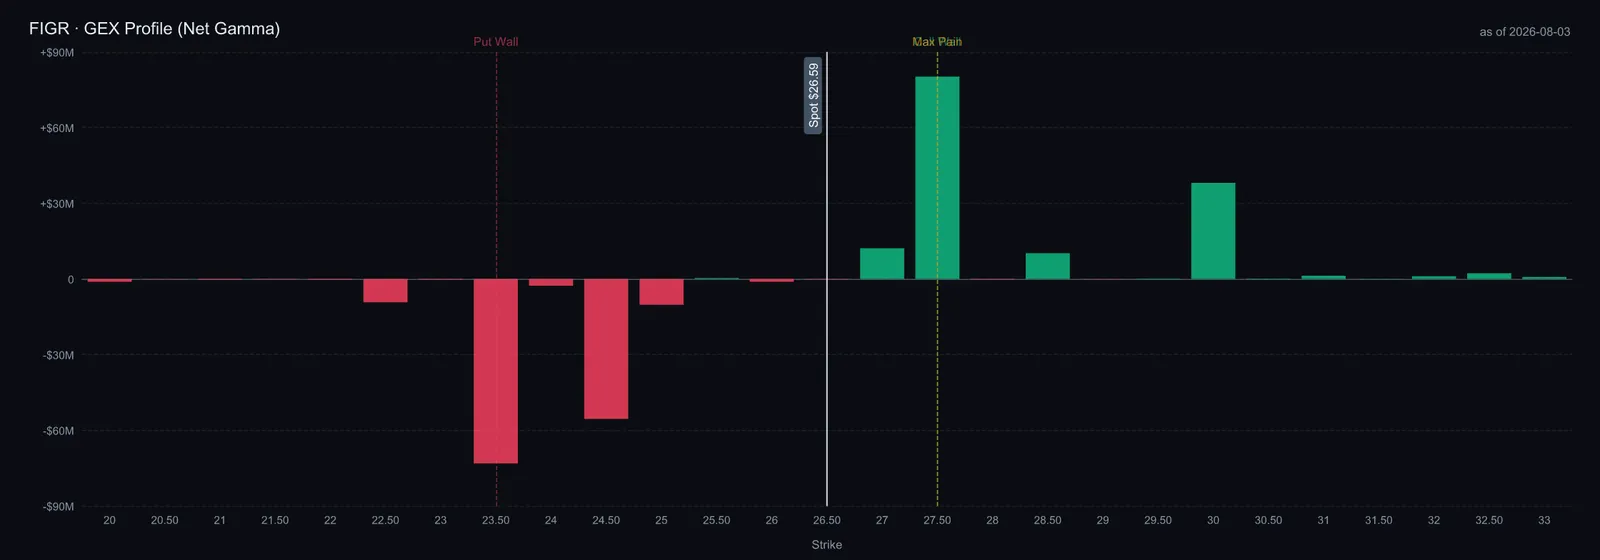
Dealer positioning into the 13 August print: net gamma −$60M, put wall $23.50, call wall and max pain both $27.50. Short gamma means dealers amplify the move rather than damp it.
Constructive, and the reason is the lock-in, not the ledger. This tailwind does not switch off when the Federal Reserve cuts; it switches off when refinancing comes back, and that needs mortgage rates several hundred basis points below anything currently priced. Until then, every quarter is one in which the cheapest manufacturer of the only credit product a rate-locked homeowner can actually use takes share in a market that keeps refilling itself. What you are offered at $26.88 is that toll booth at roughly seven times sales, with the stablecoin, the on-chain lending marketplace and the exchange thrown in at approximately nothing — because the market decided the word on the tin describes the business. Buy the de-rate rather than the $34 high, size for a ±19% morning on 13 August, and let the dashboard tell you every Tuesday whether the thesis is still true.
Sources: Figure's FY2025 Form 10-K (filed 16 March 2026) for the business, DART adoption, licensing and chain-dependency detail; Q1 2026 10-Q via SEC XBRL for revenue, net income and share count; the weekly investor dashboard (data through 26 July, refreshed 28 July); 8-K filings of 10 June and 6/7/10/14 July; Quartr company page 21352 for the S&P Global consensus of six analysts updated 15 July; Substack posts by Tomsoracle (25 July) and MountainTimeInvestor (3 July); X posts by @zoozai_invest and @Dr_Crossroads. Quartr's 23 June deck is a private placement document and is not reproduced or quoted here. Revenue and EPS projections for 2026 are the author's estimates built from the Q1 print and the dashboard's volume pace, not company guidance.