
Robot Parts Supply Chain Deep Dive — $XMTR, $PRLB, FANUC, Harmonic Drive and who gets paid before robots scale
Robots are still mostly being invented, and while that lasts, the money goes to whoever can turn a drawing into a metal part by Friday. The numbers each company reported this summer say it plainly: in April to June 2026 FANUC's robot orders rose 8%, while orders for the controllers that run machine tools rose 64%, and Proto Labs says revenue from robotics customers more than doubled in the first half. We follow one robot joint from a CAD file to the factory floor, compare seven listed companies along the way, and buy the two prototype shops, $XMTR and $PRLB, on growth and trend, while waiting on FANUC (6954.T) and Harmonic Drive Systems (6324.T).
Thesis
The robot boom is still a building boom: for now it pays the shops that turn designs into parts and the makers of the machines that cut them, faster than it pays the companies that assemble robots.
Backdrop — How the Theme Got Here
Start here. A robot is a machine that moves objects on its own, following a computer's instructions. A robot arm is a chain of joints, a shoulder, an elbow and a wrist, each turned by an electric motor. A motor spins fast but weakly, thousands of turns a minute with little force behind them, so every joint needs a reducer: a gearbox that trades speed for strength, turning a hundred fast turns into one slow, forceful one. A strain-wave gear is a reducer that does this with a flexible steel cup squeezed by an oval cam, small and light enough to sit inside a wrist and with almost no wobble. A humanoid is a robot shaped like a person, with several dozen of those joints where a factory arm has six. Everything below is about who gets paid to make the joints, the parts around them, and the machines that cut those parts.
The basic problem a buyer is solving has not changed in fifty years: a factory or warehouse wants a machine to do a job a person does now. For decades the answer was a six-axis arm bolted inside a safety cage and programmed point by point. FANUC, Yaskawa, ABB and KUKA have sold millions of them, and they work because the task never changes: the same weld on the same car door, thousands of times a day. Their limit is the same fact seen from the other side. A new task means a new program, often a new cell, and a part that arrives a few millimetres off confuses the robot. That is why most work in warehouses, kitchens and small factories is still done by hand.
What changed is the software. Models trained on video and human demonstrations, which the industry now calls physical AI, let a robot learn a task instead of being programmed for it. That turns robot-making into an iteration business. Hundreds of companies are redesigning grippers, hands, actuator housings and torsos every few weeks, and each redesign has to be built and broken before the next one. A design costs almost nothing to generate now; a tested one still costs real aluminium, real machine hours and real days. Each company in this memo sells one of three things into that loop: fast custom parts ($XMTR, $PRLB), the controls and machine tools that cut those parts and the finished arms (FANUC, with Yaskawa and $TER as rivals), or the precision gears inside the joints (Harmonic Drive, with Nabtesco as its rival). The opportunity is that a customer who used to buy one robot cell every few years now buys parts every week.
Policy added a push in the same direction. On 28 July 2026 the FCC added foreign-produced advanced robotic devices to its Covered List: mobile robots that navigate on their own, from humanoids and quadrupeds to robot vacuums, can no longer get the equipment authorisation needed to be imported or sold in the US, with two exits (K&L Gates summary). Fixed industrial arms are explicitly excluded, so FANUC's factory robots are untouched. The more important exit is the domestic end-product exemption, which requires US-made components to exceed 65% of the device's value, rising to 70% in 2029. A US humanoid company that wants to sell at home now has a reason to buy its brackets, housings and machined parts from American shops, and Proto Labs cited the rule by name in its 23 September robotics release.
Mechanism — Why Now & How It Works
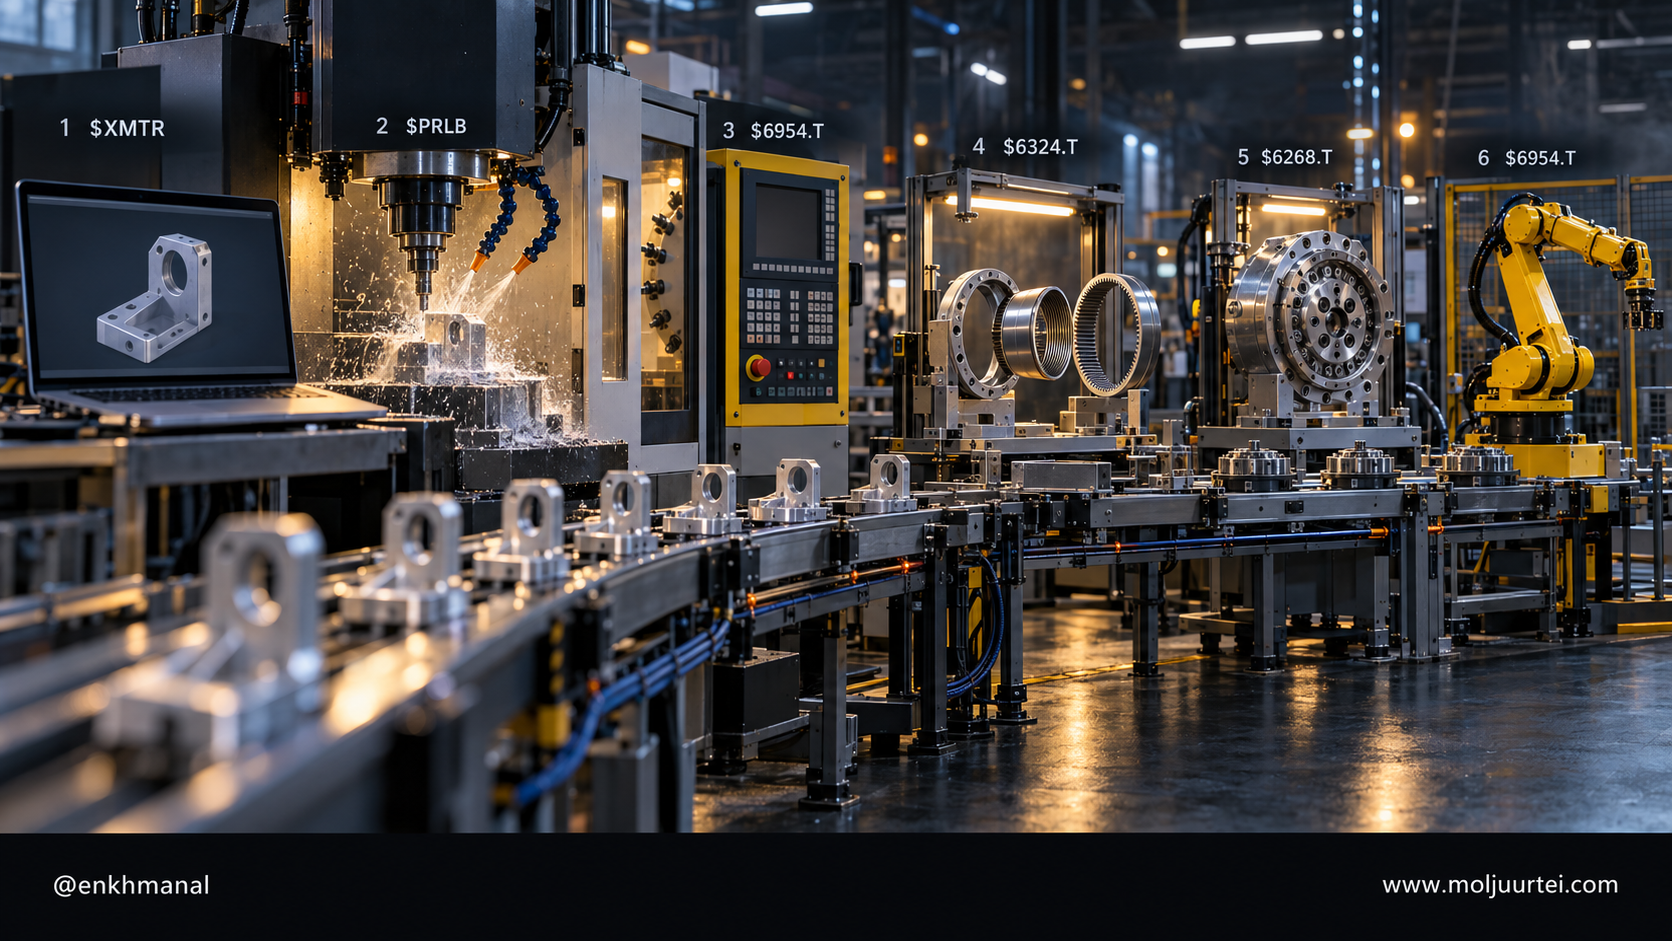
A robot joint passes through five steps on its way to a factory floor, and each one is a different business with a different customer. An engineer draws the part in CAD. A prototype shop quotes and machines it in days. The machine tool doing the cutting runs on a numerical controller, the computer that turns a drawing into tool paths. The finished joint pairs a motor with a reducer. Then the joint goes into an arm or a humanoid. The picture below puts a listed company on each step; the order matters, because the steps nearest the design get paid first when the industry is still iterating.
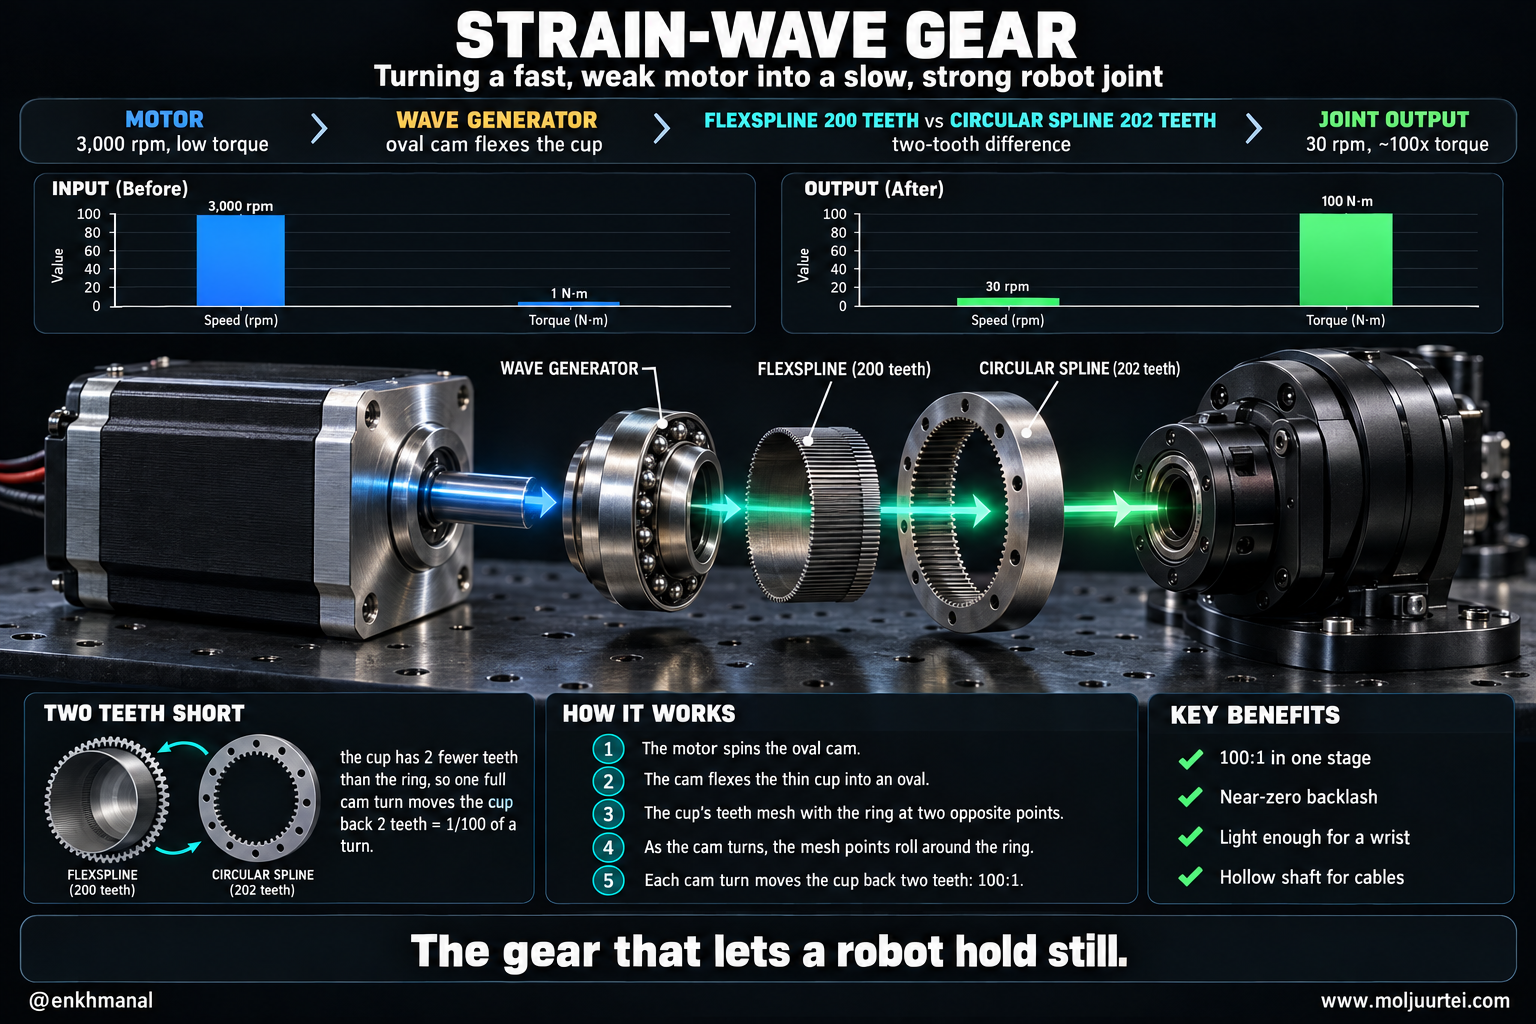
Inside the joint, the engineering problem is converting a motor's speed into strength without losing precision. There are four ways to solve it, and the memo only owns two. A strain-wave gear (Harmonic Drive's invention, now also made at scale by China's Leaderdrive) is compact, light and nearly free of play, which is why it sits in wrists, small arms and humanoid hands. A cycloidal RV reducer (Nabtesco's design) is stiffer and shrugs off shocks, so it sits in the shoulders and bases of big arms. The other two routes remove the precision gear: a quasi-direct-drive actuator uses a larger motor with a light planetary gearbox, and a roller screw turns rotation into a straight push for legs and torsos. We cover the first two as investments and the last two as the threat to them.
A strain-wave gear is worth understanding because its trick is unusual. An oval steel cam, the wave generator, spins inside a thin flexible steel cup with teeth on the outside, the flexspline. The cup sits inside a rigid ring with teeth on the inside, the circular spline, that has two more teeth than the cup: 202 against 200, say. The oval presses the cup into the ring at two points, and as the cam turns, those two contact points roll around. Because the cup is two teeth short, one full turn of the cam moves the cup back by only two teeth, one hundredth of a turn. A motor spinning at 3,000 rpm comes out at 30 rpm with roughly a hundred times the torque, before friction, and because many teeth are engaged at once there is almost no slack to wobble.
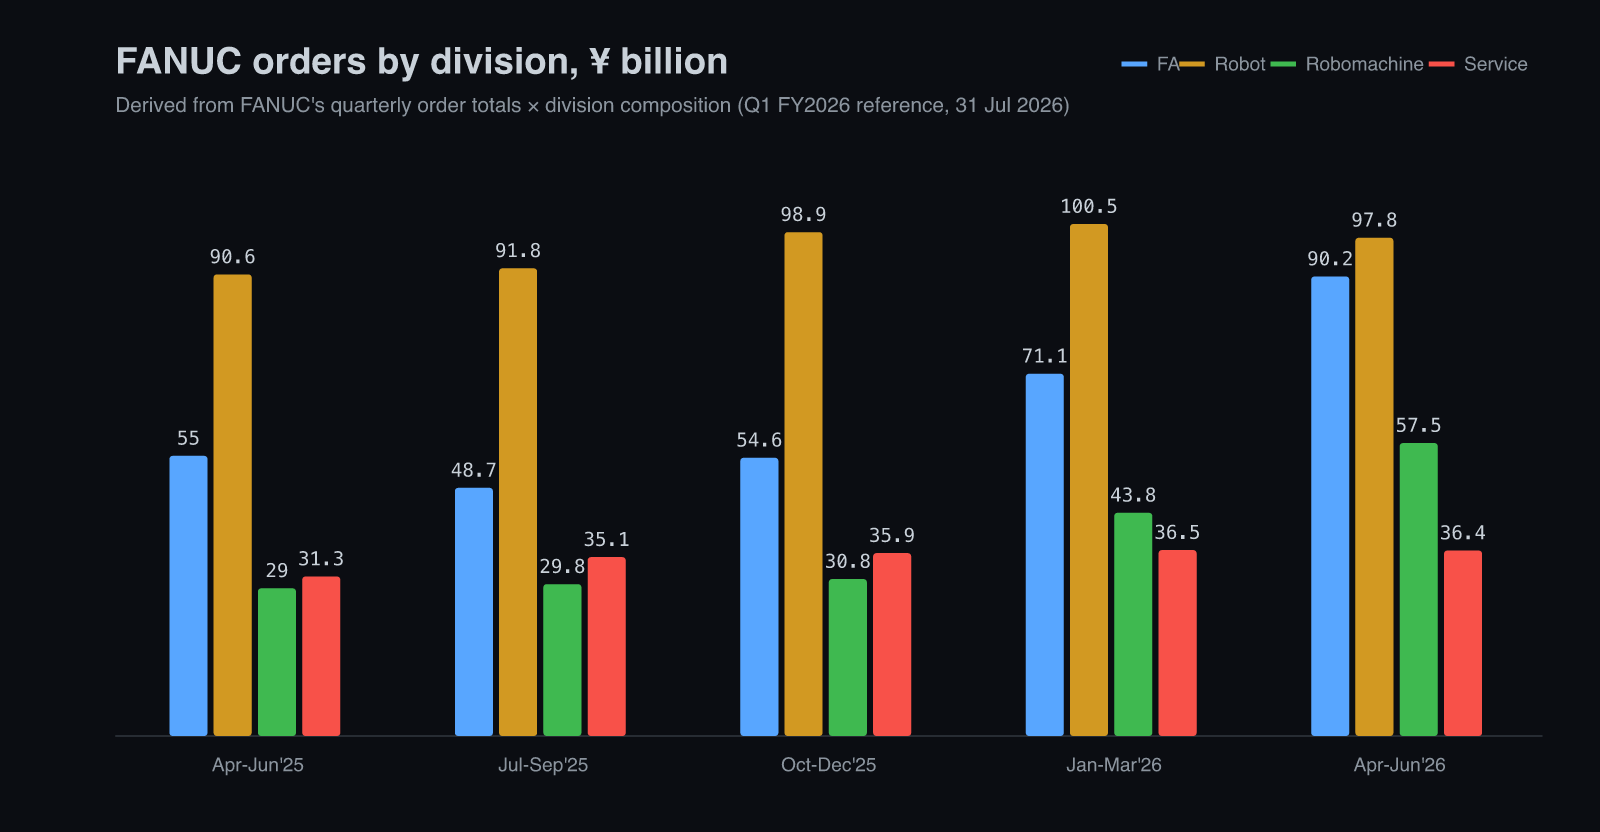
Where is the money landing today? FANUC's own order book answers it. In April to June 2026 the company took ¥281.9 billion of orders, up 36.9% on a year earlier. Robot orders were ¥97.9 billion, up only 8.1%. Orders for the FA division, the numerical controllers and servo motors that run other companies' machine tools, rose 63.8% to ¥90.2 billion, and orders for Robomachine, FANUC's own compact machining centres and injection-moulding machines, rose 98.3% to ¥57.6 billion (FANUC Q1 FY2026 reference). Asked what drove the FA surge, FANUC listed AI-server chips, consumer electronics, electric vehicles and "machined components for humanoid robots" in China (Q&A summary). The robot maker's fastest-growing business is selling the machines that cut robot parts.
Basket & Positioning
We compared seven companies, two at each contested step plus one outside challenger, and asked three questions of each in order: is there a real business with demand behind it, is growth accelerating, and is the price trending up on its 50- and 200-day averages. Multiples are in the valuation section as context; they do not set the ranking. Theme exposure is graded the way our underwriting standard requires: paid means a disclosed robotics or reducer figure, proxy means a disclosed number that moves with the theme but does not isolate it.
The longer record matters because three of these businesses were in a downturn two years ago. The table shows five fiscal years and the current-year guide on each company's own reporting calendar: $XMTR and $PRLB report calendar years, while FANUC and Harmonic Drive years end the following March, so their FY25 column is April 2025 to March 2026. For Harmonic Drive we use the ordinary-profit margin, the line its five-year summary carries.
Read across, the table says the downturn ended in 2025 and the recovery is now broad. FANUC's margin went from 17.8% back to a guided 23.0%; Harmonic Drive's ordinary margin climbed from almost nothing to a guided 11.0%; Proto Labs returned to growth after three flat years; Xometry never stopped growing and cut its operating loss every year. Sources: company filings and results releases ($XMTR 8-K, $PRLB 8-K, FANUC FY2025 results, Harmonic Drive securities report). On our ranking, the prototype shops lead because they combine the fastest disclosed growth with prices above both moving averages. FANUC is the best business in the group, with a 23% operating margin and ¥615 billion of cash, but its share price sits below both averages. Harmonic Drive's orders are the strongest of all, at the highest multiple. Nabtesco is the cheaper way to own reducers. Yaskawa and $TER fail the first question for this theme: robots are where Yaskawa's profit just disappeared, and $TER's robots are 7.5% of a chip-testing company.
The Marketplace: $XMTR
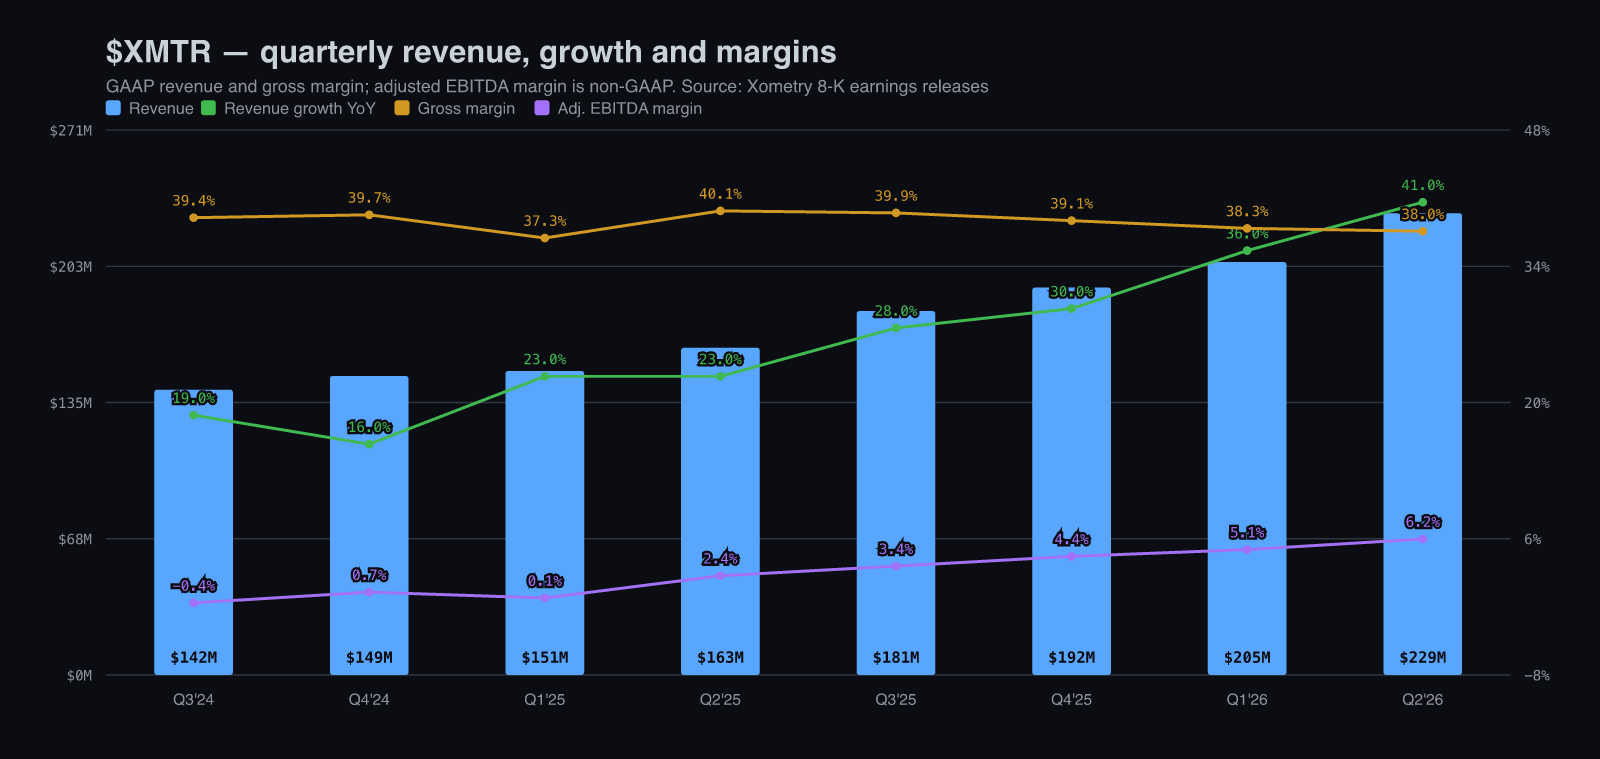
$XMTR is a marketplace: a buyer uploads a CAD file, gets an instant price from Xometry's pricing model, and Xometry hands the job to one of its outside shops, then delivers the part and carries the risk if it is wrong. It owns no machines. Revenue was $229.3 million in the June quarter, up 41%; marketplace revenue was $215.4 million, up 45%, and growth has accelerated for four quarters in a row, from 23% a year earlier (Q2 2026 release). Active buyers rose 20% to 89,557 and accounts spending at least $50,000 a year rose 23% to 2,039. Management has raised the 2026 revenue outlook three times, from at least 21% in February to 27–28% in May to 33–34% in August, with adjusted EBITDA of $60–62 million against $18.5 million in 2025. Its smaller supplier-services business, the Thomasnet industrial directory, shrank 3%.
This deeper integration is exactly what we saw with a major enterprise robotics leader who faced a critical build deadline. They turned to us with a massive challenge, nearly 200 complex parts [...] all needed within a short delivery window.
That quote is the only robotics example in eight stored Xometry calls since February. "Robot" appears in two of them and "humanoid" in none. Management credits the acceleration to better conversion from its pricing model, new buyers and larger wallets across "many verticals". So the honest reading is that robotics is a new customer group arriving on a platform already growing for other reasons, not the reason it grows.
Cash tells a slower story than the adjusted numbers. In the first half Xometry reported $24.6 million of adjusted EBITDA but a GAAP net loss of $10.6 million; operating cash flow was $17.5 million, and capital spending plus capitalised software took $24.0 million, so free cash flow was about −$6.4 million. The balance sheet is strong, with $516.7 million of cash and marketable securities against $85.5 million of convertible notes due in February 2027 and $243.2 million due later, but some of that cash came from shareholders: paid-in capital rose $330.6 million in the half and the share count rose about 11%, to 57.0 million at 30 June (10-Q).
The Factory Owner: $PRLB
$PRLB owns the machines. Most revenue comes from its own US and European factories, where automated quoting software drives computer-controlled mills, injection-moulding presses and 3D printers, and a partner network takes larger, slower jobs. Revenue was a record $149.3 million in the June quarter, up 10.6%; GAAP gross margin rose to 46.4% from 44.3% and GAAP operating margin to 7.6% from 3.7%, with GAAP earnings of $0.37 a share against $0.18 (Q2 2026 release). The company raised its 2026 growth outlook to 8–10% from 6–8%. On 23 September it said revenue from robotics customers more than doubled in the first half, without giving a dollar figure (Protolabs release).
The mix explains what is really driving Proto Labs. Machining produced 59% of the growth; 3D printing, the service most people picture for robot prototypes, shrank. Two other numbers temper the robotics story. Customer contacts fell 5% to 20,630 while revenue per contact rose 16.7%, and the 10-Q credits aerospace and defence demand plus "market dynamics that have driven increases in price". On the Q2 call the CFO added that factory revenue rose 14% while network revenue was flat, because customers are "paying more for speed". Proto Labs is earning more per order in a machining market that is short of capacity.
We are in the early cycle of a lot of industries which are early in innovation. You think about drones, robotics, data centers, satellites, rockets. All of those are early cycle and with a long tail ahead of us.
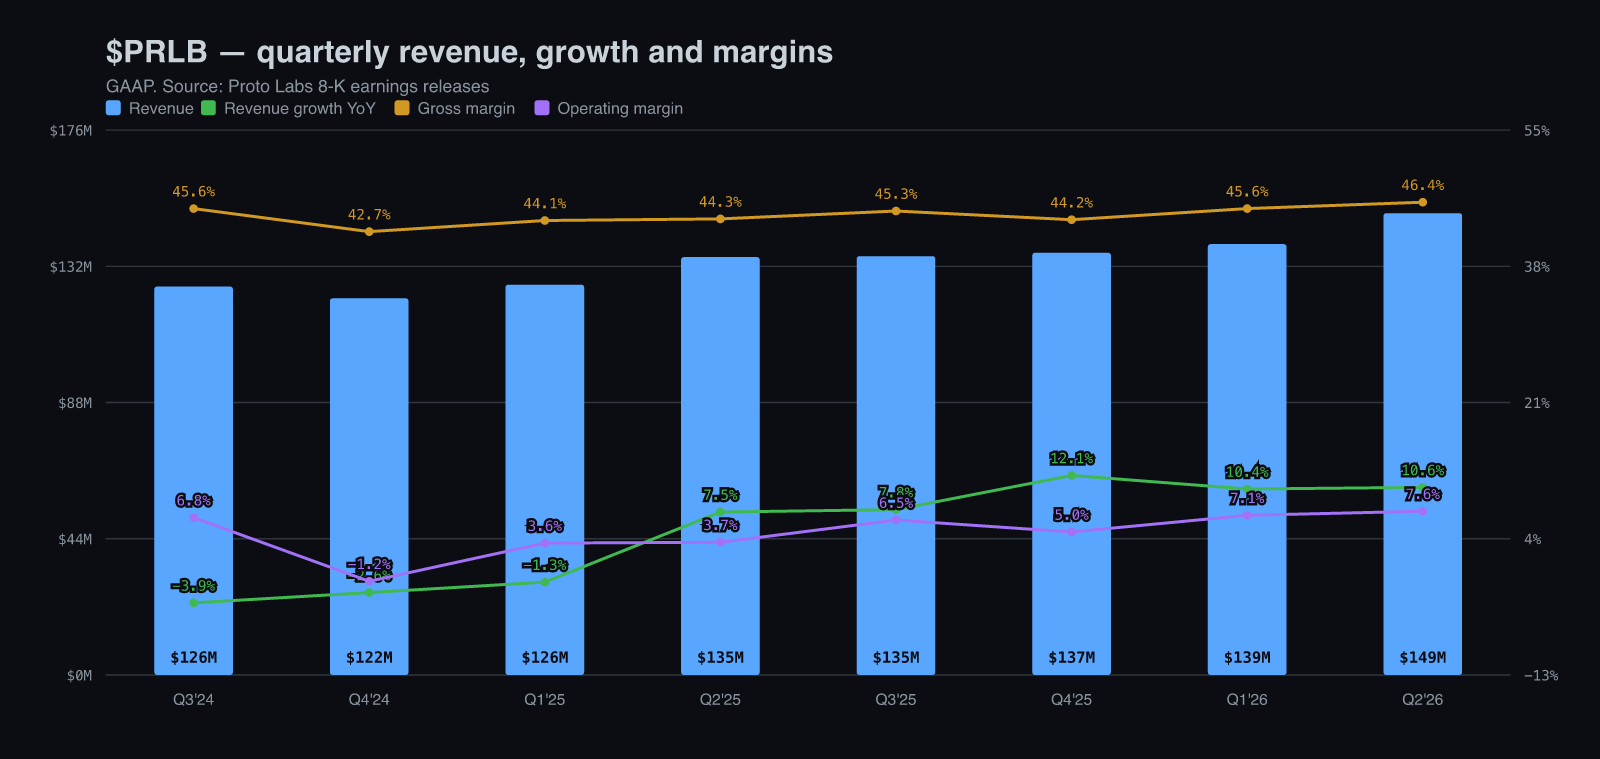
The quarterly series makes the contrast exact. $XMTR revenue by quarter: Q3'24 $141.7M, revenue growth 19%, gross margin 39.4%; Q4'24 $148.5M, revenue growth 16%, gross margin 39.7%; Q1'25 $151.0M, revenue growth 23%, gross margin 37.3%; Q2'25 $162.5M, revenue growth 23%, gross margin 40.1%; Q3'25 $180.7M, revenue growth 28%, gross margin 39.9%; Q4'25 $192.4M, revenue growth 30%, gross margin 39.1%; Q1'26 $205.1M, revenue growth 36%, gross margin 38.3%; Q2'26 $229.3M, revenue growth 41%, gross margin 38.0%. $PRLB revenue by quarter: Q3'24 $125.6M, revenue growth −3.9%, GAAP operating margin 6.8%; Q4'24 $121.8M, revenue growth −2.6%, GAAP operating margin −1.2%; Q1'25 $126.2M, revenue growth −1.3%, GAAP operating margin 3.6%; Q2'25 $135.1M, revenue growth +7.5%, GAAP operating margin 3.7%; Q3'25 $135.4M, revenue growth +7.8%, GAAP operating margin 6.5%; Q4'25 $136.5M, revenue growth +12.1%, GAAP operating margin 5.0%; Q1'26 $139.3M, revenue growth +10.4%, GAAP operating margin 7.1%; Q2'26 $149.3M, revenue growth +10.6%, GAAP operating margin 7.6%. Xometry is buying growth with a little gross margin; Proto Labs is rebuilding operating margin on modest growth, and its gross margin rose from 44.3% to 46.4% over the last four quarters as prices went up.
Set against each other, the two answer different questions. Xometry has four times Proto Labs' growth rate and no factories to fill, so its growth is limited only by how many buyers and shops it can match; Proto Labs earns almost three times Xometry's adjusted EBITDA margin, 16.8% against 6.2%, with no debt and $162.9 million of cash, and earns more when machining capacity is tight, as it is now. Xometry is the better growth asset, Proto Labs the better business per dollar of revenue. Fictiv, the closest private rival, was bought by MISUMI in 2025, and the local machine shop remains the default for repeat work. Both companies are taking share from that local shop, so we hold both.
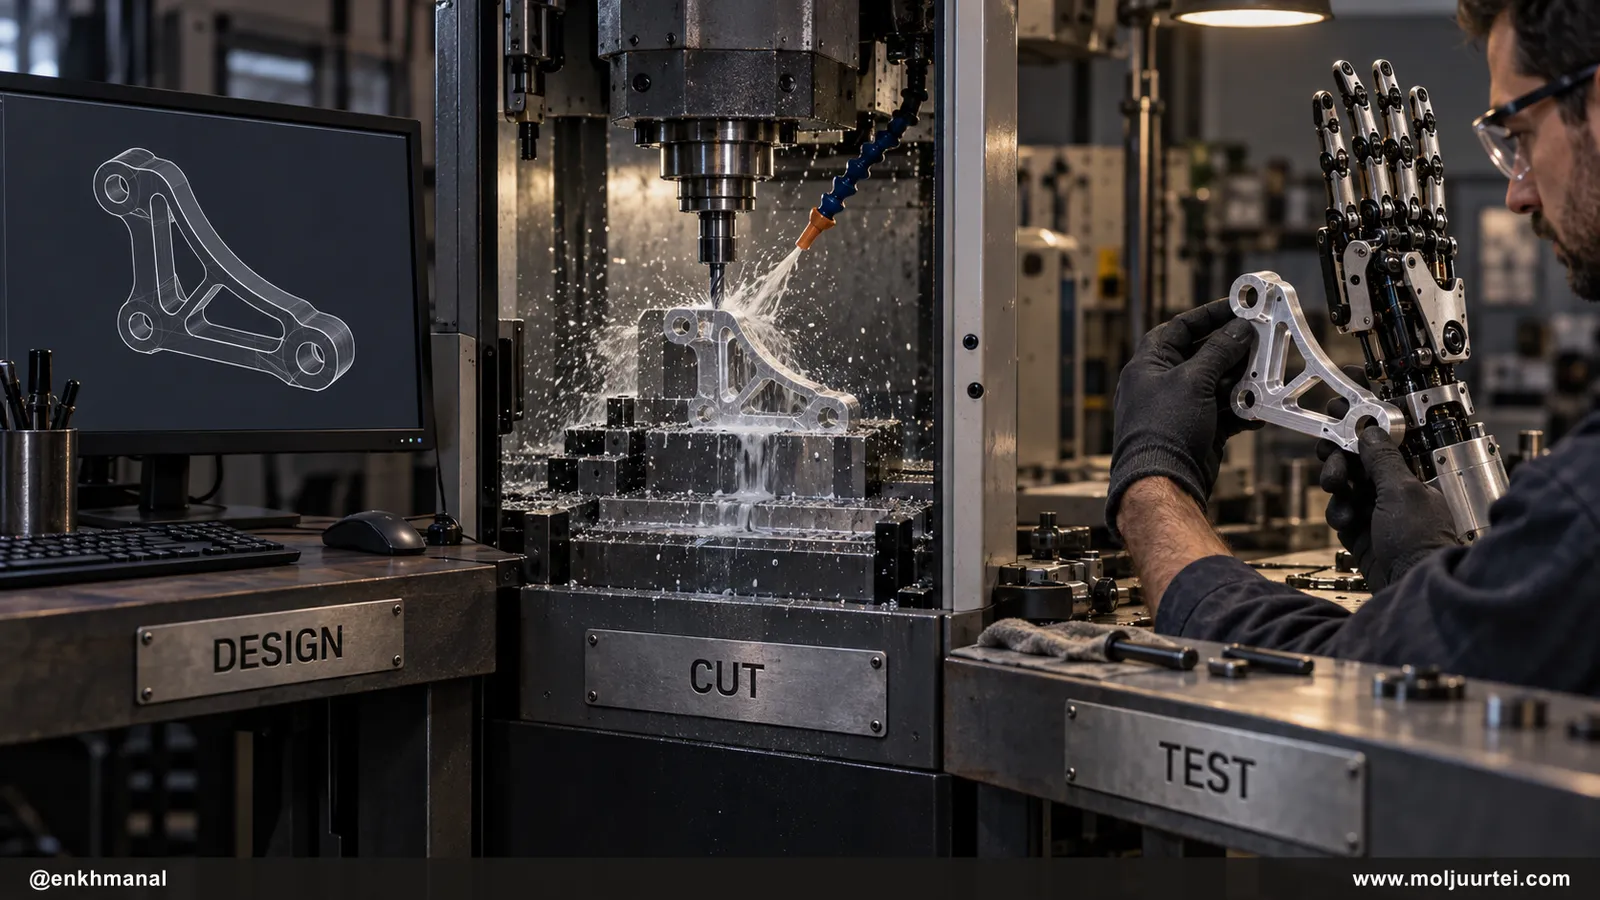
That loop is the whole case for the two shops, and it runs on weeks, not years: a design, a quote, a cut part, a test, a new design.
The Arm Makers: FANUC, Yaskawa and $TER
FANUC is the strongest company in this memo and the one we are least ready to buy today. April-to-June sales rose 17.7% to ¥231.0 billion, operating profit rose 26.1% to ¥53.5 billion, a 23.2% margin, and the company raised its full-year guide to ¥948.1 billion of sales and ¥212.18 of earnings per share, from ¥909.6 billion and ¥198.14 in April (Q1 FY2026 results). It holds ¥615 billion of cash with an equity ratio near 90% and pays out 60% of profit. The weak spot is the robot line itself: orders up 8.1%, falling from 44% of the order book to 35% in a year, while China rose to 31.5% of all orders and the Americas fell to 22.3%. FANUC also told analysts its China delivery times have lengthened and "some customers have adopted competitors'" robots. On physical AI it plans standardised software packages for its own arms, a sensible response that has no revenue attached yet.
Yaskawa is the warning against owning robots for their own sake. In March to May 2026 its robotics revenue rose just 2.0% to ¥56.7 billion and robotics operating profit collapsed to ¥0.9 billion, a 1.6% margin against 9.0% a year earlier, while its motion-control business, the servo motors that go into chip-making tools, grew 21.5% at an 11.2% margin (Q1 FY2026 presentation). Semiconductor-related robot orders rose 141%, so demand is there; Yaskawa held its ¥580 billion revenue guide while it stabilises a new ERP system (Q&A, results). Universal Robots, the cobot most visible in AI-lab demonstrations, sits inside $TER, where robotics revenue rose 33.4% to $99.9 million in the June quarter and still lost $2.6 million before tax, on a company with $1,329 million of revenue driven by AI chip testing ($TER 10-Q). Neither is a way to own this theme.
The Joint Makers: Harmonic Drive and Nabtesco
Harmonic Drive Systems has the best evidence of humanoid money in this memo, and the highest price on it. Orders in April to June 2026 rose 55.7% to ¥24.1 billion and the backlog rose 45.6% to ¥29.5 billion; sales rose 23.6% to ¥16.7 billion and operating profit to ¥1.8 billion from almost nothing (Q1 results). North American orders for its mechatronic units jumped 336% to ¥4.4 billion. On the call the company said it again received a ¥1.2 billion order from a North American AI-robot customer and has one such customer in mass production at real scale, while warning that part of the North American jump was a one-off bulk order for surgical robots (Q1 call transcript). Its US plant is at full capacity and will add 50%. The full-year guide went to ¥74.5 billion of sales and ¥8.5 billion of operating profit, from ¥68.0 billion and ¥6.2 billion in May.
Since a single robot requires a double-digit number of gearboxes, unlike industrial robots, this inevitably leads to cost pressures, and the proportion of the total robot cost accounted for by the gearboxes becomes significantly higher.
That is the most honest sentence any company in the chain has said: more joints per robot means more gears, and also a customer who needs those gears cheap. Harmonic Drive expects its AI and humanoid sales to grow from ¥1.9 billion in 2025 to ¥13.3 billion in 2030, and is targeting more than ¥100 billion of total sales and an operating margin above 15% by then (medium-term plan). On those targets, earnings per share would be roughly ¥110, and today's ¥6,570 share price is about 60 times that 2030 number. The competition is real: China's Leaderdrive says it sold more than 300,000 strain-wave reducers in 2025, as JPAI documents from primary sources (JPAI).
Nabtesco is the challenger and the cheaper ticket. It estimates it holds about 60% of the market for the RV reducers in the shoulders and bases of medium and large arms, and its precision-reducer sales were ¥45.1 billion in the first half of 2026, with the full-year forecast raised to ¥94.6 billion from ¥88.2 billion (sales data, H1 summary). The segment's operating margin doubled to 10.6% and its orders rose 26%, but management credits Chinese and Korean carmakers, machine tools and chip equipment, not humanoids (Q2 briefing). Its answer to Harmonic Drive is RVmini, a compact strain-wave reducer whose first deliveries began this year at under ¥200 million of sales, as Japan Robotics Intelligence notes (Japan Robotics Intelligence). Nabtesco also restated its first-half and 2025 results on 30 September for an accounting error at an affiliate. At about 24 times this year's guided earnings it is the value option; Harmonic Drive, at about 104 times, is the growth option.
Management & Track Record
Xometry changed chief executive on 1 July 2026, when Sanjeev Singh Sahni, president since January 2025 and previously at Wayfair, took over from founder Randy Altschuler, who stays as executive chairman. The record under the outgoing team is strong on growth and weaker on promises about profit: the company was adjusted-EBITDA negative by $9.7 million in 2024 and positive by $18.5 million in 2025, and has beaten and raised its own outlook in every 2026 quarter. Shareholders have paid for some of that with dilution.
Proto Labs has been run since mid-2025 by Suresh Krishna, who followed Rob Bodor and has pushed the company from prototypes toward production work, raised prices on machining, and launched an efficiency programme: GAAP operating margin doubled year on year in the June quarter. The company has no debt, generated $74.5 million of operating cash in 2025 and has a $100 million buyback authorisation.
FANUC's management under-promises: it raised the full-year guide at its first quarter and keeps a 60% payout policy, though it has been slow to admit the China share losses its own Q&A now describes. Harmonic Drive's record is more volatile: sales fell 22% in the year to March 2024 and the company posted a ¥24.8 billion net loss, then raised its profit forecast in April 2026 and again in August. Nabtesco's 30 September restatement is a governance mark we will watch at the 30 October results.
Risks & What Breaks It
What forces a change of view: a Q3 print where $XMTR misses its own $234–236 million revenue guide or $PRLB's GAAP operating margin falls back below 6%; a close below the 200-day average in either; a second consecutive quarter of falling FANUC FA orders; or Harmonic Drive reporting a second large AI-robot customer in production, which would turn its wait into a buy on a pullback.
Price Setup
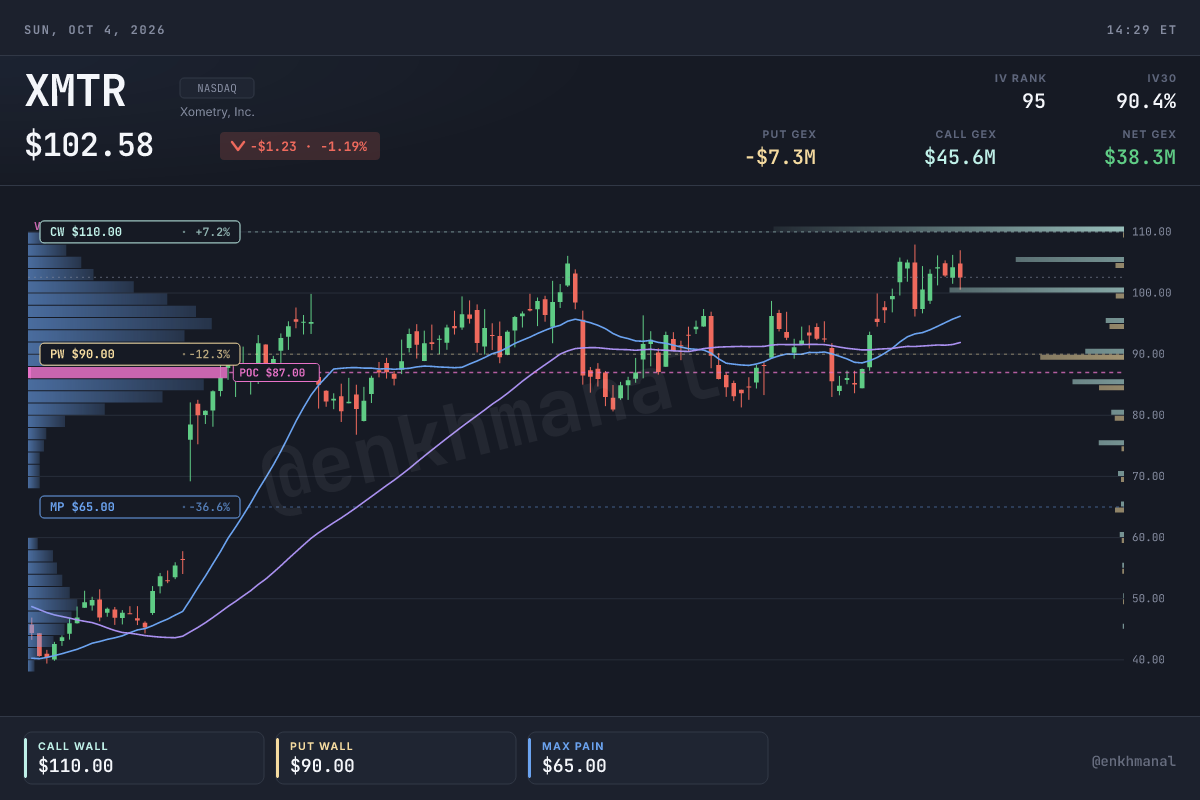
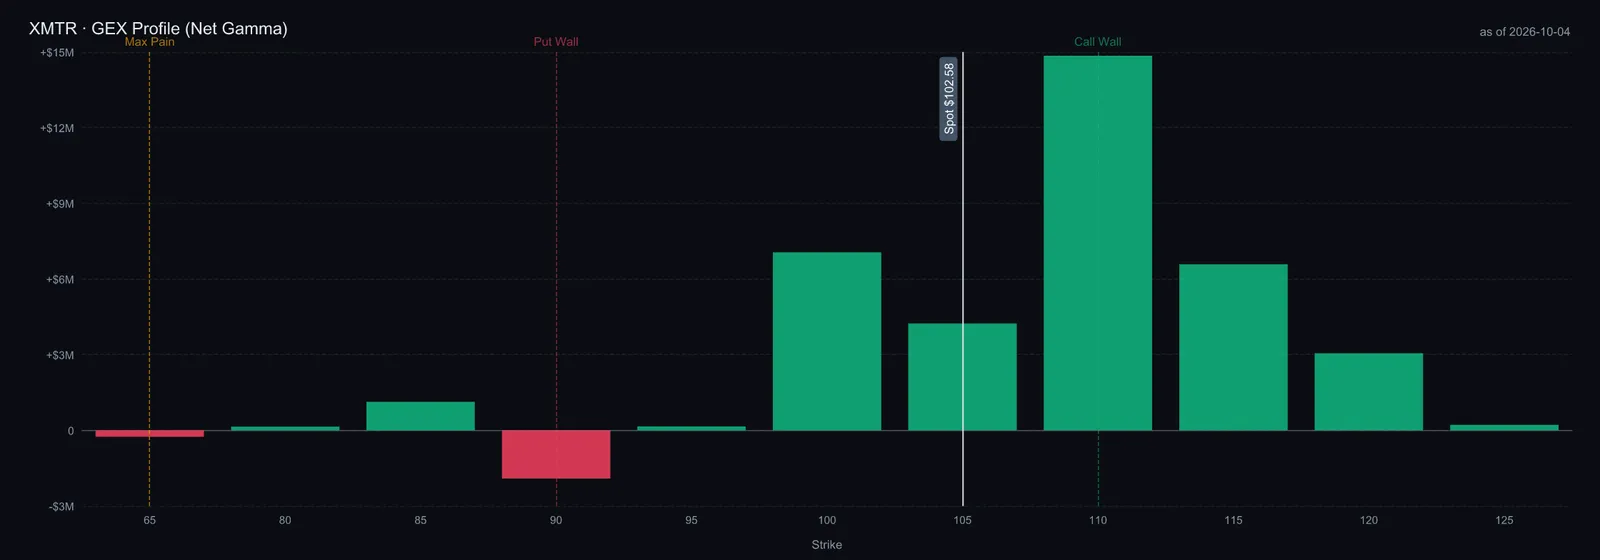
All seven names are up over the past year, from 44% for FANUC to 218% for $TER, but only five trade above both moving averages, and FANUC and Yaskawa are not among them. On 2 October $XMTR closed at $102.53, 11.6% above its 50-day average and 41.6% above its 200-day; options put the call wall at $110 and the put wall at $90, with implied volatility near 90% into the 3 November results.
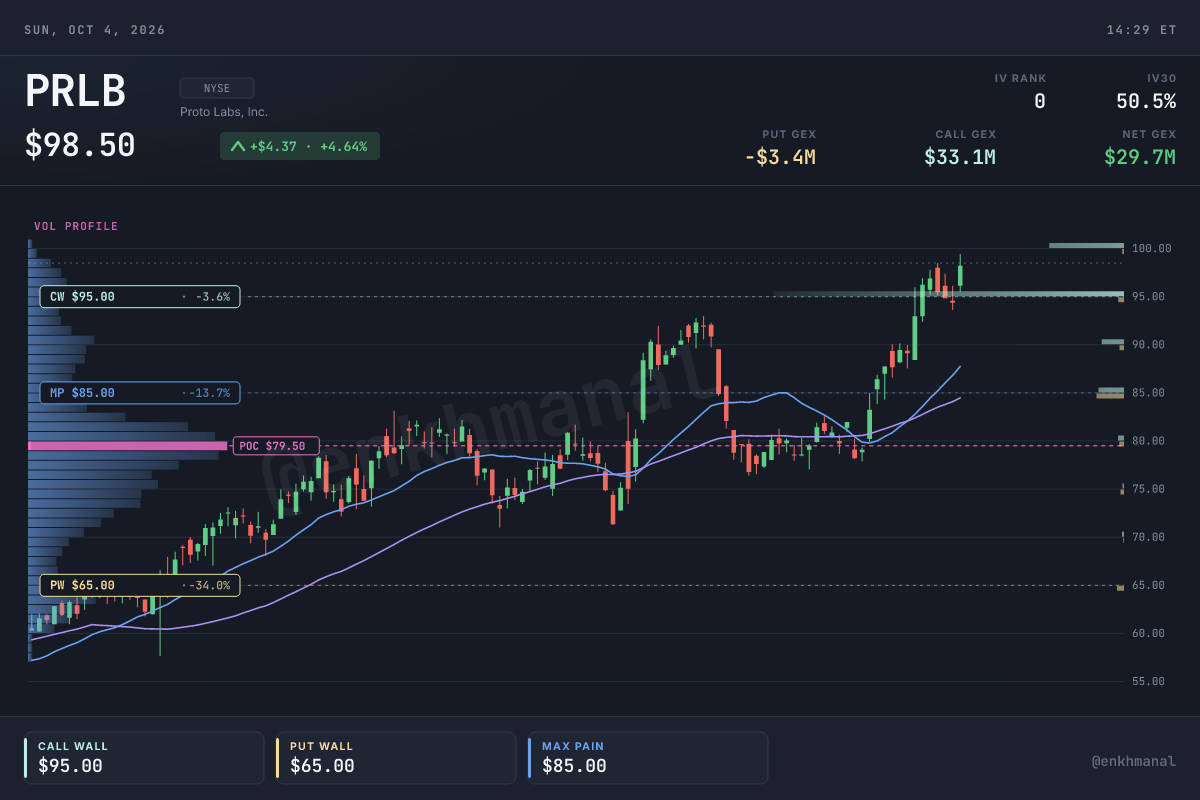
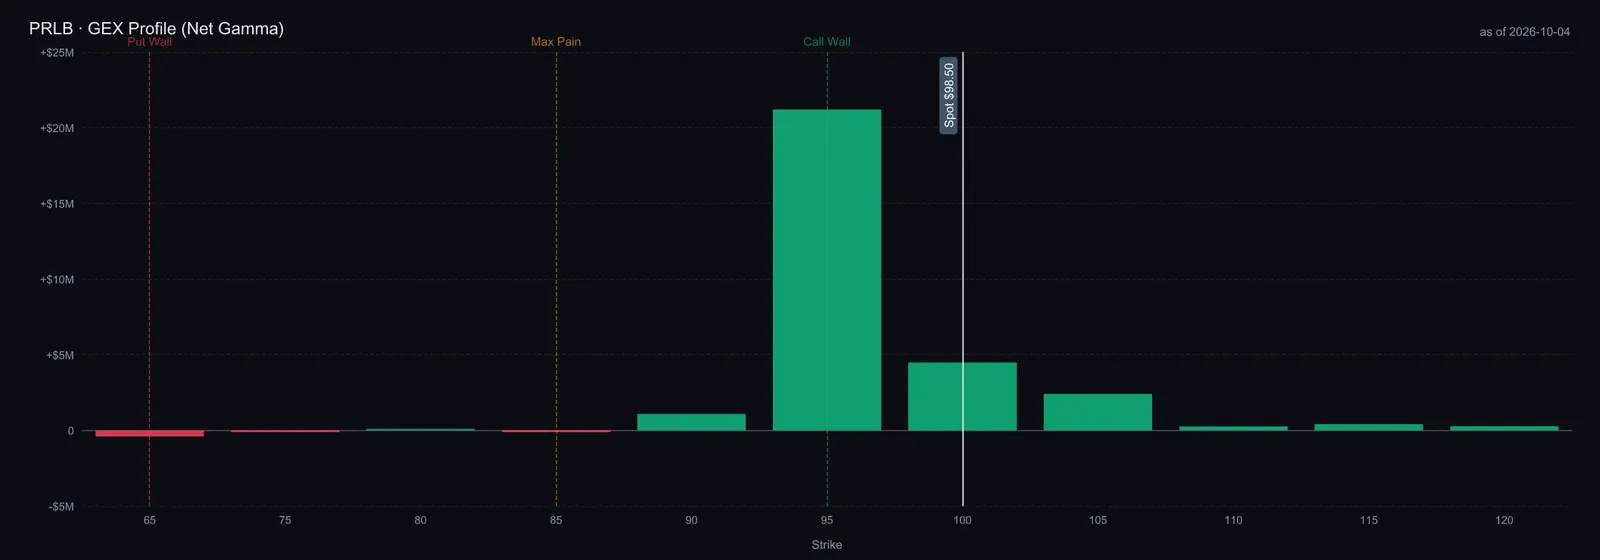
$PRLB closed at $98.21, a new 52-week high, 16.2% above its 50-day average and 41.0% above its 200-day, and above its $95 call wall, with the put wall far below at $65; results land on 30 October. A first position near the 50-day average, around $85, is a better entry than chasing the high.
In Tokyo, Harmonic Drive closed at ¥6,570, above both its 50-day (¥6,154) and 200-day (¥5,366) averages but 26% below its ¥8,890 high; Nabtesco at ¥4,926 sits just above both. FANUC at ¥6,075 is below its 50-day (¥6,187) and 200-day (¥6,551) averages, and Yaskawa at ¥4,806 is 10.5% below its 200-day.
Valuation & House View
We tested each name the same way: at the 2 October close, what yearly growth in its per-share earnings base would earn a 10% annual return over three years at two plausible exit multiples. The arithmetic is the required growth rate = (price × 1.1³ ÷ exit multiple ÷ base)^(1/3) − 1. The base is the company's own guide where one exists; for Proto Labs it is our estimate built from its first-half GAAP earnings of $0.71 and its third-quarter guide, and for Xometry it is guided 2026 revenue per share, because it has no GAAP earnings.
The screen sorts the names cleanly. FANUC needs only 6–15% yearly earnings growth to clear a 10% return, the easiest bar in the group, which is why it stays first in line once its price trend turns. Harmonic Drive needs 32–51% a year, a price that already counts on most of its 2030 plan. Xometry clears the bar at today's sales multiple if it grows revenue per share 12.5% a year against a 33–34% guide, but loses it if the market pays the 2024 multiple again. Proto Labs needs its GAAP earnings to compound above 20% for three years, which only a return toward the 17% operating margin it earned in 2019 delivers.
Our house model is harsher than the screen, and we say so plainly. On management's guidance with margins held at 2025 levels, the Proto Labs workbench model values the shares at $38.42 on a perpetuity and $42.96 on a 9× exit multiple, with a bull case of $55.89; the internal rate of return at $98.21 is 4.8%, and no growth rate between −20% and +40% justifies the price at today's margins. The model's audit has no failures and two warnings that stand: no listed comparables exist to set the exit multiple, because Xometry has no positive EBITDA history and Fictiv is private, and the multiple of 9× is far below the 32.4× the stock trades at on this year's guide. Xometry cannot be modelled in the workbench at all yet, because it reports no single SG&A line; a hand version using management's 20% incremental EBITDA margin lands near $75. Both buys are therefore bets on growth and trend persisting long enough for margins to catch up, not on the model, and we size them that way.
We buy $XMTR and $PRLB in small starting positions, adding on the 3 November and 30 October prints if Xometry delivers at least $234 million of revenue and $16 million of adjusted EBITDA and Proto Labs' GAAP operating margin holds above 7%; we exit either on a close below its 200-day average, $72.40 and $69.65 today. FANUC becomes a buy when it reclaims its ¥6,551 200-day average with second-quarter orders, due 23 October, above ¥250 billion. Harmonic Drive becomes a buy on a pullback toward its ¥5,366 200-day average or on a second production-scale AI-robot customer at its 11 November results. Nabtesco stays on watch as the cheaper reducer; Yaskawa and $TER stay out. We review the whole basket by 12 November.