

CAMT — Inspection before bonding, orders before revenue
$CAMT is Camtek, an Israeli maker of optical inspection and metrology tools used between semiconductor manufacturing steps. This August 24 research examined a reported 75% advanced-packaging revenue mix, more than $600M of orders since January versus $496M of 2025 revenue, and management’s expectation that most new orders were for 2027 delivery. The November 4 update below tests that thesis against reported results. All August prices, options levels, consensus estimates and scenarios remain historical.
November 4 update — the revenue step-up was delivered
Camtek reported Q3 today: $161.3M revenue, above August’s $158–160M guide, up 28.0% year on year and 21.1% sequentially using printed figures. Non-GAAP operating margin reached 29.5% versus 27.0% in Q2; GAAP margin was 24.7%. Adjusted EPS was $0.99; operating cash flow $71.1M. These preliminary unaudited results confirm the shipment step-up, not every 2027 assumption.
The October 14 investor event has passed. Management now expects about $180M Q4 revenue, about $595M for 2026 and over $800M in 2027. These are outlook figures, not completed sales. The October presentation and today’s release supersede the August no-2027-guidance premise. The old November 9 calendar date was wrong: results arrived November 4. China exposure, customer delays and future margin/cash conversion remain open risks; August price and options levels are historical.
Smaller features and stacked chips both need inspection
The broader equipment cycle offers supporting evidence: in its August 13 earnings commentary, $AMAT reported DRAM revenue, including HBM packaging, up 52% year on year and expected advanced-packaging revenue growth above 70% in calendar 2026. DRAM is working memory; HBM stacks that memory near processors. This supports the industry investment theme, but does not establish Camtek orders or revenue.
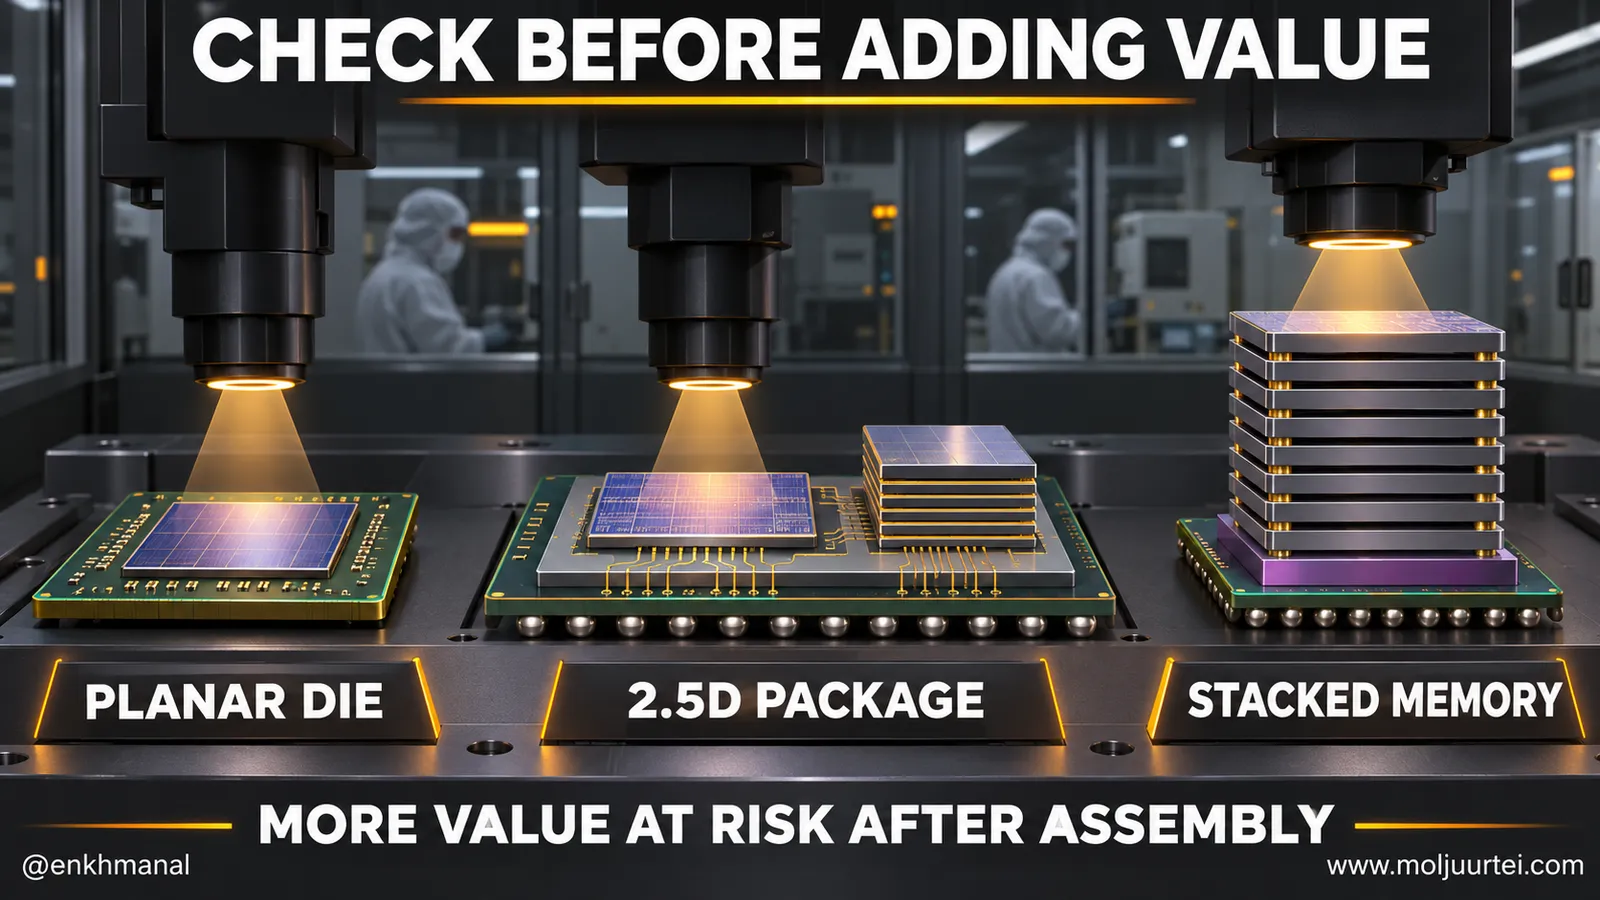
A transistor is a tiny switch controlling electrical current. Many are fabricated on a silicon wafer, which is later cut into individual dies. Shrinking features has delivered computing gains for decades, but manufacturing cost and memory-bandwidth limits also encourage chiplets and stacked memory. In a 2.5D package, logic and memory sit beside one another on an interposer connecting them. Memory dies can be stacked eight, twelve or sixteen high. Some advanced designs use direct copper-and-dielectric hybrid bonding; conventional micro-bump stacks remain important. Inspection already occurs at multiple stages in planar manufacturing, not only once at the end.
Bonding an additional die puts value already built into the stack at risk. Direct hybrid bonding can be difficult or uneconomic to rework; a late defect can damage the economics of the entire assembly. The outcome depends on the defect, process and package design, rather than every defect necessarily scrapping every die. More layers increase the value protected by a check before commitment.
August orders extended into 2027 delivery
Two things make this Camtek's moment rather than a generic semiconductor-equipment story. It is unusually concentrated — about 75% of second-quarter revenue was advanced packaging, most of it AI-related, where larger peers spread across front-end process control. And it has just refreshed its entire product line into that transition: the Eagle G5 launched September 2024, the Hawk February 2025, and together they were 50% of systems revenue in the second quarter of 2026. This demonstrates adoption of new products, not proof that every purchase was a new process-step qualification.
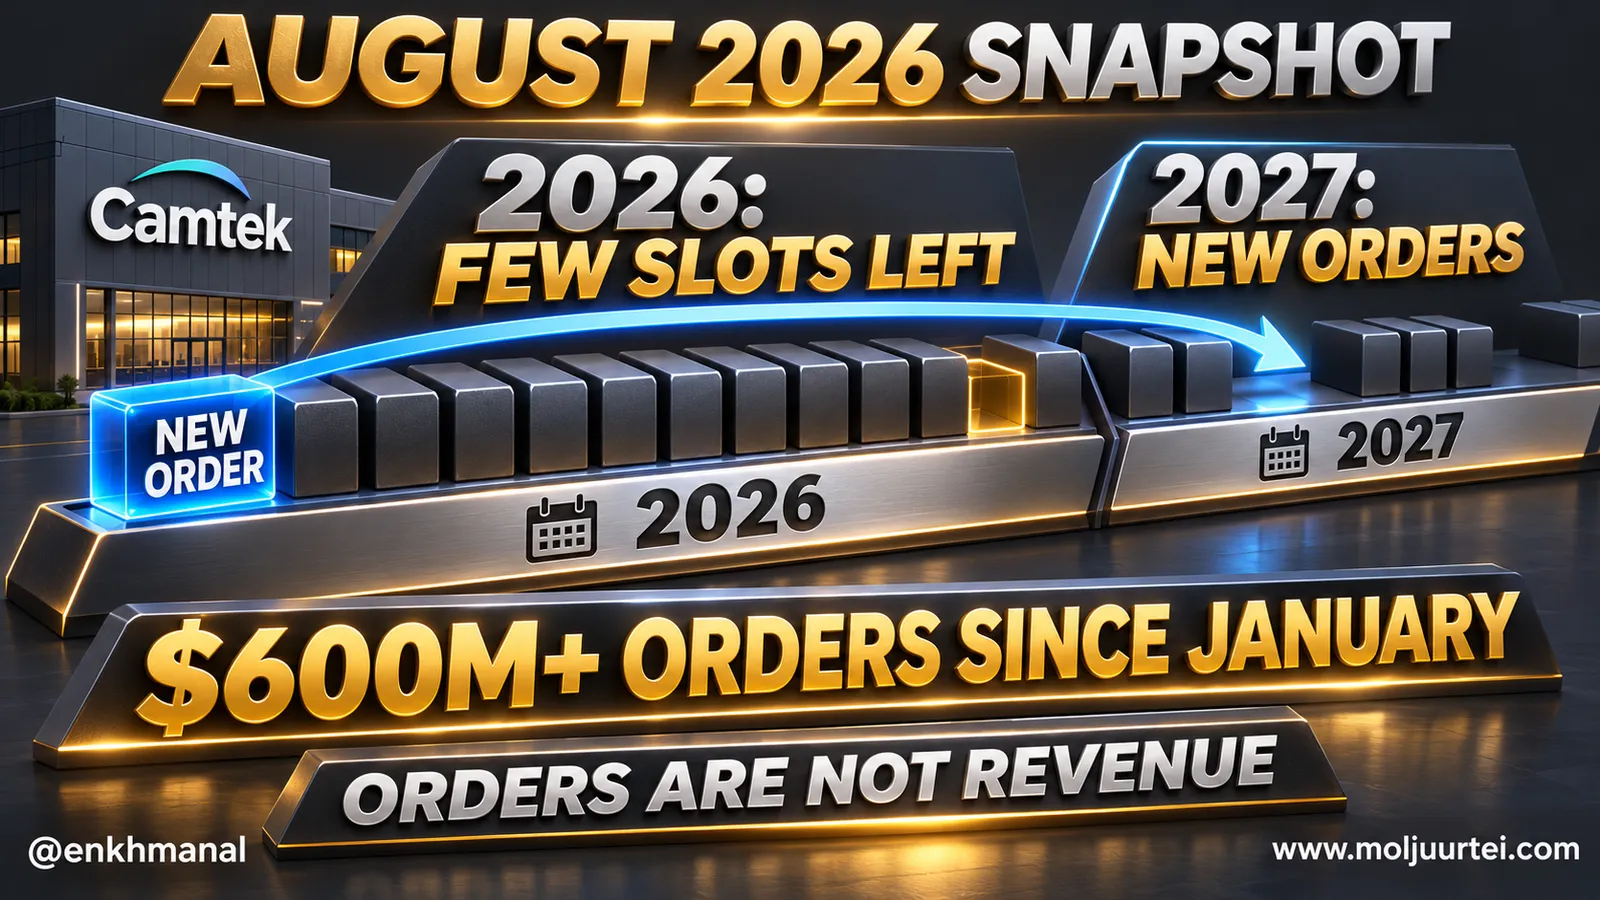
We're still seeing some orders from 2026, yes, but there are very few. Most of the orders that we are getting today and will be getting in the second half of the year will be for 2027.
Camtek was founded in Migdal HaEmek, Israel and listed on Nasdaq in 2000. It combines an electro-optical imaging head, a precision moving stage and proprietary image-analysis algorithms. Customers include outsourced assembly/test houses, integrated device manufacturers and wafer-level packaging subcontractors. The installed base exceeded 3,000 systems at the end of 2025. One customer represented 11% of 2025 revenue versus three at 15%, 10% and 10% in 2024.
The October 14 portfolio now presents NanoProf for nanoscale metrology and the 360°Scan add-on for Eagle and Hawk backside/perimeter inspection. This extends the August product snapshot; it does not establish that every older Eagle or MicroProf model is discontinued. October presentation.
Product families and the physical inspection problem
The 2025 annual report identifies Eagle, Hawk and MicroProf as current platforms; Falcon, Condor and Gannet were phased out. Hawk, launched February 2025, targets chiplets, HBM and hybrid bonding. The company specifies detection of 150 nm defects and measurement of 500 million micro-bumps at pitch below 12 µm. These describe different capabilities: bump pitch is centre-to-centre spacing, not the defect size. Optical inspection images the surface and algorithms classify features; dimensional metrology measures their geometry. A factory needs both useful sensitivity and sufficient throughput, not just a high-resolution laboratory image.
The Eagle G5 is the high-throughput workhorse for multi-layer redistribution, fan-out wafer-level packaging, 2.5D and image sensors, pushing detection to 1.4 micron line-and-space at twice the previous throughput. The MicroProf line measures the third dimension — photoresist thickness, through-silicon via depth, trench profiles, bump height through thinning and bonding. Golden Eagle handles fan-out panel-level packaging, where the substrate is a rectangular panel rather than a round wafer.
Tools are qualified for customer process recipes. Replacing a qualified Hawk can require revalidation of that step, creating switching friction during an HBM ramp. This is a commercial advantage, not proof that customers cannot switch or that competing tools cannot qualify.
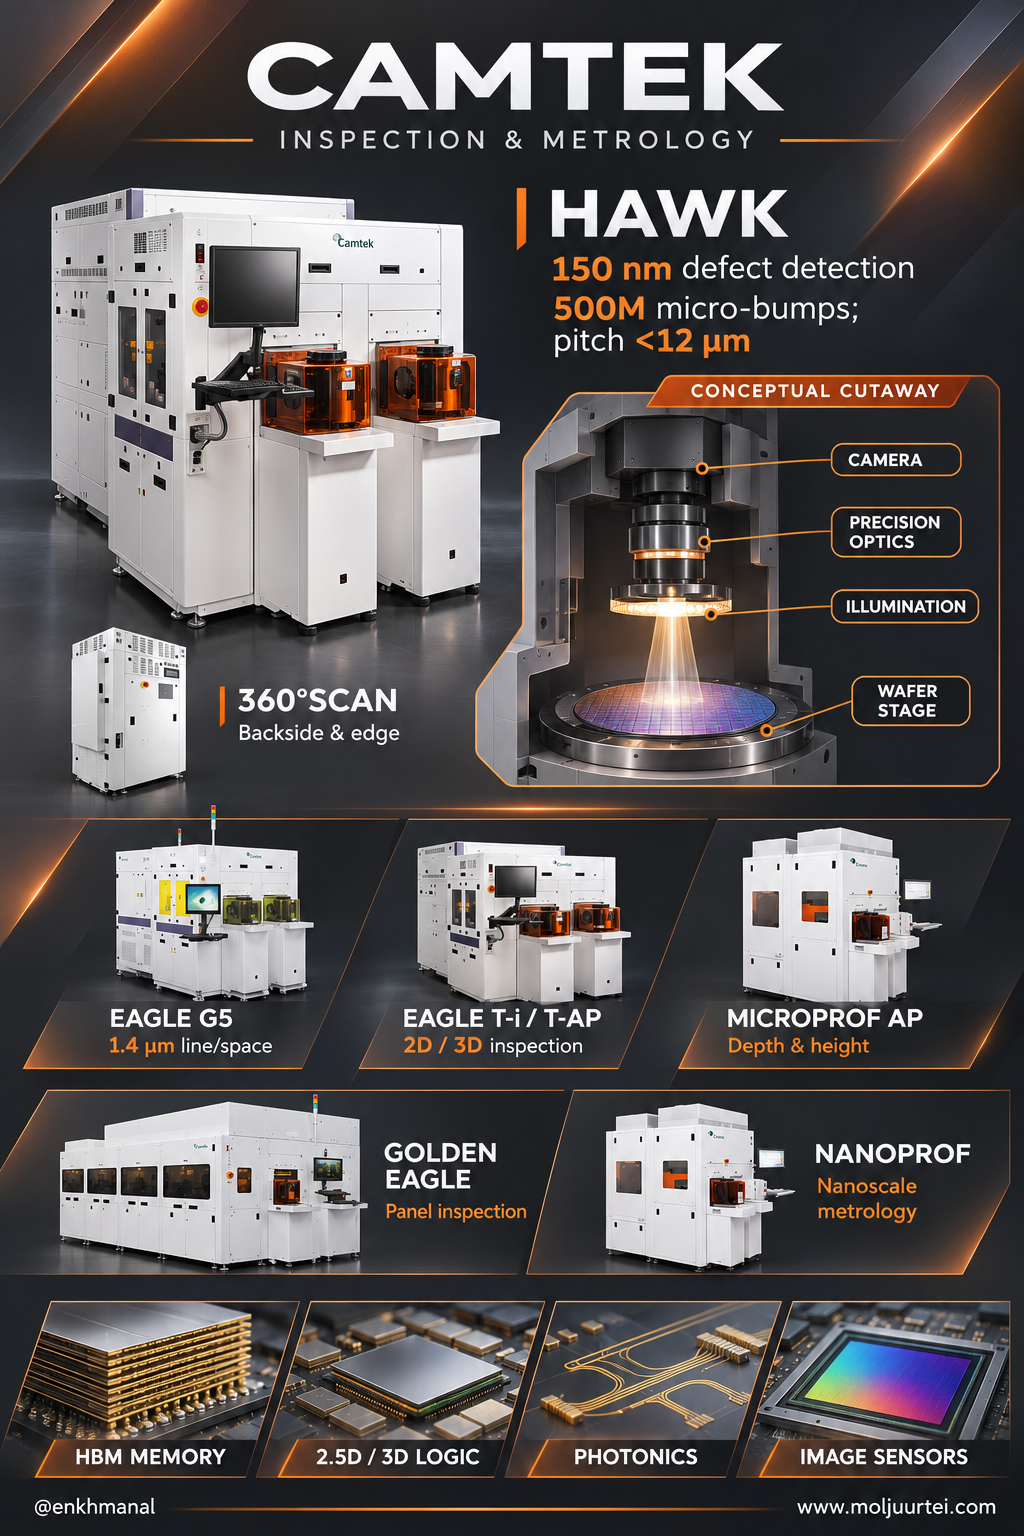
The Eagle family also includes EagleT-i/Plus for 2D inspection and EagleT-AP/Plus for combined 2D/3D inspection and metrology. The 20-F lists Golden Eagle panel inspection alongside these systems. The research also linked panel-level packaging opportunities to $TSM’s investment direction; that is an industry link, not a disclosed Camtek order from that customer.
Research spending rose ahead of the ramp
Research and development ran $16.7M in the second quarter, up 45.2% year on year from $11.5M, and $31.0M across the first half against $21.8M. That is the single biggest reason reported operating margin fell, and it is deliberate. Three things are being funded: breadth within existing customers (a high-resolution backside inspection module, fluorescence illumination for detecting organic residue); MicroProf as a launched metrology platform; and artificial intelligence.
Camtek announced the Visual Layer acquisition on April 14, 2026 and completed it in Q2. The visual-AI capability can improve inspection and defect classification and may support software and analytics sales. H1 goodwill rose $38.4M and intangibles $6.6M; those balance-sheet movements are not a verified acquisition-price calculation. Cash and securities were about $816M. The 20-F described offering AI inspection and automatic defect classification during 2026; a material recurring software revenue stream was not established in the August results.
Revenue rose from $315.4M in 2023 to $429.2M in 2024 and $496.1M in 2025; the August 2026 consensus was $593.2M. The reported order intake exceeded $600M since January, around 80% advanced packaging and over 20% HBM makers. Orders and revenue cover different periods and recognition stages: their comparison shows scale, not a guaranteed growth rate.
From a narrow revenue range to a guided step up
Six reported quarters ran between about $118M and $133M. Q1 2026 grew 2.6% year on year and Q2 grew 8.0%. The August Q3 guide of $158–160M implied about 19.4% sequential growth at the $159M midpoint using rounded printed Q2 revenue of $133.2M; management described it as approximately 20%. Orders supported the outlook but did not make shipment or revenue recognition certain.
Can the company ship the ramp? Subcontractors handle sub-assembly and power-up; some essential components have single or limited sources. Final integration and test take six to twelve weeks in Israel and Germany. Current inventory fell from $112.2M at year-end to $99.8M at June 30 while receivables rose from $90.8M to $153.9M. These balances are consistent with shipments from prepared inventory, but do not independently prove capacity readiness or cash collection.
We have all the subcontractors and supply chain in place, and we're very confident about our ability to ship the machines on time, and we don't see any issues or obstacles when we discuss capacity.
The August model implied Q4 revenue of $179.3M and a $717.2M annualized pace, about 20.9% above its $593.2M full-year estimate. This was a modelled exit pace, not banked growth or reported revenue. Non-GAAP operating margin improved from 25.5% in Q1 to 27.0% in Q2, a 1.5 percentage-point increase. The August consensus estimate of $47.9M Q3 operating income on $159M revenue implied 30.1%; the November update gives the actual margin.
We definitely plan to see some increase in our OpEx level, but not to the extent that will exceed the revenue growth. The leverage we have in the model will play a major role in the improved profitability in the next few quarters ahead.
Rafi Amit was CEO, Moshe Eisenberg CFO and Ramy Langer COO in the dated research. Management had navigated the 2019 downturn, 2021–22 boom and 2023 pause. Q2’s $133.2M exceeded the cited $130M consensus; the research called it a fourth consecutive revenue beat. In August management would not quantify whether a 35–40% exit growth pace would persist through 2027. The November update records the subsequent quantified outlook.
The insider-sales discussion cited $1.07M for the CEO, $1.10M COO and $0.71M CFO plus three others, nine Rule 144 notices during August 12–18 and option exercise strikes of $22.63 and $63.51. Proposed-sale filings must be separated from executed transactions and reconciled without double counting. The source’s claim that $141.99 was 19% below $175 is arithmetic (18.9%), not proof of insiders’ motives or a realized investor return.
China accounted for about half of 2025 revenue
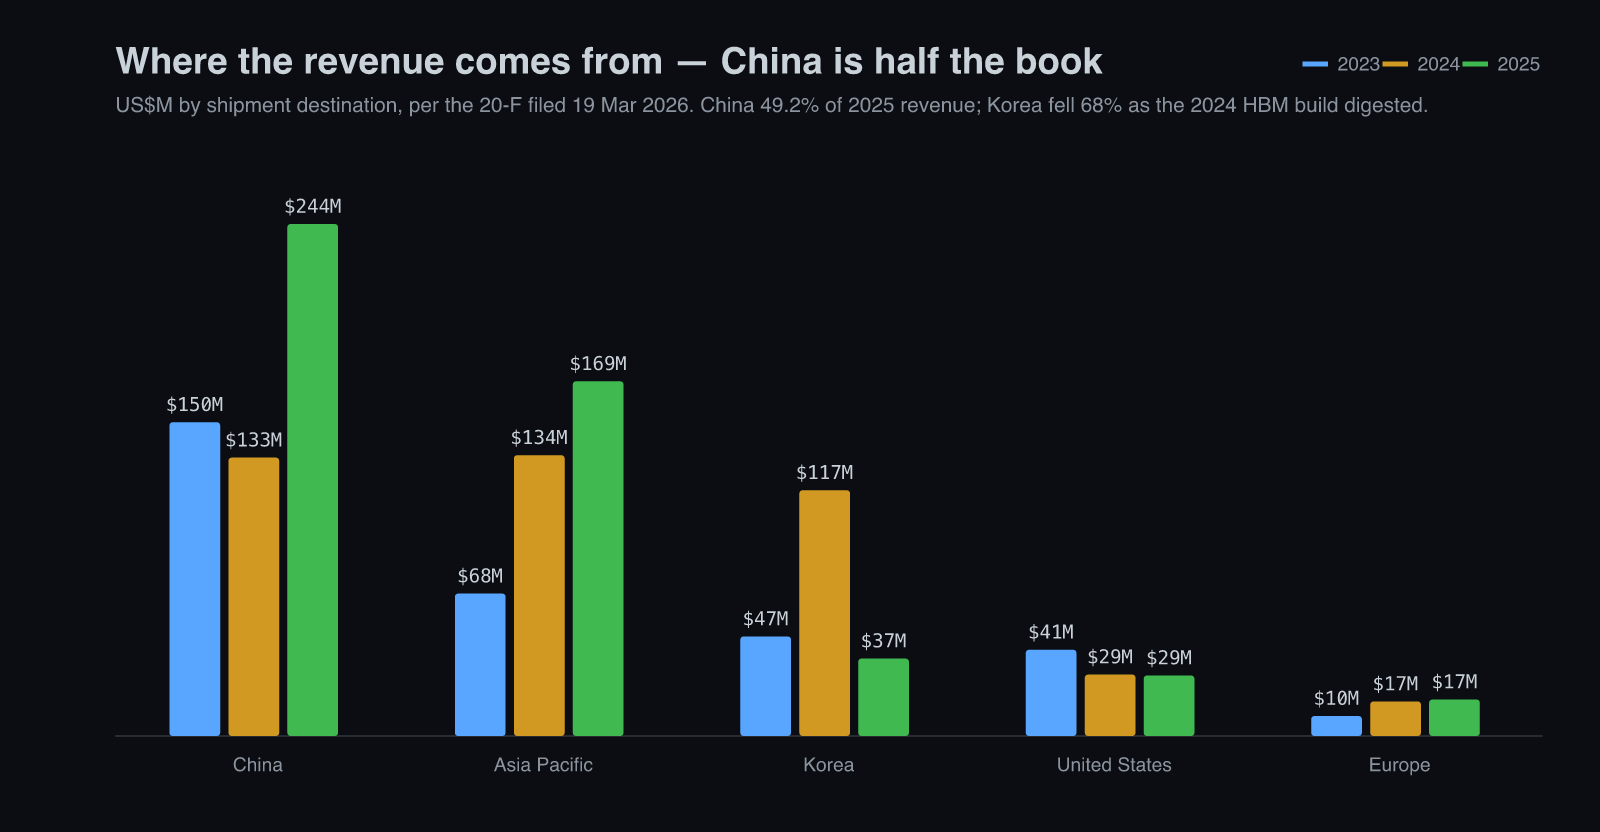
China was $243.9M of $496.1M in 2025 — 49.2%, up from 30.9% in 2024. Korea went the other way, from $117.1M to $36.9M, a 68.5% fall, as the 2024 memory build digested. The 20-F names the exposure directly: the U.S. Commerce Department kept adding Chinese semiconductor manufacturers to restricted-entity lists through 2025, and the restrictions can reach a non-U.S. company like Camtek where there is a U.S. nexus or U.S.-origin content above threshold. An action aimed at Chinese advanced packaging would hit roughly half the 2025 revenue base. Geographic exposure is not the same as revenue already prohibited by sanctions.
The August book included over 20% HBM customers and more than half outsourced assembly houses. These customer categories can support diversification, but neither category establishes shipment geography or absence of China exposure. A lower China share is a hypothesis to test against subsequent geographic disclosures, not a disclosed 2026 percentage.
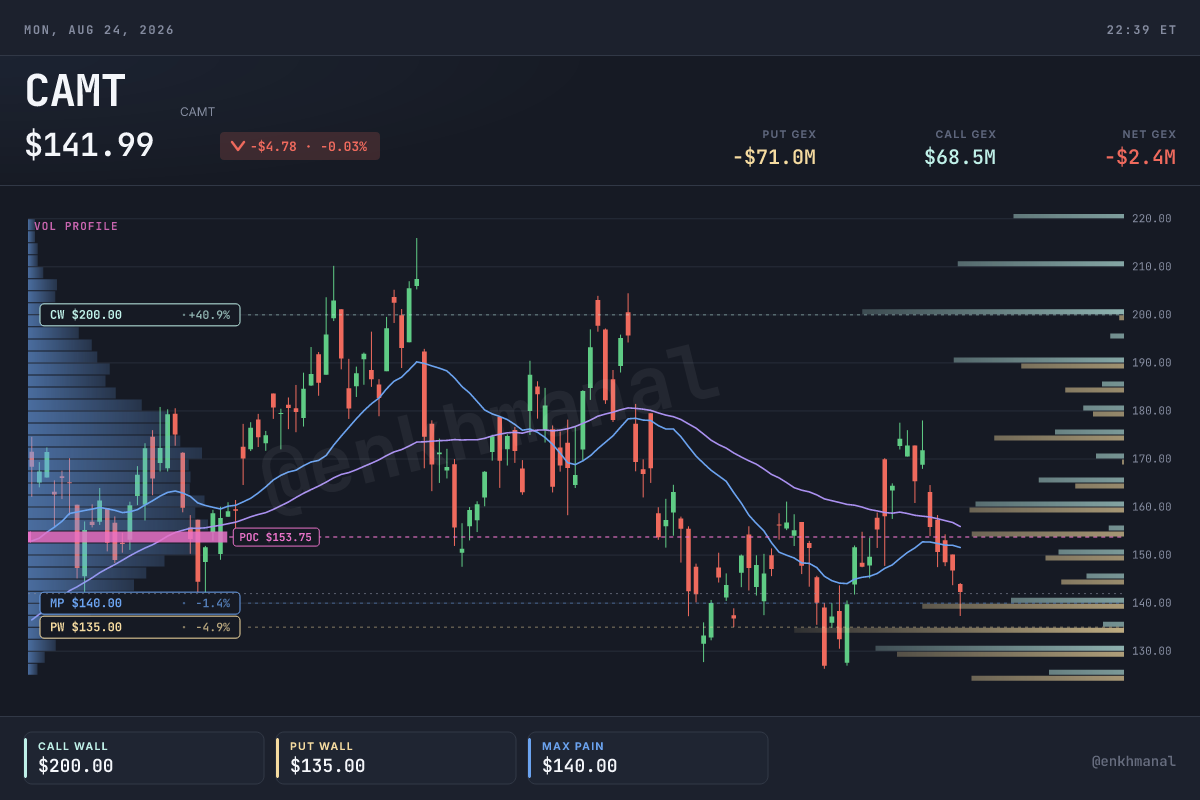
Historical price context: $141.99 on August 24 was down 3.3% that day, 20.1% below the August 17 intraday $177.77 and 31.7% below the May 11 close of $207.78. May’s intraday high was $215.81. It remained 33.6% above $106.29 at the start of the year. Historical targets were Morgan Stanley $165 after its August 11 cut, Stifel $170 after August 10 and a 12-analyst average of $185.45, 30.6% above the August reference. These are archived price observations, not current targets.
Historical August price and options positioning
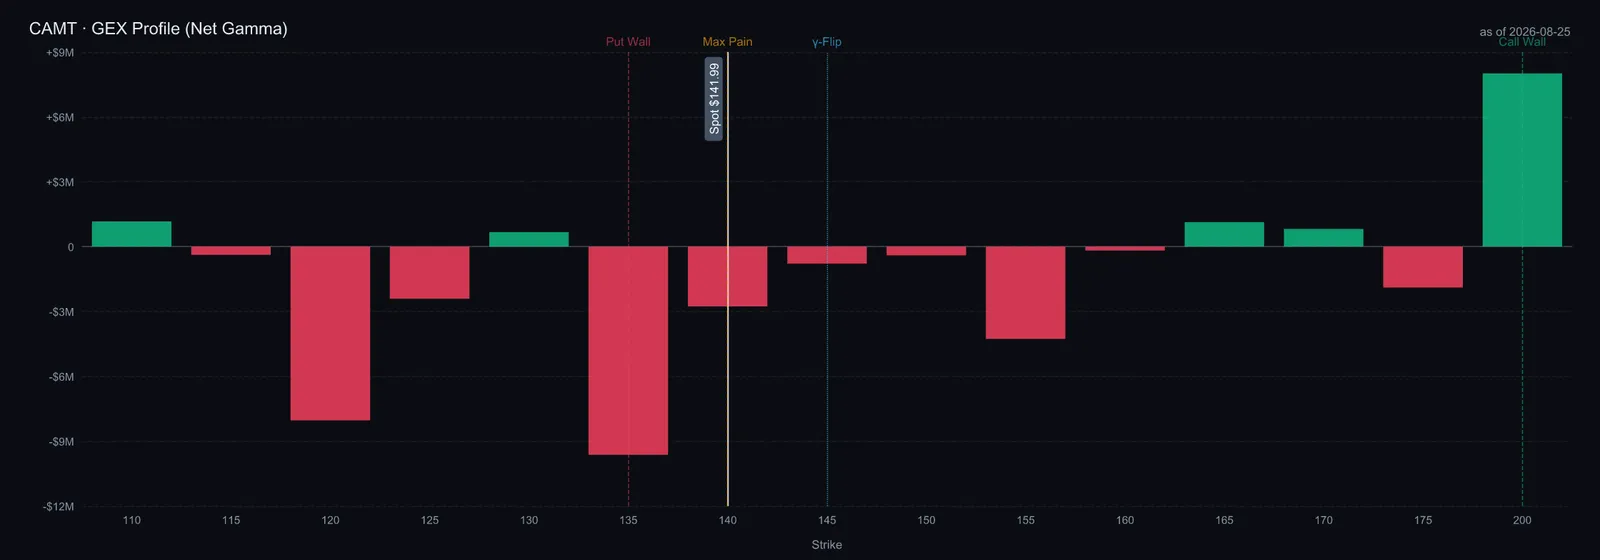
The August 10 earnings-day session opened at $168.52, traded $148.84–169.72 and closed $158.18 on approximately four times normal volume. After a recovery to $174.14 on August 12, the August 24 close was $141.99. The historical map put put wall at $135 and call wall at $200; these are option-position concentrations, not guaranteed support or a mechanical trend-change test. The gap to $135 was $6.99, not four dollars. The July low was $126.50. Current positions can differ.
Historical valuation and the 2027 assumptions
Historical valuation inputs: 46.67M shares at $141.99; $815.8M cash/deposits/securities; $488.5M convertible carrying value; $593.2M revenue estimate and $3.61 non-GAAP EPS estimate.
At the August $141.99 reference, equity value was $6.63B on 46.67M shares. Cash, deposits and securities of $815.8M less $488.5M convertible carrying value gave about $327M net liquidity and $6.30B enterprise value. Against the August $593.2M revenue and $3.61 non-GAAP EPS estimates, ratios were 10.6× revenue and 39.3× earnings. The research’s dated peer snapshots were $ONTO at 27.6× forward earnings, $1.12B trailing revenue and 8.1% growth, and $NVMI at 29.2×, $937.5M and 16.2%. Period and estimate differences prevent a clean like-for-like valuation inference. Against the modelled $717.2M exit pace, EV/revenue was 8.8×, not a reported annual-sales multiple. The model assumed 19.6% 2026 revenue growth but 10.8% EPS growth as research spending rose. These are historical assumptions, not present valuation or guidance.
Scenario terms: EPS; non-GAAP; HBM4; 3D; P/E. The 2027 model is a historical August sensitivity, not updated guidance.
The historical scenarios assumed 51.5M diluted shares, $28M annual financial income and a 15% tax rate: (revenue × operating margin + financial income) × 85% / diluted shares. EPS × multiple gives approximately $83, $148 and $194, or −42%, +4% and +37% versus $141.99. The August base case was near that price; the upside depended on 2027 growing beyond a modelled exit pace. October 14 SEMICON West and the subsequent quarterly report were the evidence tests. Both have now occurred: the actual release was November 4, not the November 9 date anticipated in August. The new above-$800M company outlook supersedes the statement that management had not quantified 2027.
The constructive case is a real manufacturing need, concentrated advanced-packaging exposure and a product refresh that customers are adopting. Q3 now confirms shipment acceleration, while the 2027 outlook raises the revenue ambition beyond the old base case. It does not guarantee orders, software earnings or the old bull-case margin. China exposure, customer investment delays, supply constraints and dilution remain central risks. Historical options levels do not decide whether the business thesis survives; subsequent shipments, cash collection and margins do.